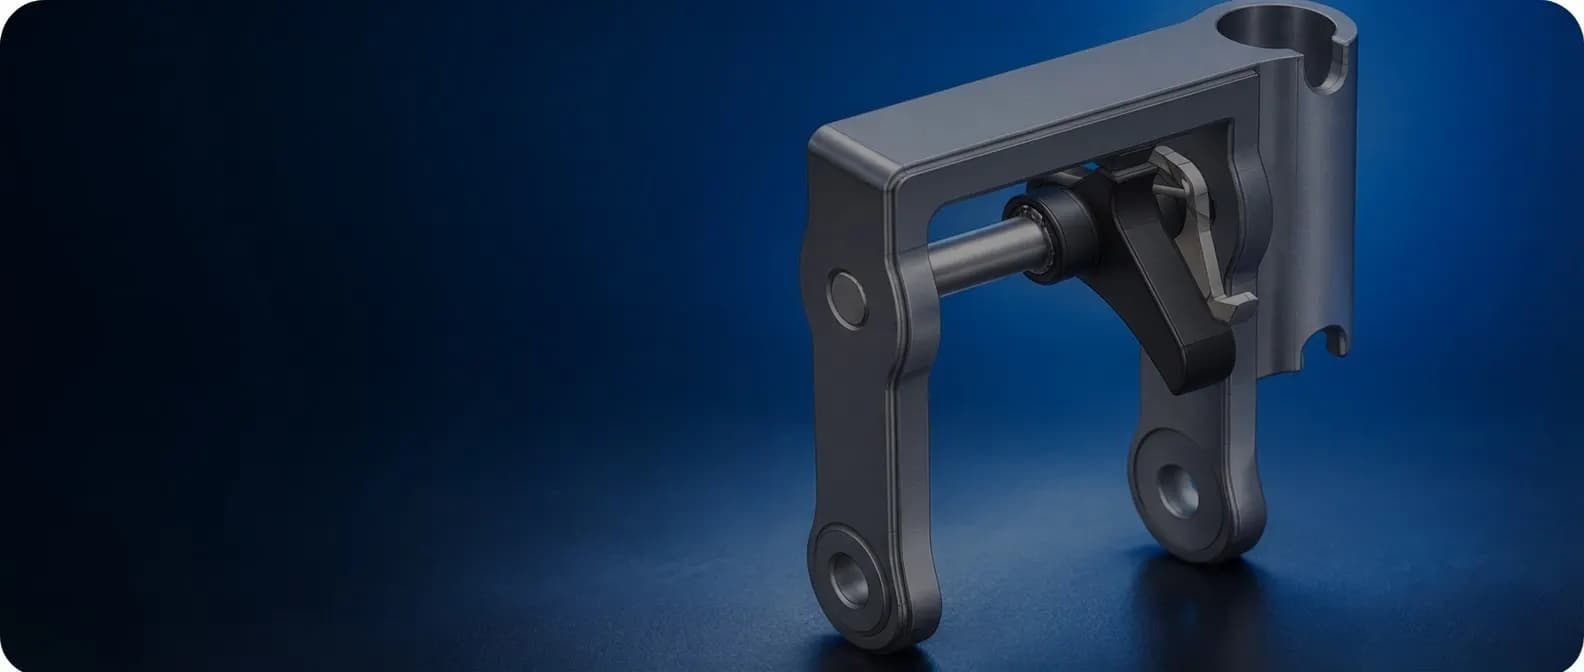
4K U-FRAME
Understanding the load path
Product Design & Development
Tunnel Ventilation and Smoke Control
- Requirement
Understand the frame response
Evaluate deformation and critical stress locations in the 4K strap-hoist U-frame. Investigate the load path associated with an 8,000 lbf study requirement
- Challenge
Represent the working mechanism
Translate handle action, pawl engagement and shaft support into an FE model. The contact and restraint choices needed to reproduce the expected twisting response
- Deliverables
Component results and a clear load basis
Compare modelling approaches, calculate the handle load, check reactions and report deformation and component stresses. Extend the investigation to an existing 3K design
- Target for the studied load path
- 8,000 lbf
- Frame, loading pawl and shaft
- 3 Components
- Reverse and direct loading
- 2 Approaches
Development Programme
The engineering process

Step 01: Understand
Review CAD, materials and how the hoist transfers load

Step 02: Represent
Compare load paths, contact assumptions and supports

Step 03: Calibrate
Calculate handle force and check the pawl reaction

Step 04: Evaluate
Review deformation and stresses in each component
Step 05: Compare
Review test feedback and run the separate 3K model
Understanding the Product
How the handle loads the U-frame
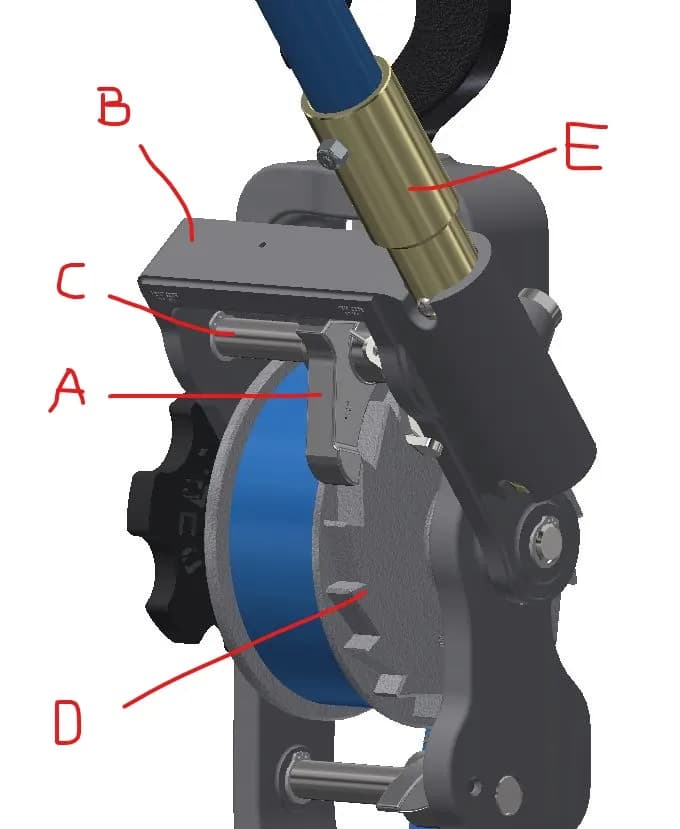
The handle rotates the U-frame. The loading pawl engages the drum and transfers torque into the strap
As the strap winds onto the drum, tension rises. The frame, pawl and shaft carry different parts of this load path. Their interactions determine how the casting bends and twists
A Loading pawl B U-frame C Pawl shaft D Drum E Handle
Original client assembly markup. The loading pawl and holding pawl perform different roles in the hoist cycle
CAD and Material Inputs
A focused model of the working assembly
The numerical history places the result snapshots on the same timeline. Temperature and CO peak at the assumed 25-minute fire cut-off, then decline as the source stops and ventilation continues
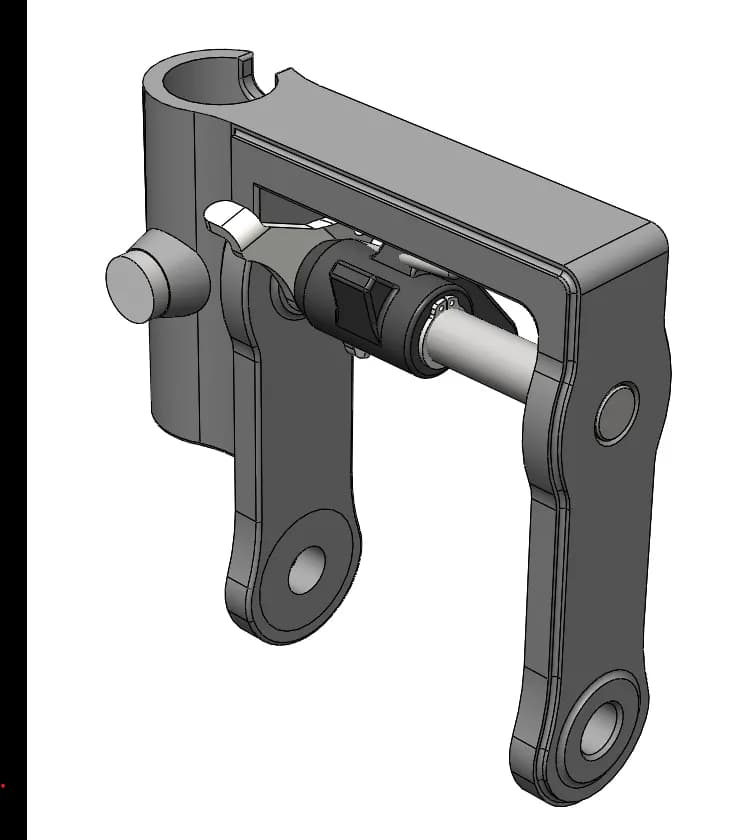
Frame, loading pawl and transverse shaft
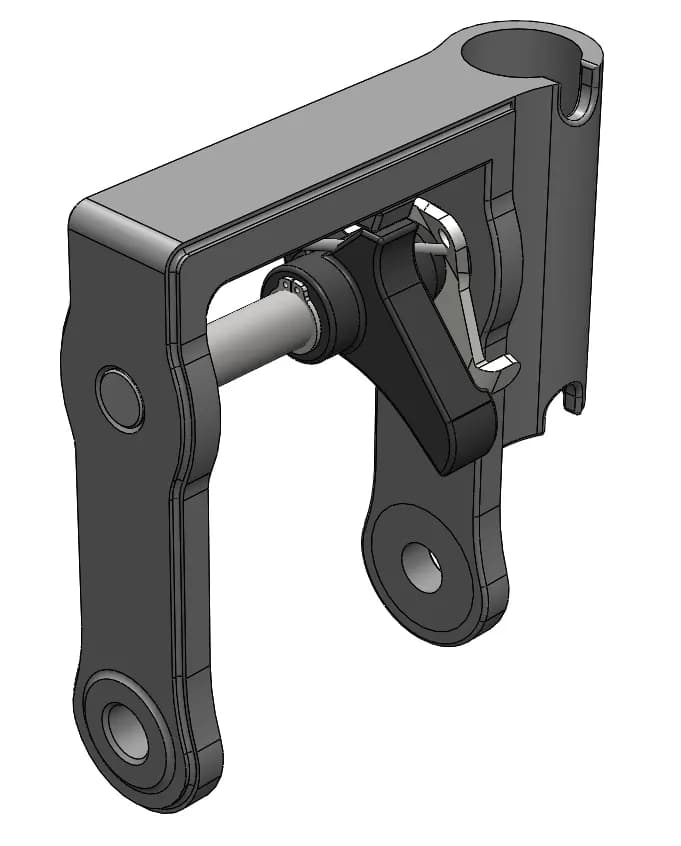
Reverse view of the engagement mechanism
The supplied assembly defines the geometry. The analysis assigns separate material properties to the casting, loading pawl and shaft
| COMPONENT | MATERIAL | ELASTIC MODULUS | UTS REFERENCE |
|---|---|---|---|
| U-frame | Aluminium A356-T6 | 72.4 GPa | 280 MPa |
| Loading pawl | ZA27 | 77.9 GPa | 420 MPa |
| Pawl shaft | 416 stainless steel | 200 GPa | 700 MPa |
UTS is the supplied ultimate tensile strength. These values are reference material inputs, not design allowables.
Load-Path Investigation
Two ways to represent the same mechanism
The numerical history places the result snapshots on the same timeline. Temperature and CO peak at the assumed 25-minute fire cut-off, then decline as the source stops and ventilation continues
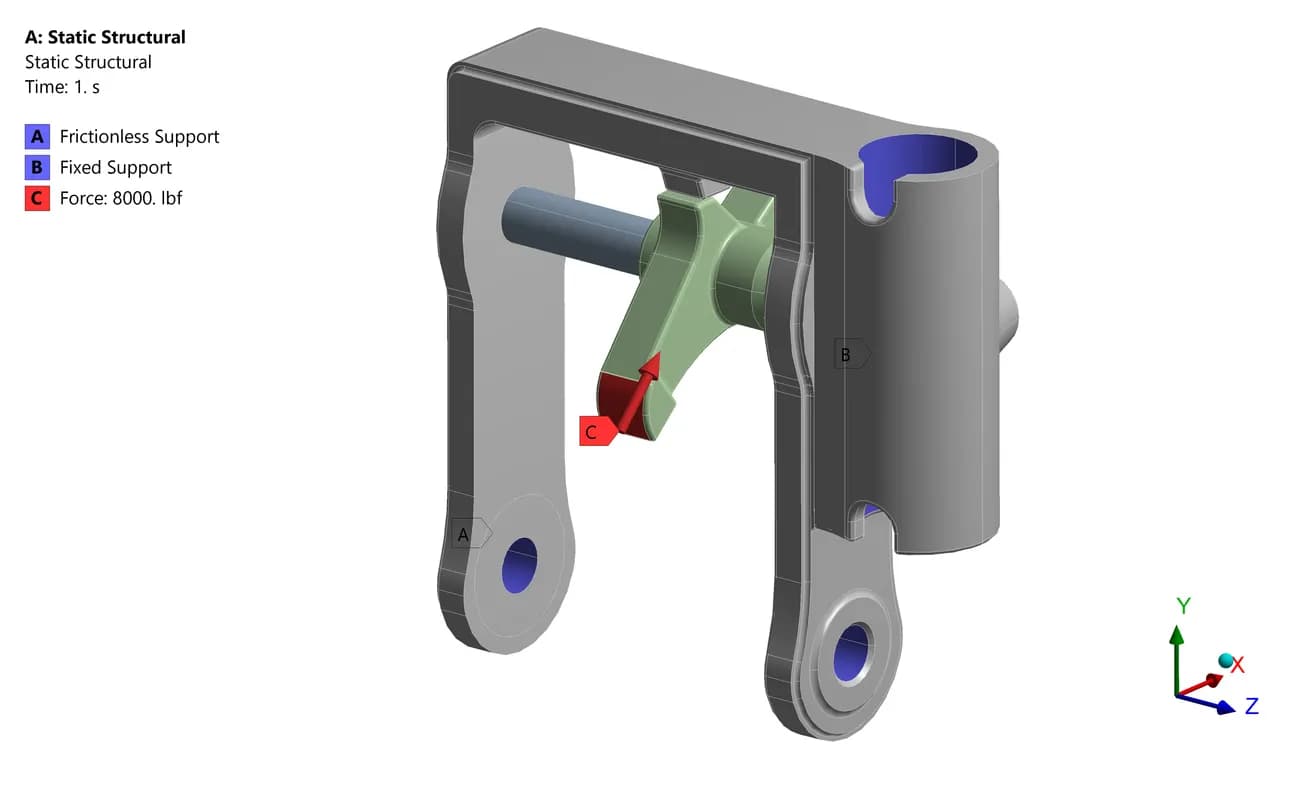
01 / Load applied at the pawl
The reverse approach applied force at the leading pawl edge while restraining the lever housing. The reported response was dominated by bending
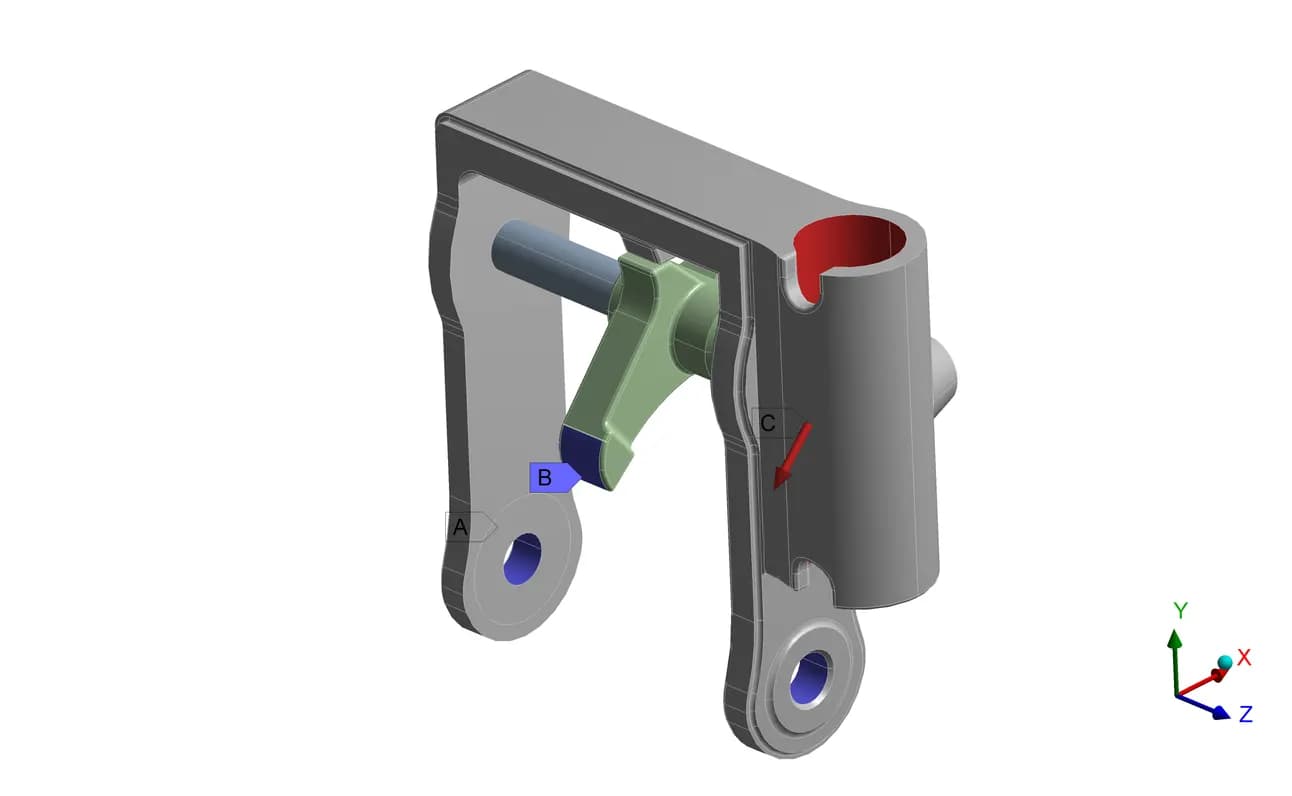
02 / Load applied at the handle
The direct approach loaded the lever housing at the cranking angle. It produced the twisting behaviour that the client expected from the casting
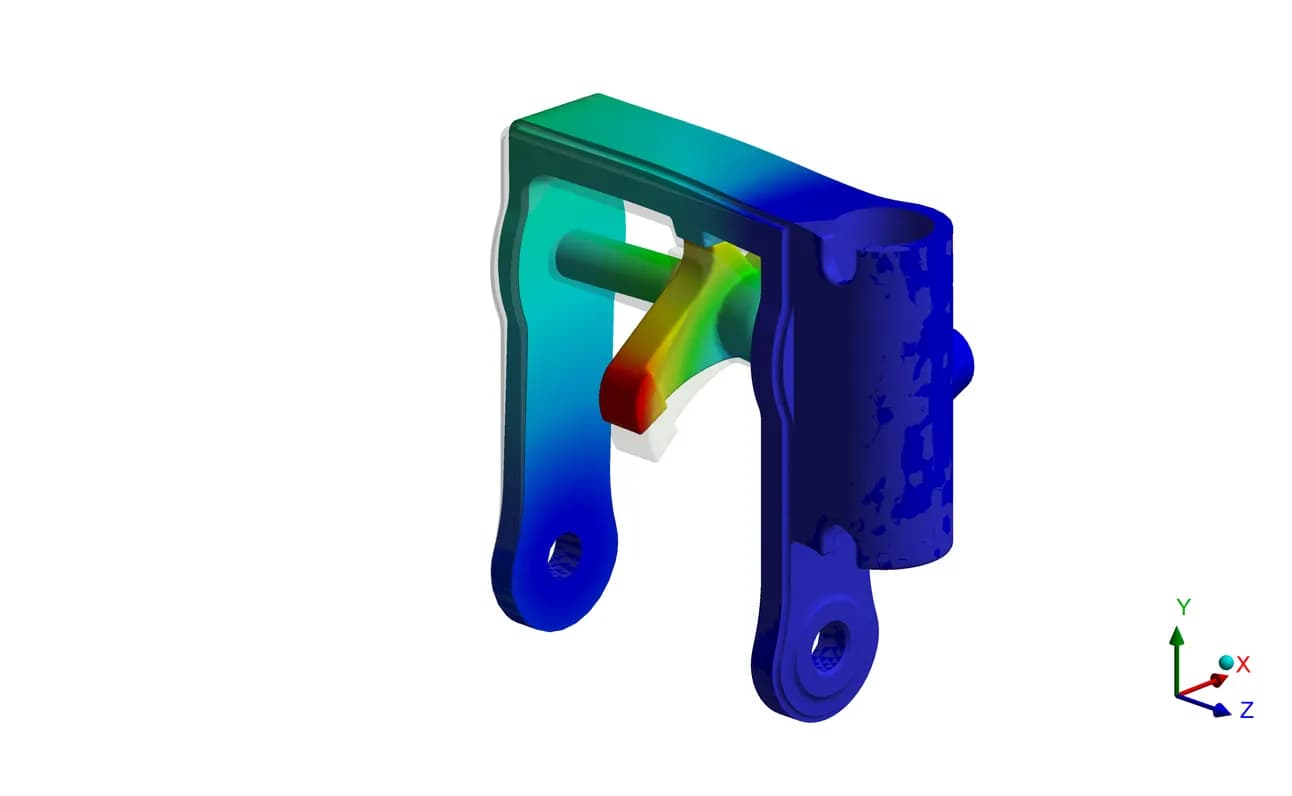
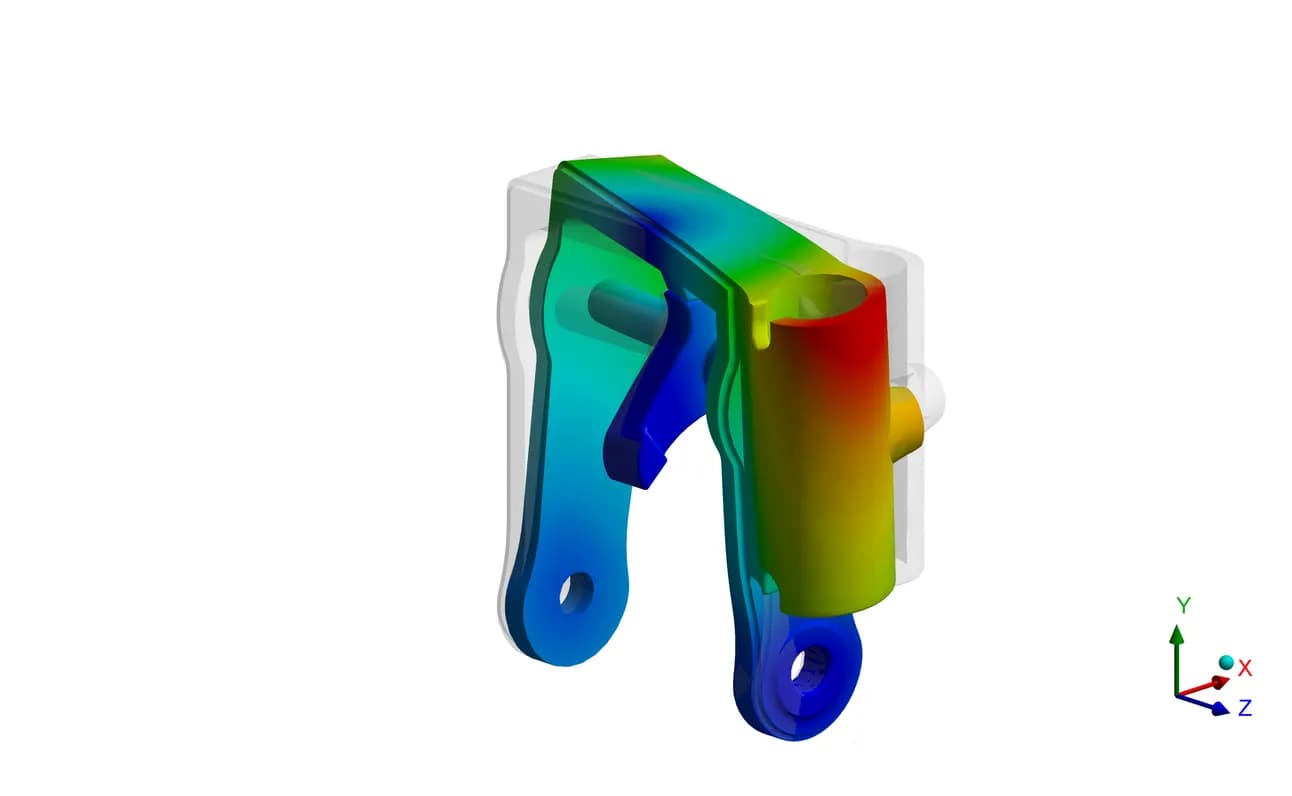
Original approach-study plots, May 2023. These illustrate the choice of load path. The calibrated cases and reported values follow below.
Boundary Conditions
Retain the movement that matters
The numerical history places the result snapshots on the same timeline. Temperature and CO peak at the assumed 25-minute fire cut-off, then decline as the source stops and ventilation continues
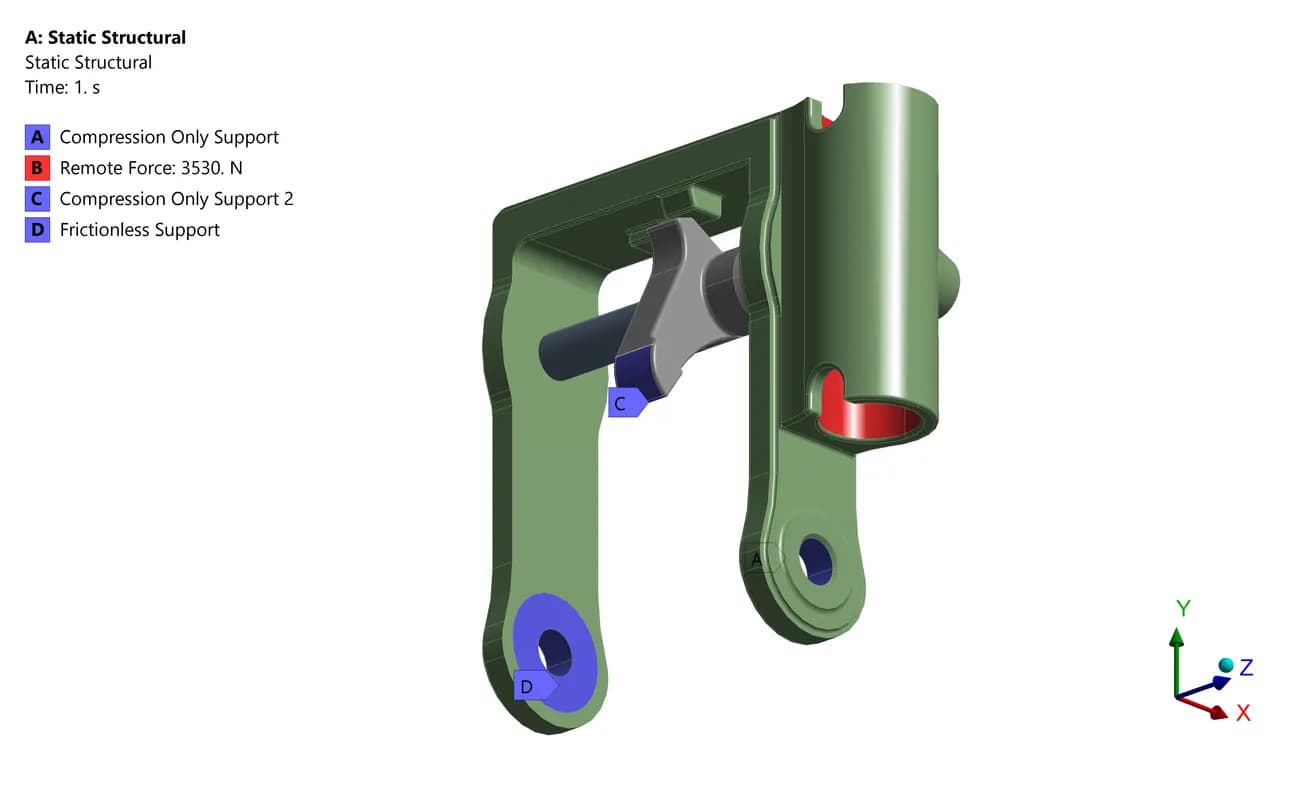
Compression-only and frictionless supports
The final setup uses two compression-only supports and a frictionless support. These represent directional restraint while allowing the relevant separation or tangential motion
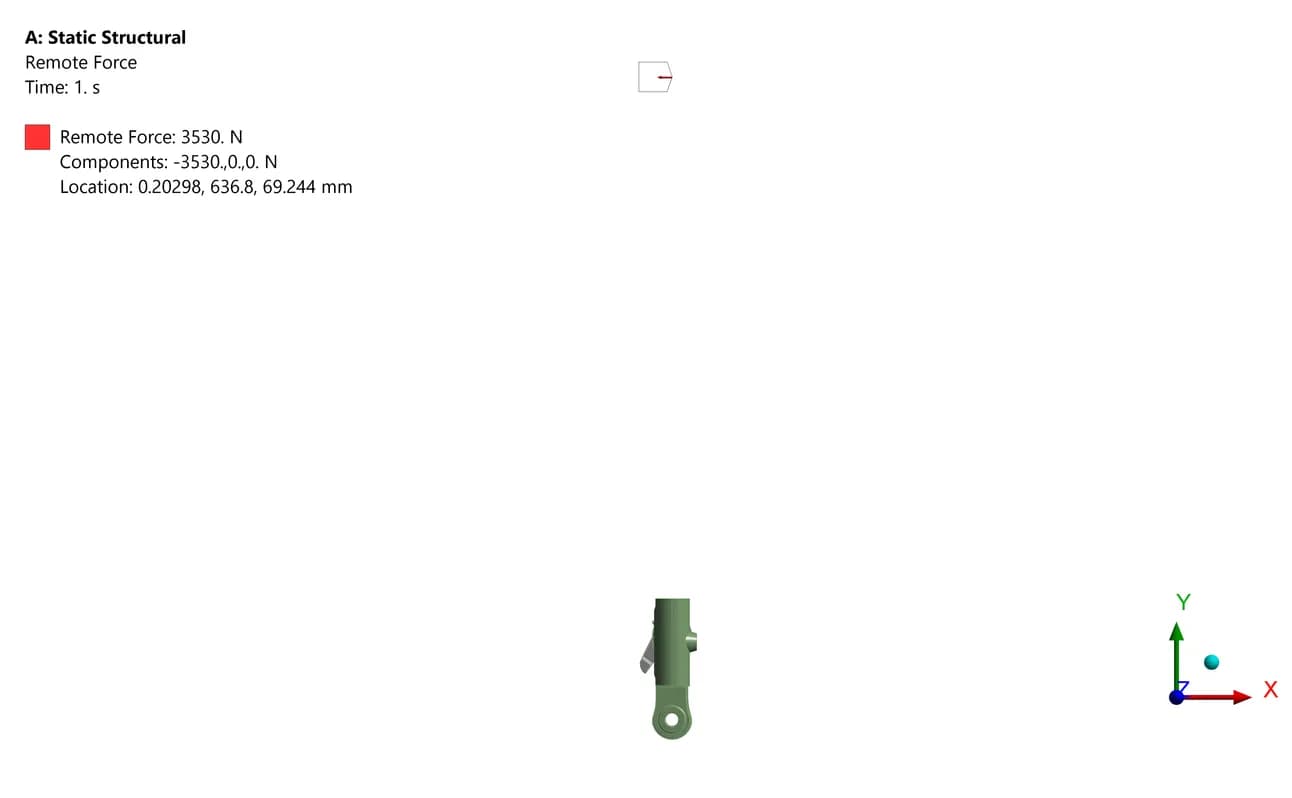
The lever is represented by a remote load
The remote force acts at the handle location. Client clarification also informed the contact assumptions, including the absence of pawl-to-frame contact during loading.
Load Calculation
Translate strap tension into handle force
The supplied assembly defines the geometry. The analysis assigns separate material properties to the casting, loading pawl and shaft
| INPUT / CALCULATION | VALUE | ROLE IN THE LOAD MODEL |
|---|---|---|
| Strap tension | 8,000 lbf / 35,584 N | Specified load basis |
| Rolled-up strap diameter | 115 mm | Effective radius: 57.5 mm |
| Effective cranking length | 620 mm | 120 + 550 − 50 mm |
| Moment from strap tension | 2.04608 kN·m | 35,584 N × 57.5 mm |
| Calculated handle force | 3,300.13 N | Moment ÷ effective cranking length |
| Initial simulation input | 3,300 N | Case 01-A |
Why the reaction force needed a second check
The support conditions share the reaction. The calculated lever force therefore needed adjustment to reach the required reaction at the pawl
Reaction Check and Load Refinement
Match the intended pawl reaction
| REPORTED QUANTITY | CASE 01-A | Case 01-B |
|---|---|---|
| Applied handle force | 3,300 N | 3,530 N |
| Pawl reaction | 33,229 N / 7,470.18 lbf | 35,601 N / 8,003.4 lbf |
| Maximum deformation | 4.76 mm | 5.1 mm |
| U-frame maximum principal stress | 2,265.3 MPa | 2,422.3 MPa |
| Pawl maximum principal stress | 648.8 MPa | 693 MPa |
| Shaft equivalent stress | 1,173.5 MPa | 1,254.2 MPa |
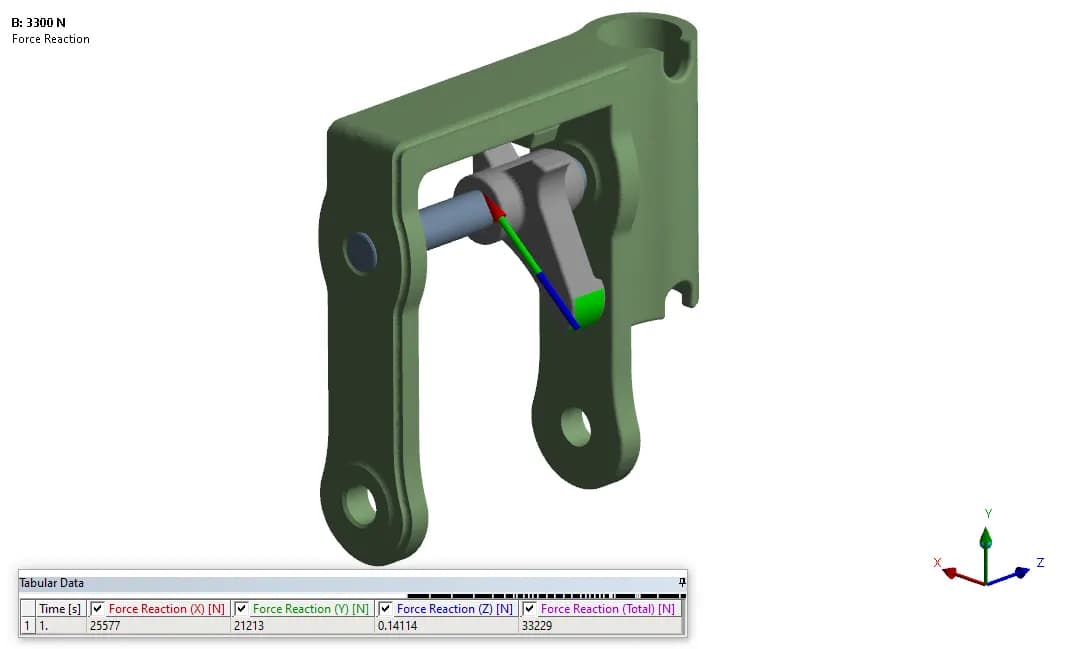
Compression-only and frictionless supports
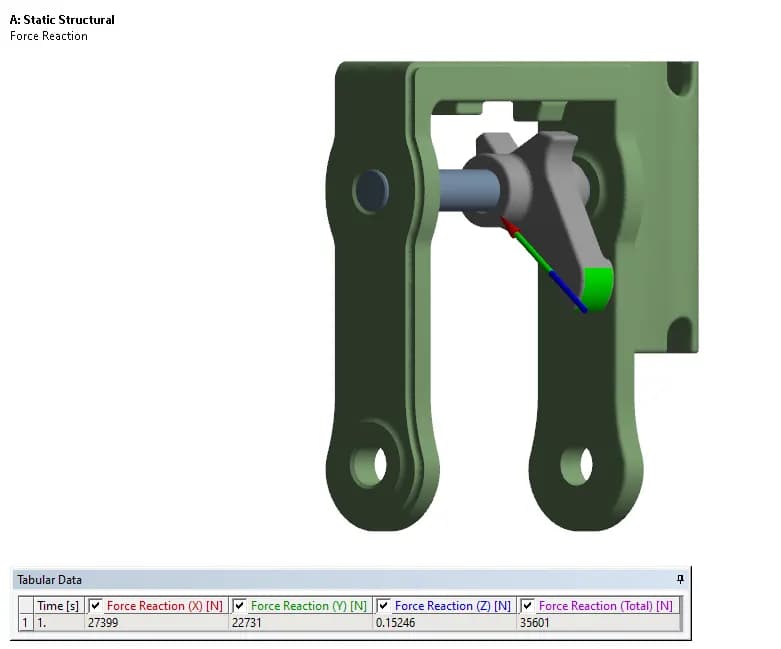
The lever is represented by a remote load
Component Review / U-Frame
Locate the critical regions in the casting
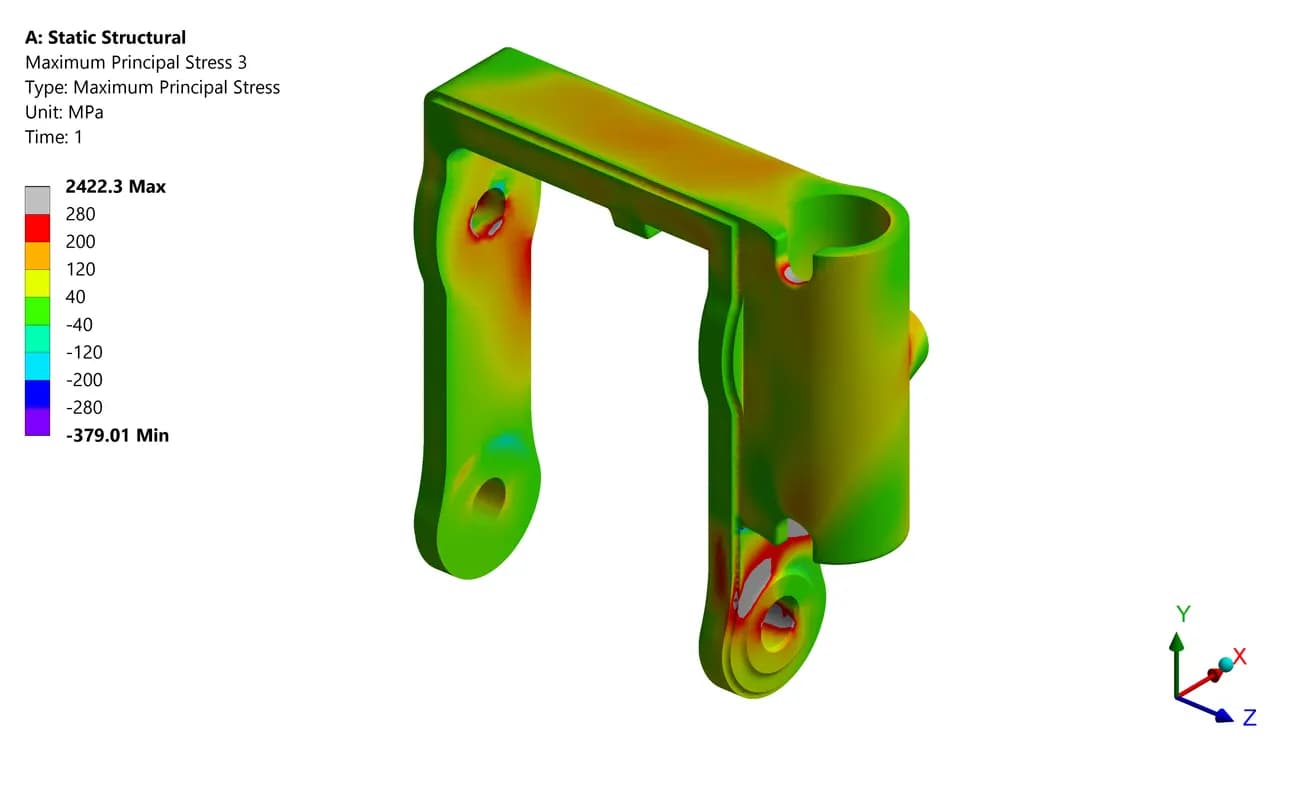
2,422.3 MPa reported tensile peak
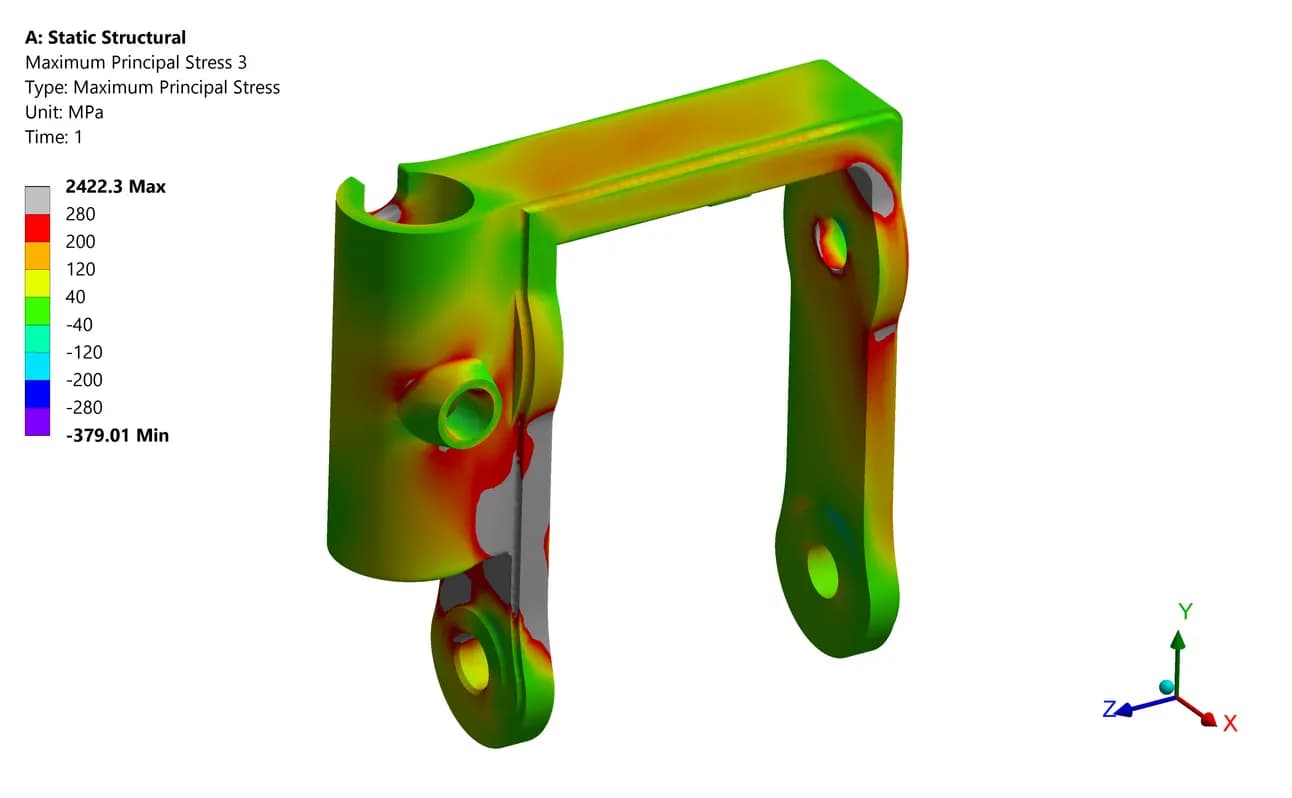
A356-T6 / UTS reference: 280 MPa
Multiple views expose the stress distribution around the casting features and load-transfer regions. The source display uses grey for positive values above its UTS colour limit. Local peaks require interpretation alongside the contact and material assumptions
Component Review / Loading Pawl
Trace stress through the engagement part
CO transport provides a separate measure of the fire products. The reported maximum reaches 1,210 ppm at 25 minutes and falls to 4 ppm at 45 minutes. The main tunnel and connecting routes are retained in the result views
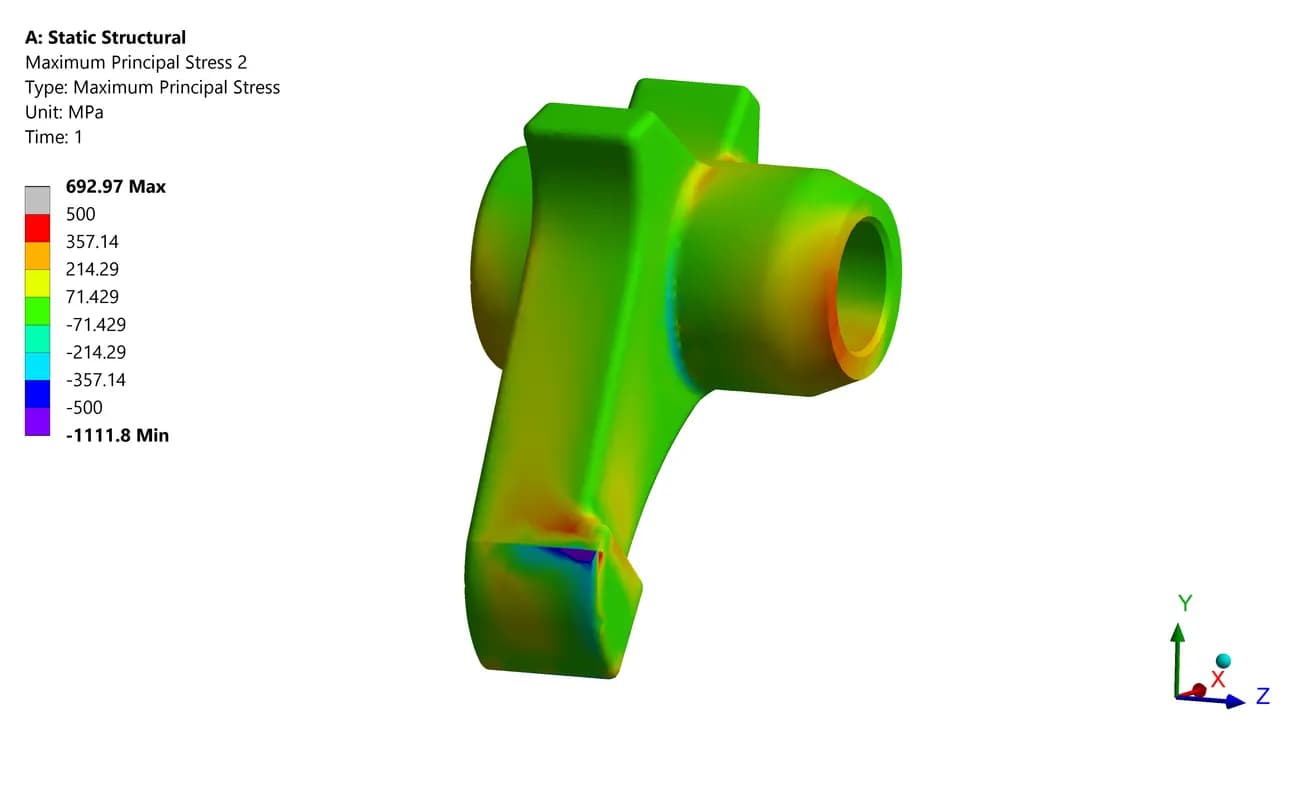
693 MPa reported tensile peak
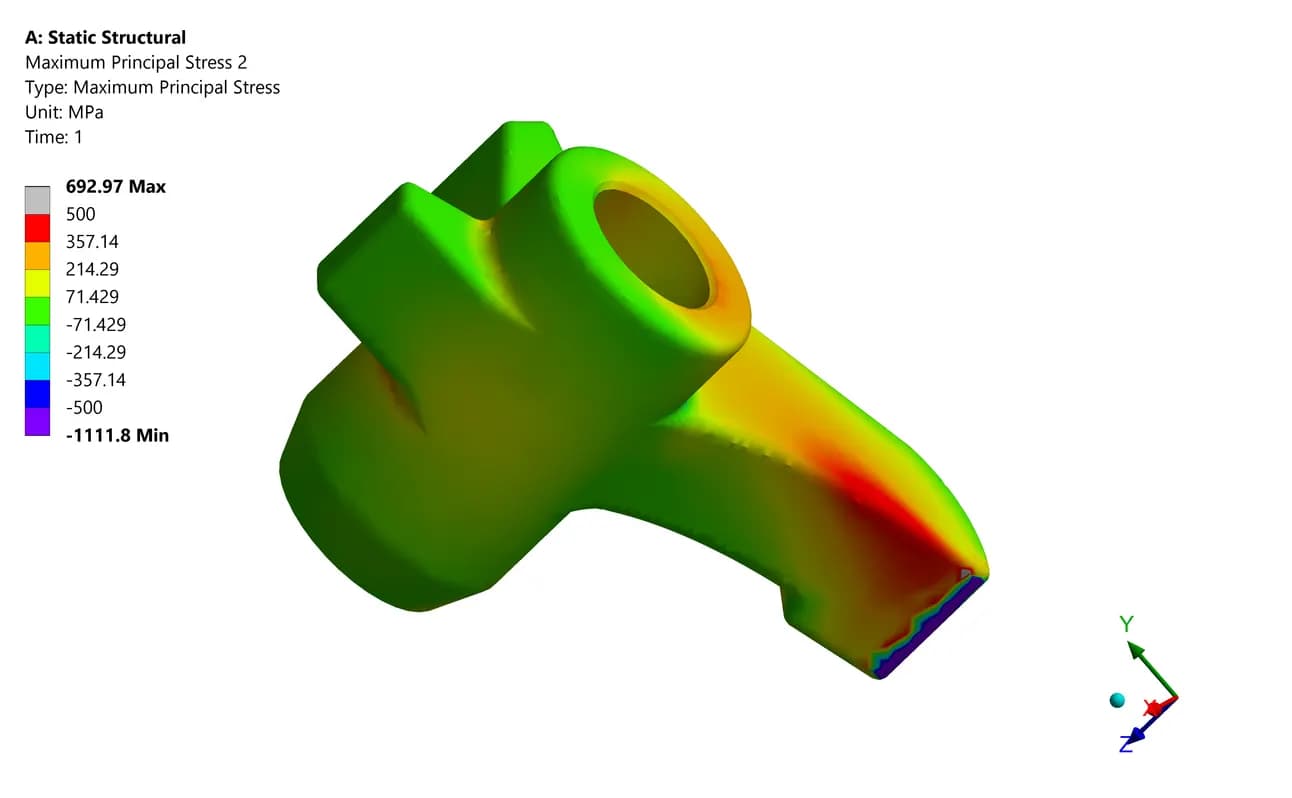
ZA27 loading pawl. The supplied UTS reference is 420 MPa. Opposing views help identify the local stress concentrations around the engagement geometry
Component Review / Pawl Shaft
Review the shaft that transfers the load
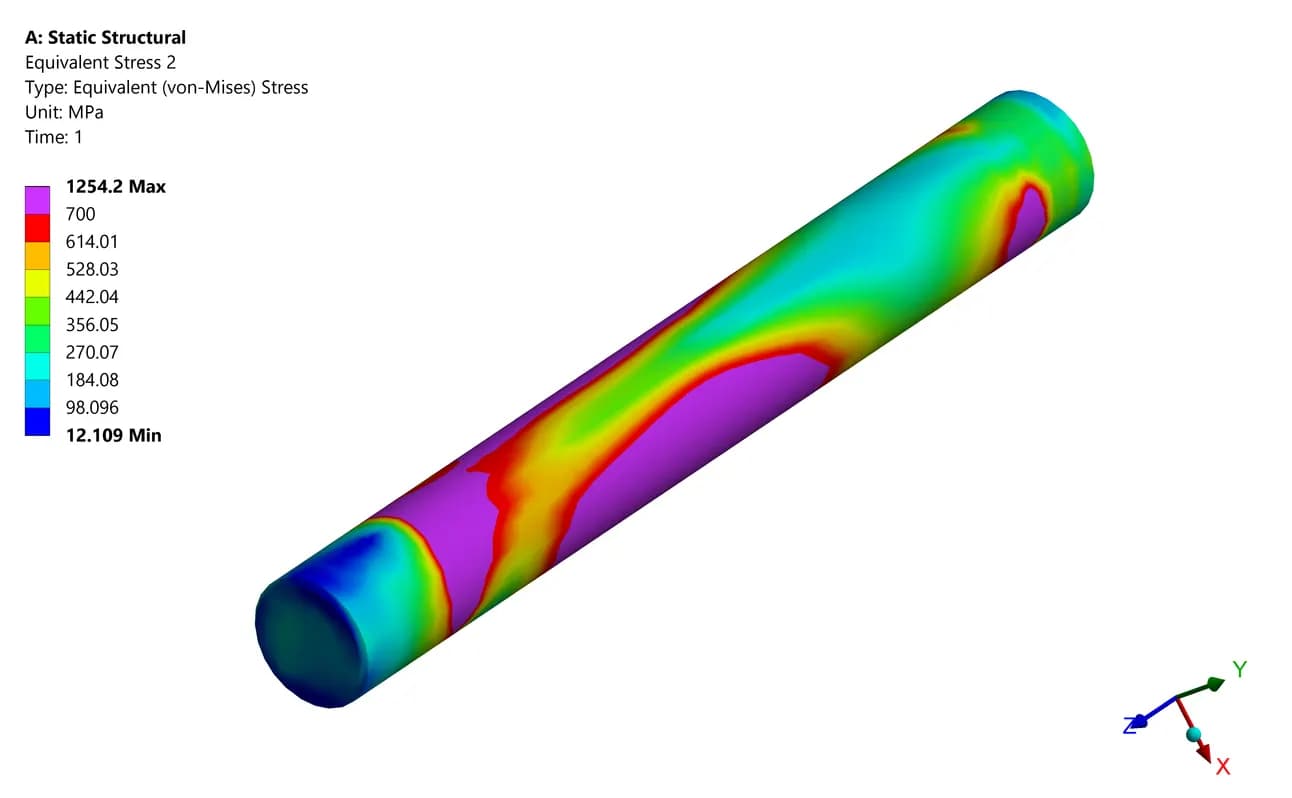
1,254.2 MPa reported equivalent stress peak
The original mesh view shows the tunnel fluid domain used for the assessment
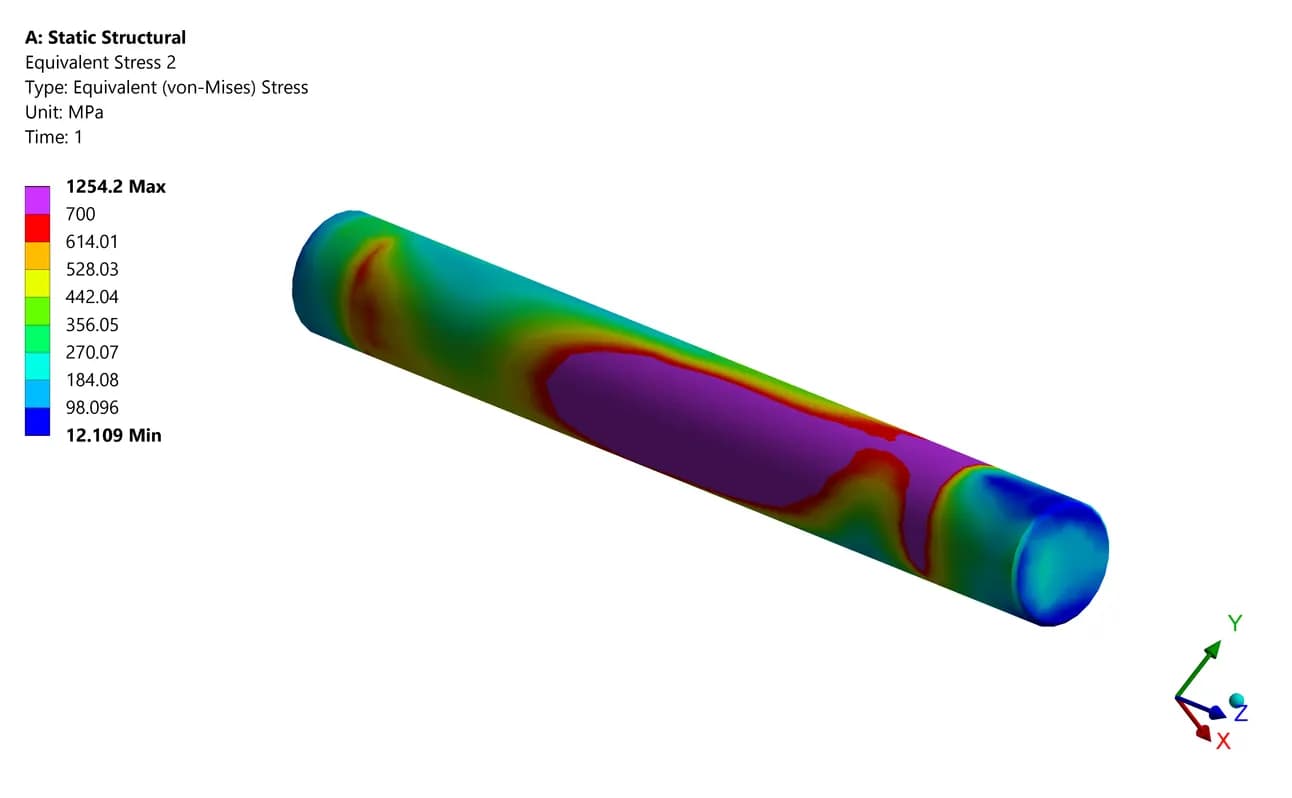
The SS416 shaft is reported using von Mises equivalent stress. The supplied UTS reference is 700 MPa. Its stress measure differs from the maximum principal stress used for the frame and pawl.
What these results establish
The reported peaks exceed the supplied UTS references and identify regions for further assessment. A failure-load prediction would require additional material, contact and nonlinear-response evidence. The study does not establish a certified capacity.
Extending the Investigation
A separate comparison with the existing 3K design
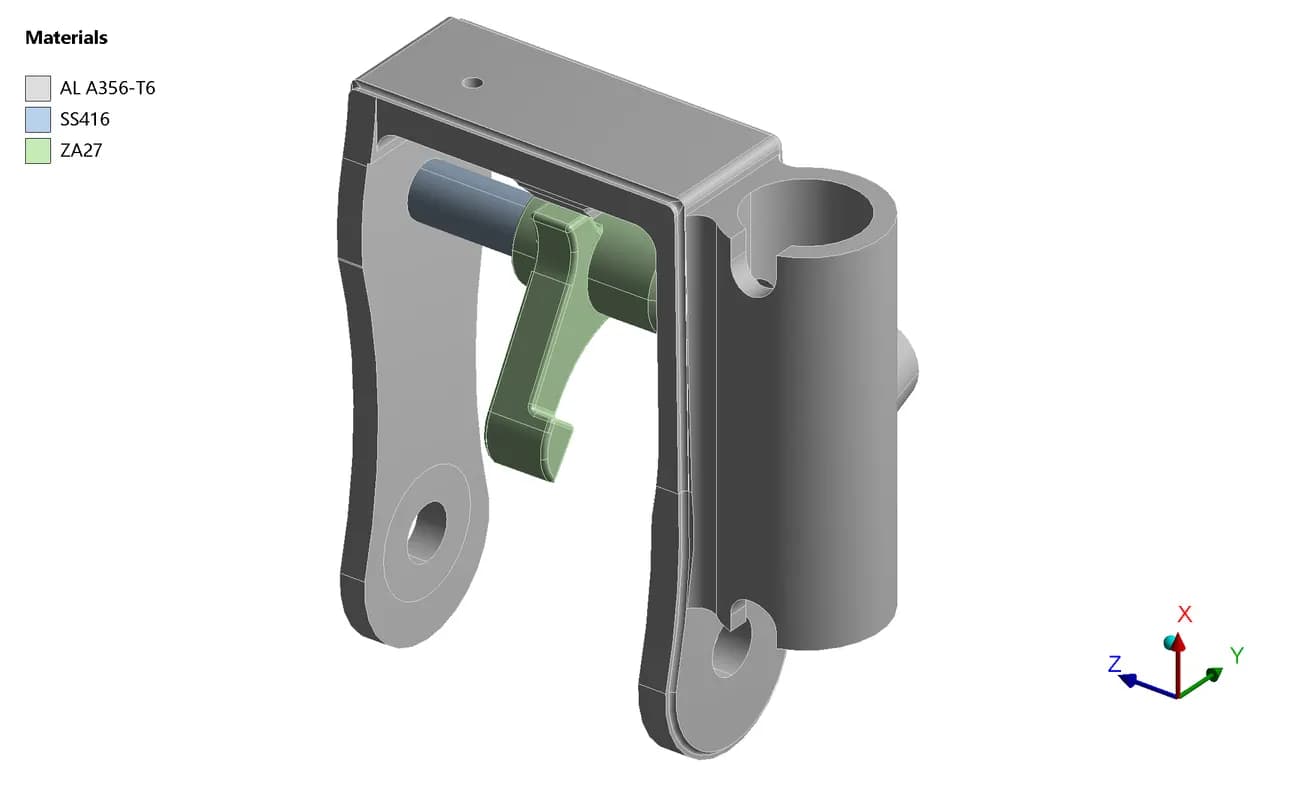
Frame, loading pawl and transverse shaft
Reverse view of the engagement mechanism
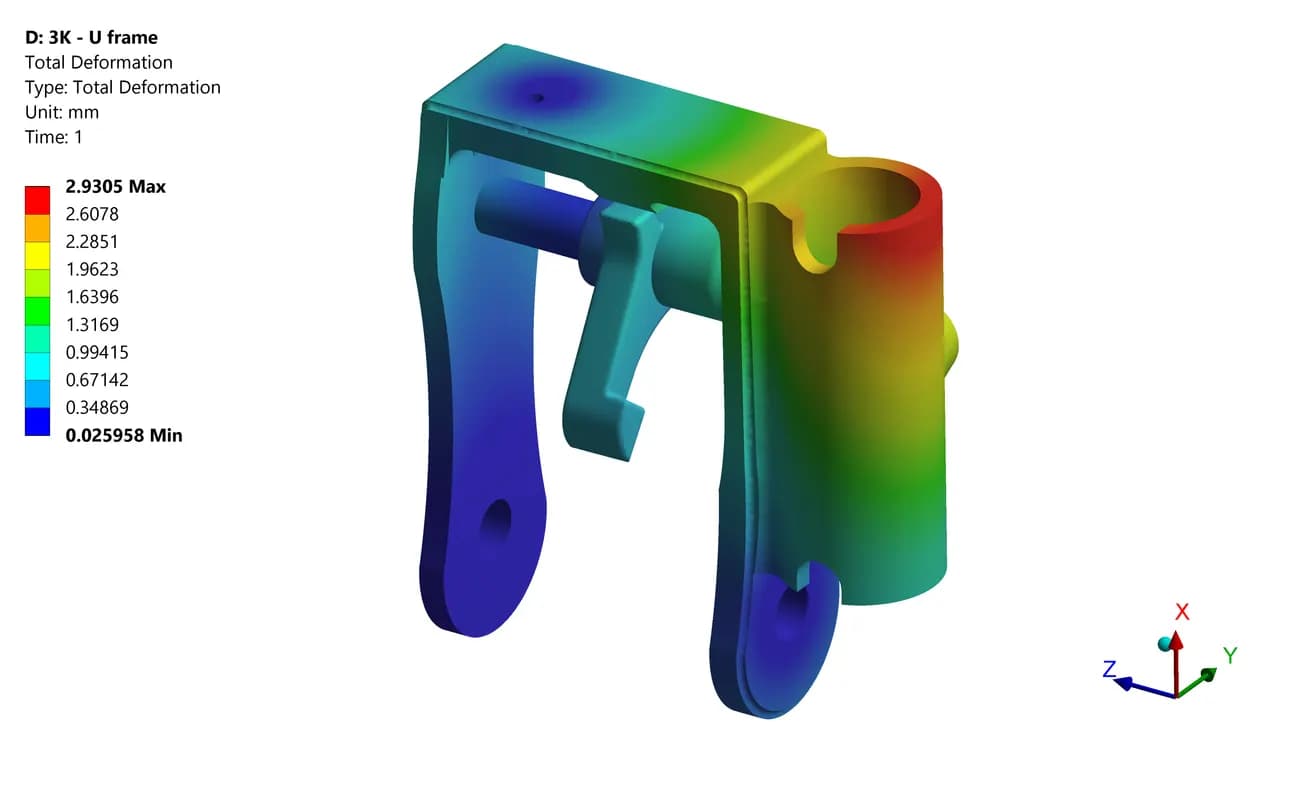
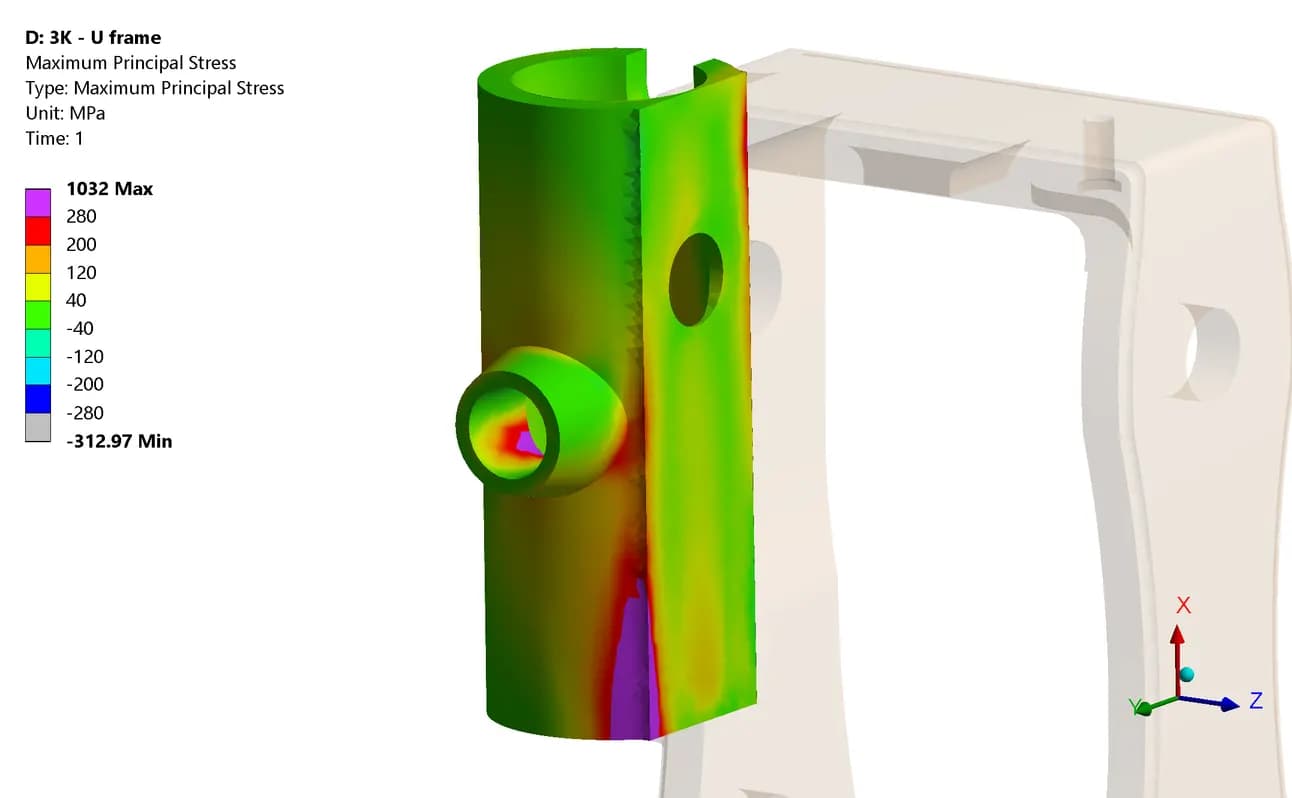
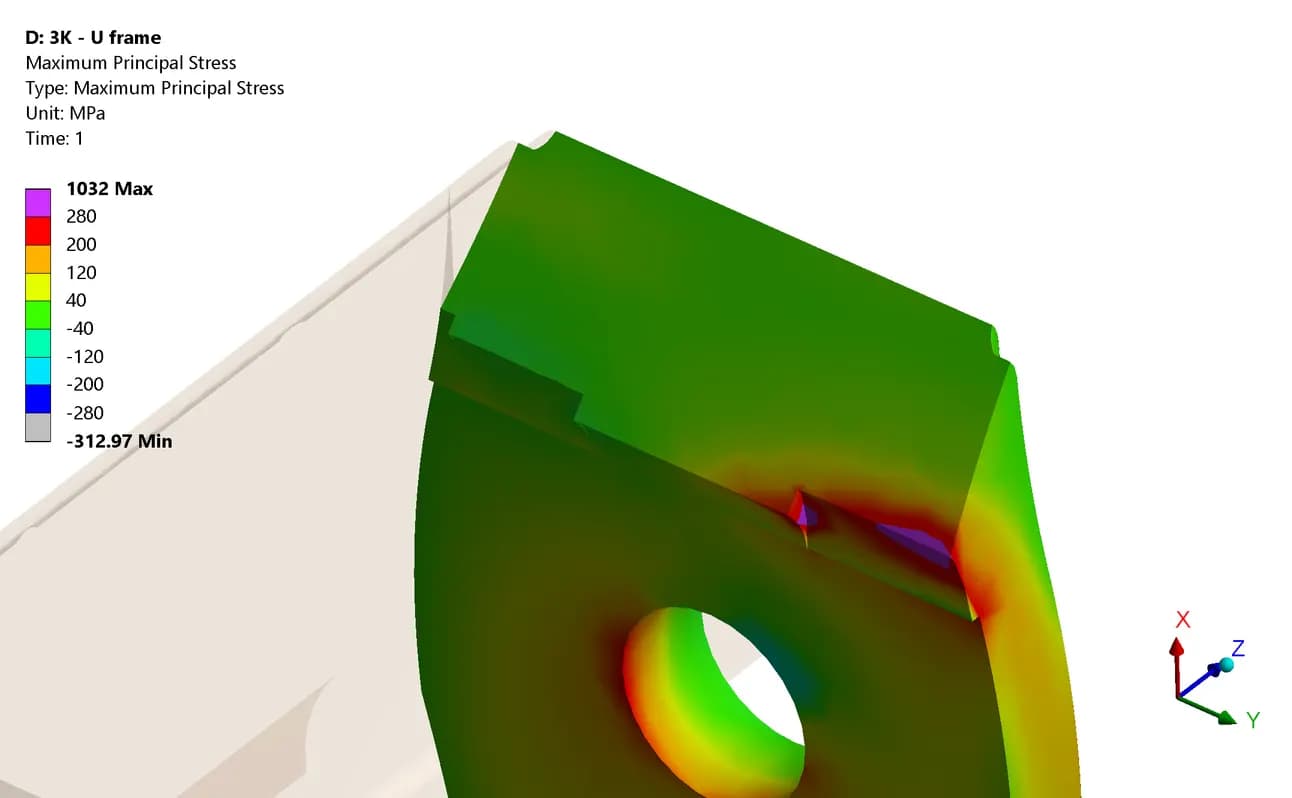
The client supplied the existing 3K model for a further study. Its geometry, lever length and load basis differ from the 4K analysis, so these results are presented as a separate comparison.
| 3K STUDY PARAMETER | REPORTED VALUE | CONTEXT |
|---|---|---|
| Target strap tension | 6,000 lbf | Separate model and load basis |
| Effective lever / strap radius | 372 mm / 50 mm | Moment-based force calculation |
| Applied handle force | 3,587.10 N | Simulation input |
| Observed pawl reaction | 5,239.4 lbf / 23,306 N | Below the 6,000 lbf target |
| Maximum deformation | 2.93 mm | Response of the separate 3K model |
UTS is the supplied ultimate tensile strength. These values are reference material inputs, not design allowables.
Project Outcome
A clearer picture of the load path and response
CLIENT FEEDBACK / MAY 2023
The client reported that the deformation animations resembled behaviour seen in physical testing. This provided a qualitative check on the simulated response.
Model definition
CAD-based component model, material inputs and documented support assumptions
Load and reaction checks
Comparison of approaches, moment calculation and reaction-based adjustment of the handle force
Results and comparison
Assembly deformation, frame/pawl/shaft stress plots, animations and a separate 3K study
From assumed loading to an explained response
The investigation established a traceable load basis, showed how the U-frame twists and located critical stress regions in the frame, pawl and shaft. The results gave the client a focused basis for further design and test review