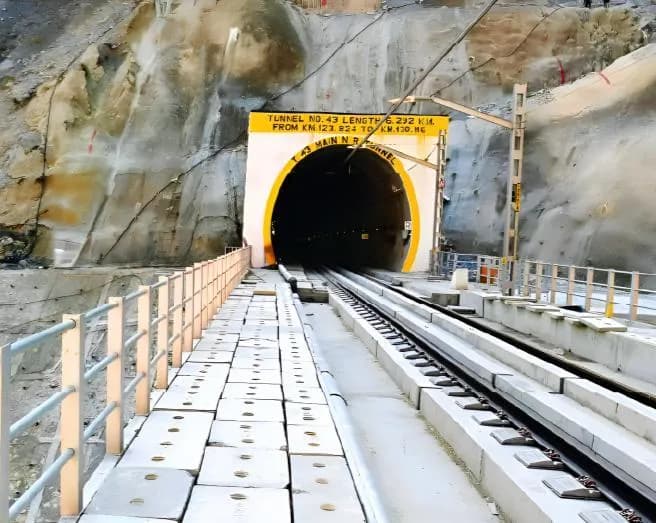
Tunnel T14
Sawalkote–Sangaldan Jammu & Kashmir
Product Design & Development
Tunnel Ventilation and Smoke Control
- Requirement
Assess two operating modes
Evaluate pollutant removal during normal operation and smoke, heat and visibility during the defined fire scenario
- Challenge
Follow changing flow paths
Resolve a long tunnel network, fan-driven flow, cross-passage ventilation and the transient response to a growing fire
- Deliverables
An engineering review package
Geometry and mesh views, operating inputs, airflow and pollutant contours, timed smoke sequences and reported recovery trends
01 / Tunnel Architecture
A main tunnel connected to an escape route
Tunnel T14 is part of the Udhampur–Srinagar–Baramulla Rail Link. The model represents the main tunnel, a parallel escape tunnel and their cross passages. Jet fans drive longitudinal ventilation, while dedicated fans serve the connecting and escape routes
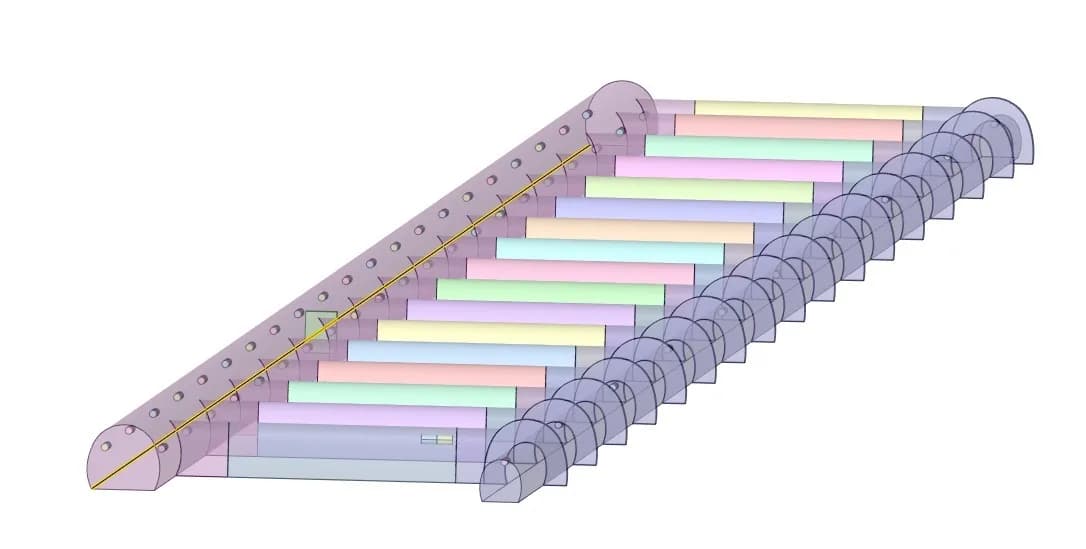
The connected tunnel system
The geometry retains the main flow passages, cross-passage connections and ventilation elements that influence air exchange
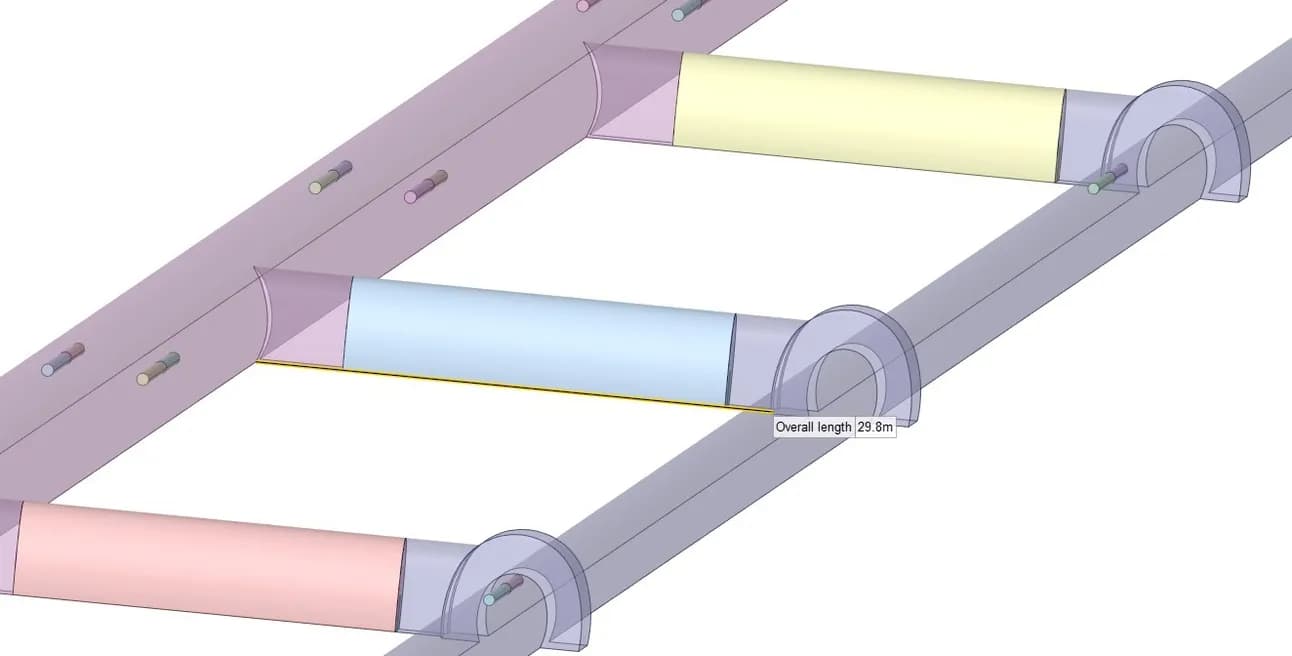
Cross-passage connections
The report identifies a 29.8 m cross-passage length. The connecting passage includes an emergency door and a ventilation arrangement
- Reported tunnel length
- ~6.28 km
- Main-tunnel cross-section
- 39.123 m²
- Escape-tunnel cross-section
- 18.303 m²
02 / Model Development
Geometry, mesh and the ventilation load path
The study simplifies minor structural features while retaining the passages and fan regions that govern ventilation. The report describes an unstructured mesh with refinement around the fans and source regions to resolve local flow gradients
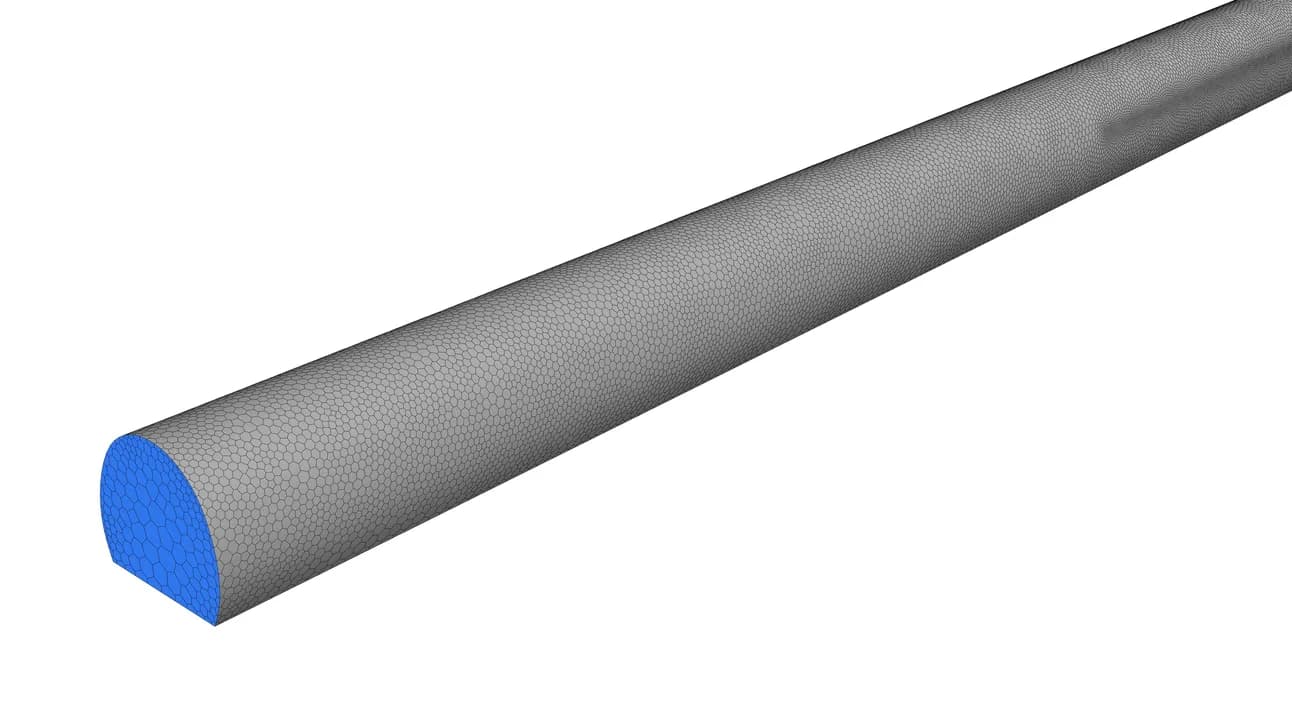
Tunnel discretisation
The original mesh view shows the tunnel fluid domain used for the assessment
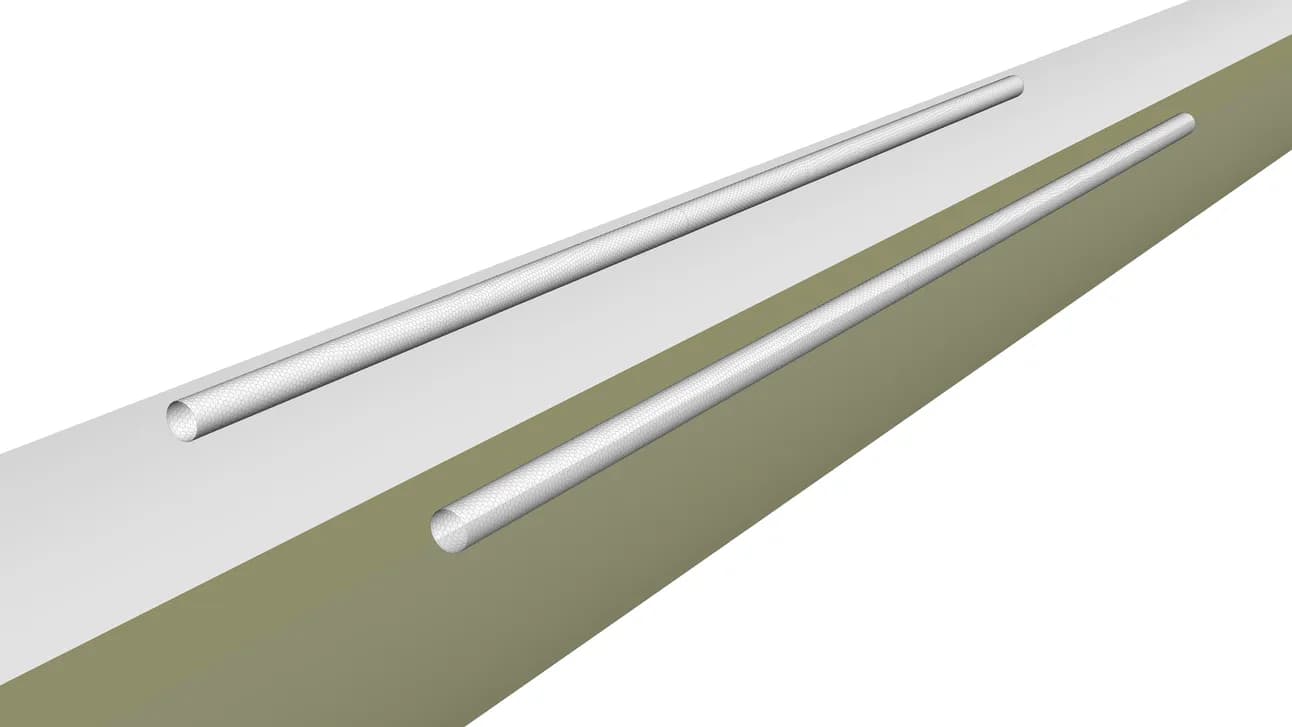
Jet-fan representation
Fan positions are retained in the geometry so that the local jet flow connects with the longitudinal tunnel airflow.
Normal operation uses a steady-state airflow and pollutant-transport assessment. Emergency operation uses a transient model with time-dependent fan activation, heat release and smoke transport. This separates routine ventilation performance from the evolving fire response
03 / Normal Operating Conditions
A defined airflow and diesel-emission basis
| INPUT | REPORTED NORMAL-MODE BASIS |
|---|---|
| Tunnel inlet | 2 m/s air at 13.5 °C |
| Jet-fan flow | 12.3 m³/s per fan; all fans operating |
| Outlet and walls | Atmospheric pressure outlet; no-slip, adiabatic walls |
| Emission sources | CO 1,725 g/h; NO 3,278 g/h; PM 342 g/h |
| Cross passages / escape tunnel | Isolated from the main tunnel in normal mode |
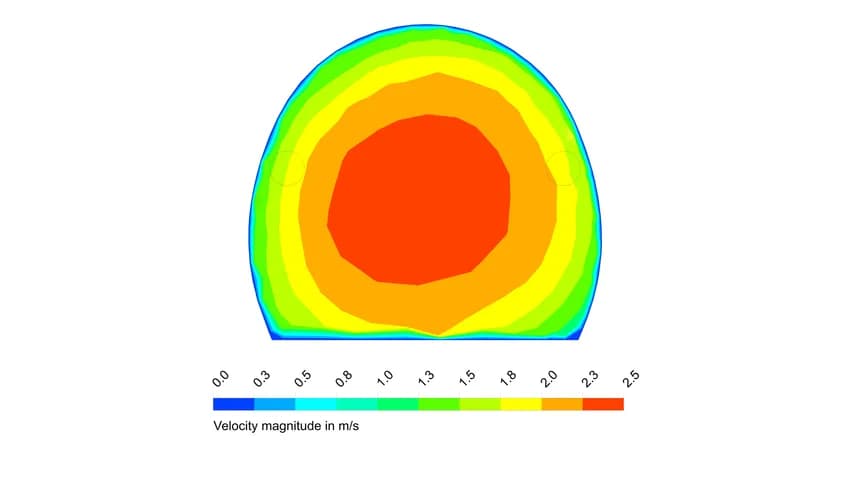
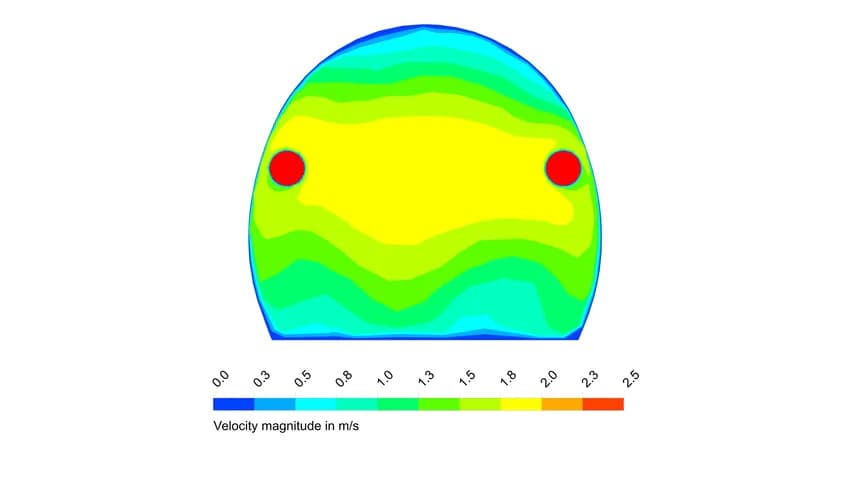
The normal-mode model follows how fresh air and jet-fan flow transport the specified diesel emissions downstream. Results are examined at inlet, middle and outlet sections, together with a plane 1.5 m above the floor
04 / Airflow Results
Reviewing the longitudinal flow and local sections
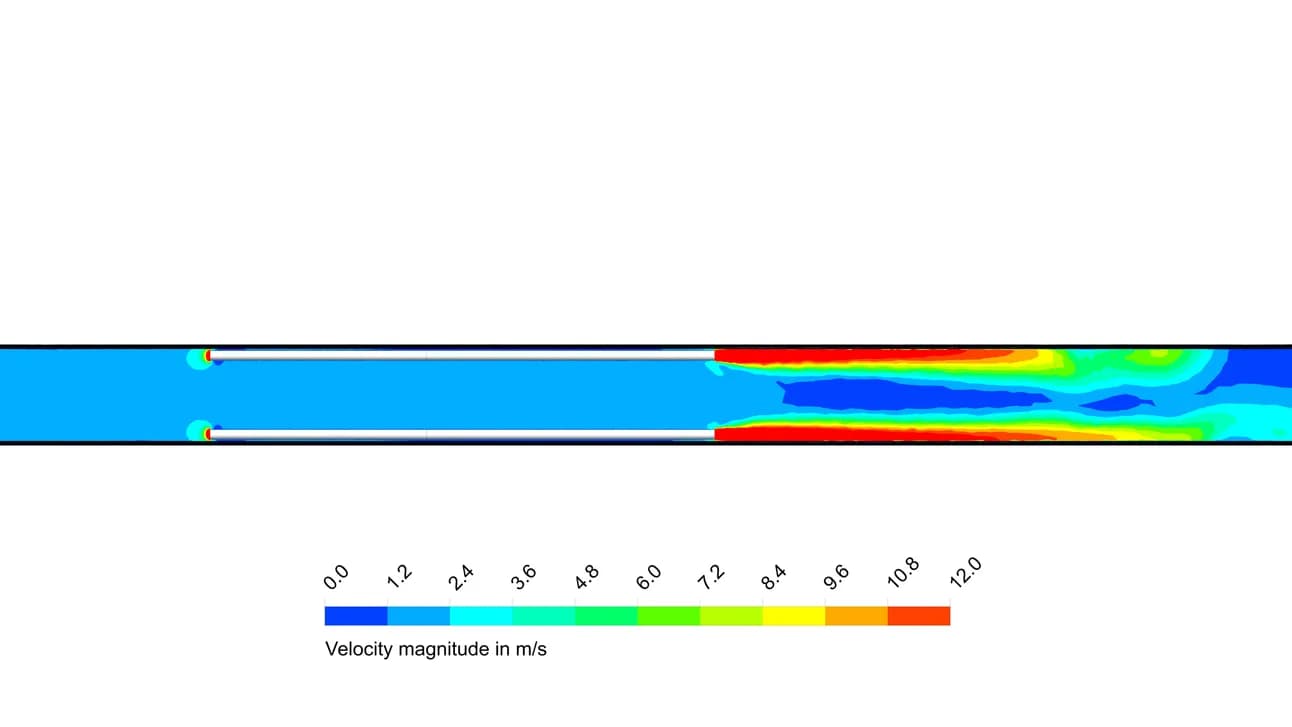
Flow beside the jet fans
The longitudinal velocity contour resolves the local jet region and the downstream redistribution of air
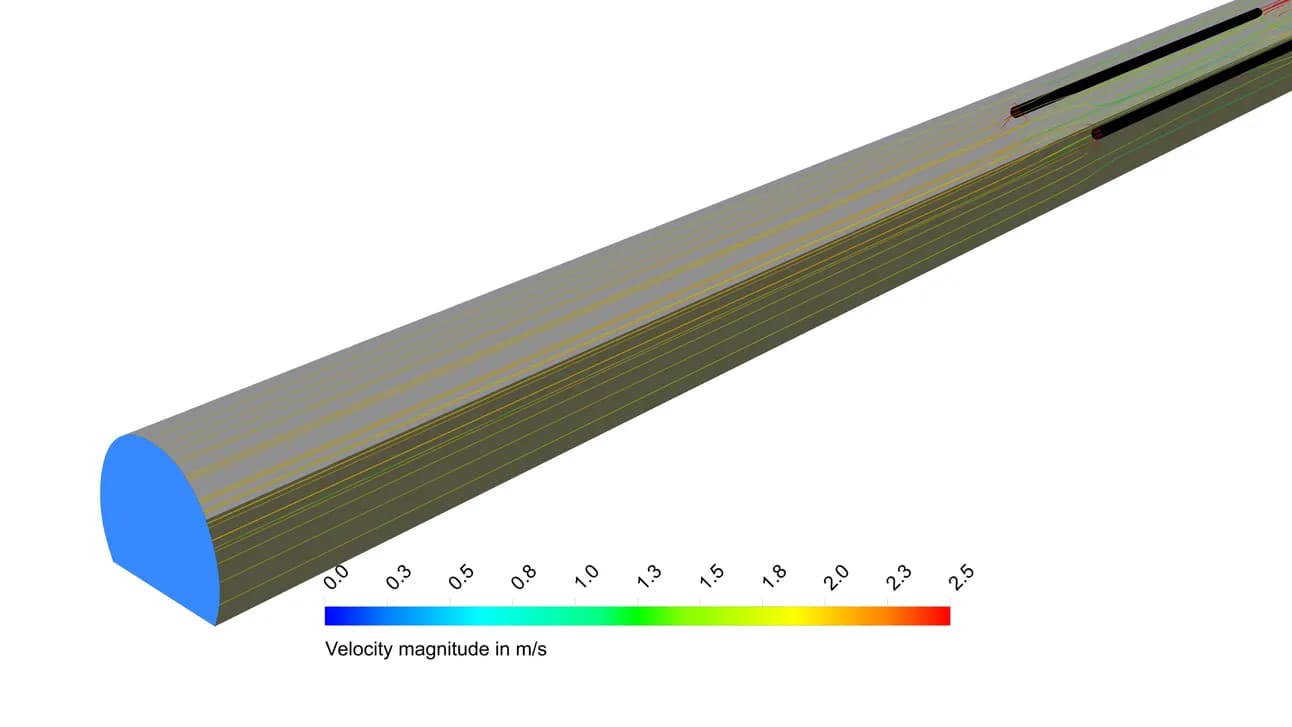
Flow through the tunnel
The original flow-path view relates local fan action to the ventilation along the tunnel
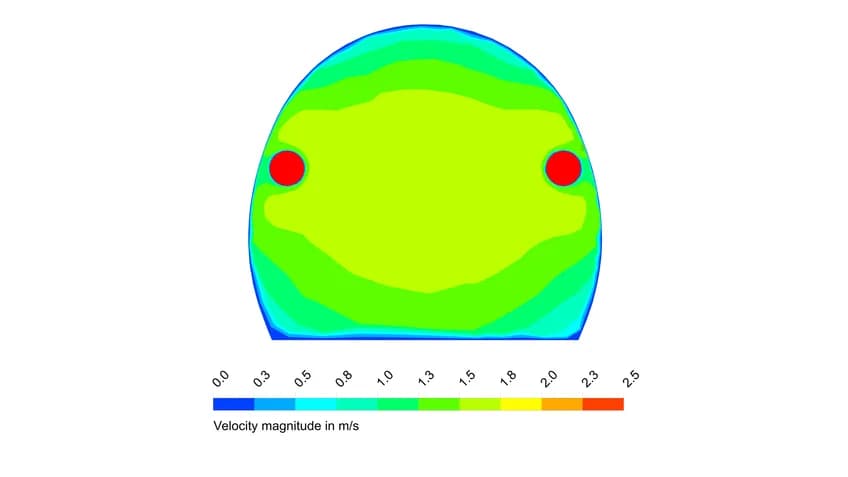
Inlet section
A cross-section captures the velocity distribution near the tunnel entrance.
Middle section
The middle section checks how the flow develops along the tunnel.
Outlet section
The outlet section completes the spatial review of the ventilation flow
05 / Normal-Mode Pollutants
Tracing CO, NO and particulate transport
The normal-mode assessment follows the specified emissions through the main tunnel. The 1.5 m evaluation plane provides a consistent height for reporting concentration distributions and summary values
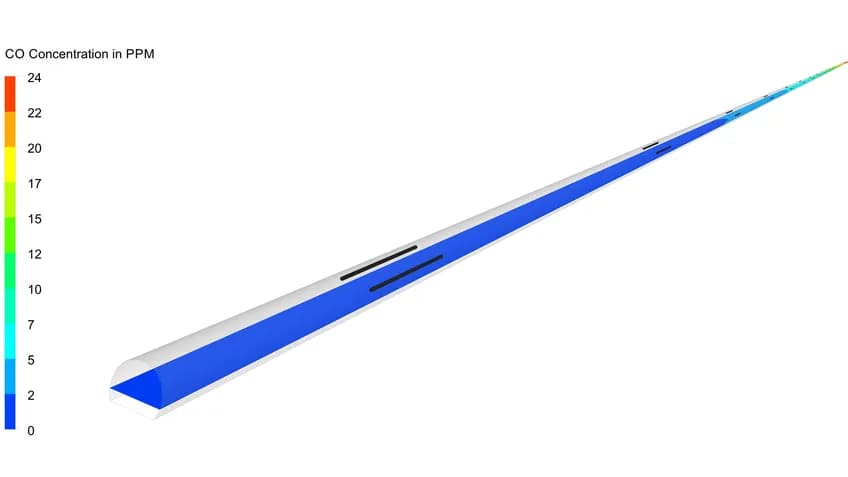
Carbon monoxide
The original field shows how CO concentration varies along the modelled tunnel
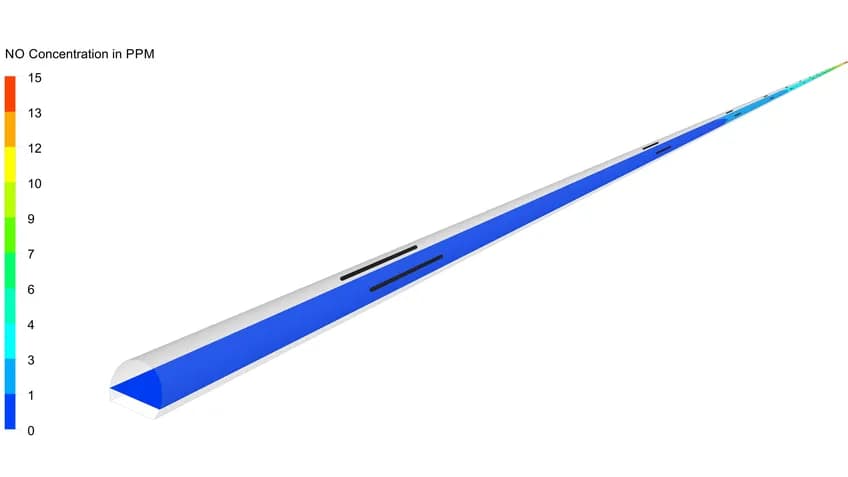
Nitric oxide
A separate transported species records the NO distribution for the same operating case
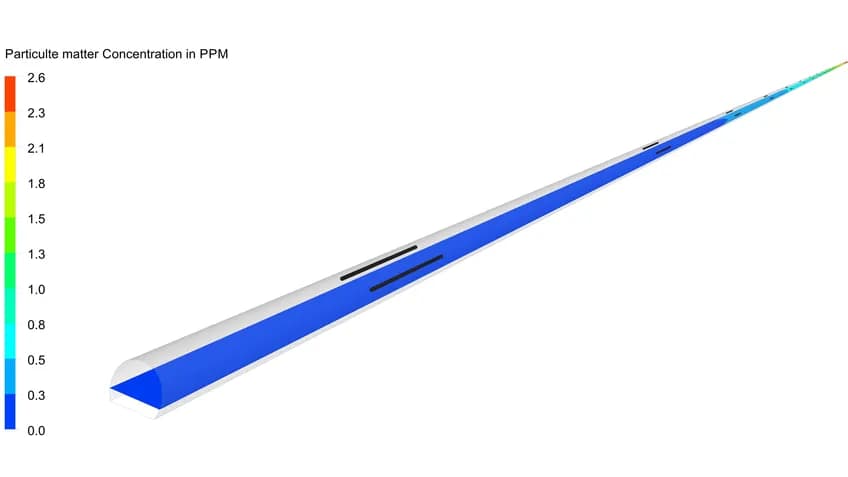
Particulate matter
The particulate field is reported separately from the gaseous species
| AT THE 1.5 m PLANE | MAXIMUM | AVERAGE |
|---|---|---|
| CO / source-reported ppm | 24.38 | 11.20 |
| NO / source-reported ppm | 14.85 | 6.20 |
| PM / source-reported ppm | 2.56 | 1.45 |
Values reproduce the report’s concentration units and summary. They describe the assessed normal-mode condition.
06 / Emergency Scenario
A 40 MW fire with a defined suppression time
The transient study models a 2.5 km region around the fire: 1 km upstream and 1.5 km downstream. The scenario assumes a 40 MW design fire and fire cut-off at 25 minutes, then follows the ventilation response as smoke and heat clear
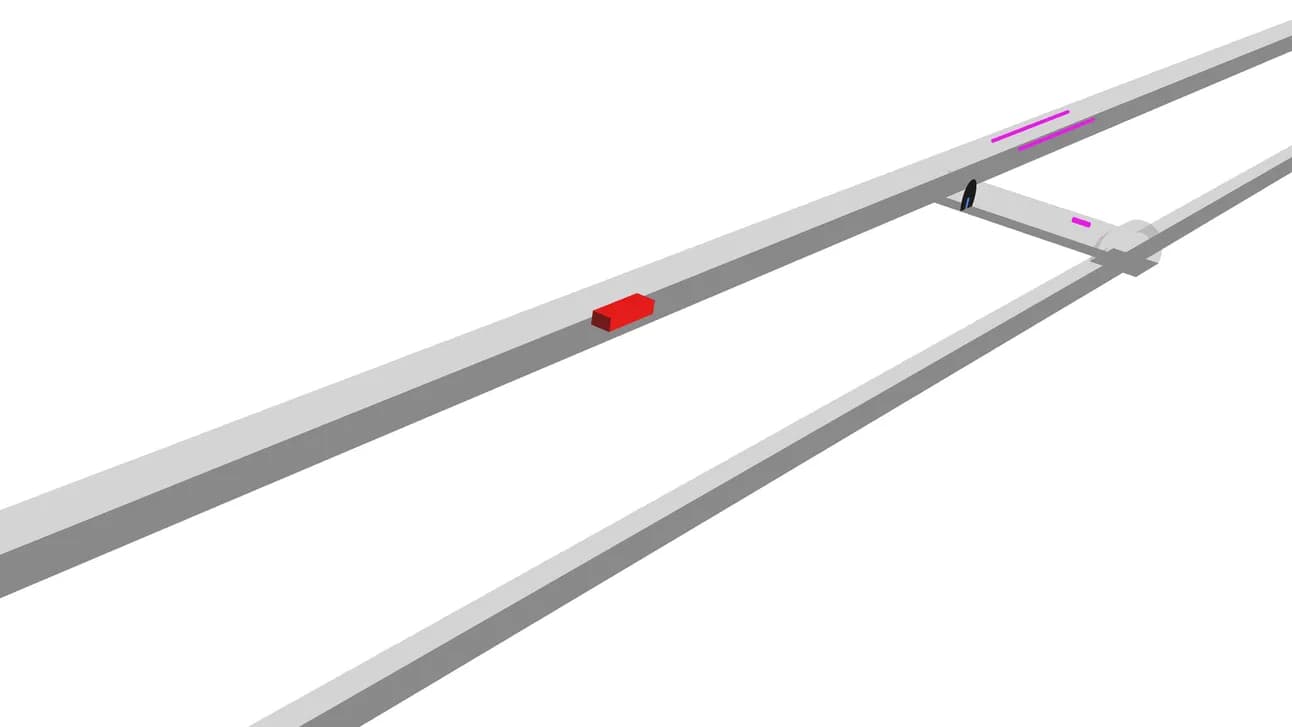
Fire location in the model
The highlighted source sits within the main tunnel. The adjacent escape tunnel and cross passages remain part of the emergency model
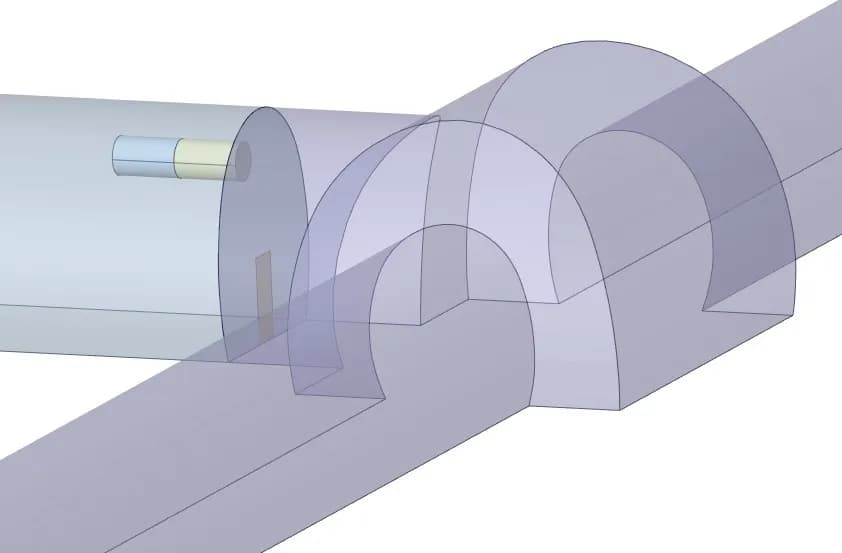
Escape-route ventilation
Escape-tunnel and cross-passage fans activate at 60 seconds in the documented operating sequence
| TIME AFTER INITIATION | MODELLED EVENT |
|---|---|
| 60 seconds | Escape and cross-passage fans start; first jet fan starts |
| 67–123 seconds | Remaining jet fans activate sequentially |
| Near the fire | Selected fans remain off to preserve smoke stratification |
| 25 minutes | Assumed fire cut-off; post-fire clearance continues |
The sequence represents the study assumptions. The supplied smoke-image series continues to 45 minutes.
07 / Smoke Propagation
One timeline, two synchronised views
The isometric view shows smoke movement through the tunnel segment. The front view shows the cross-sectional smoke pattern. The combined animation pairs both views at each recorded time, from 1 to 45 minutes, in an 8-second sequence
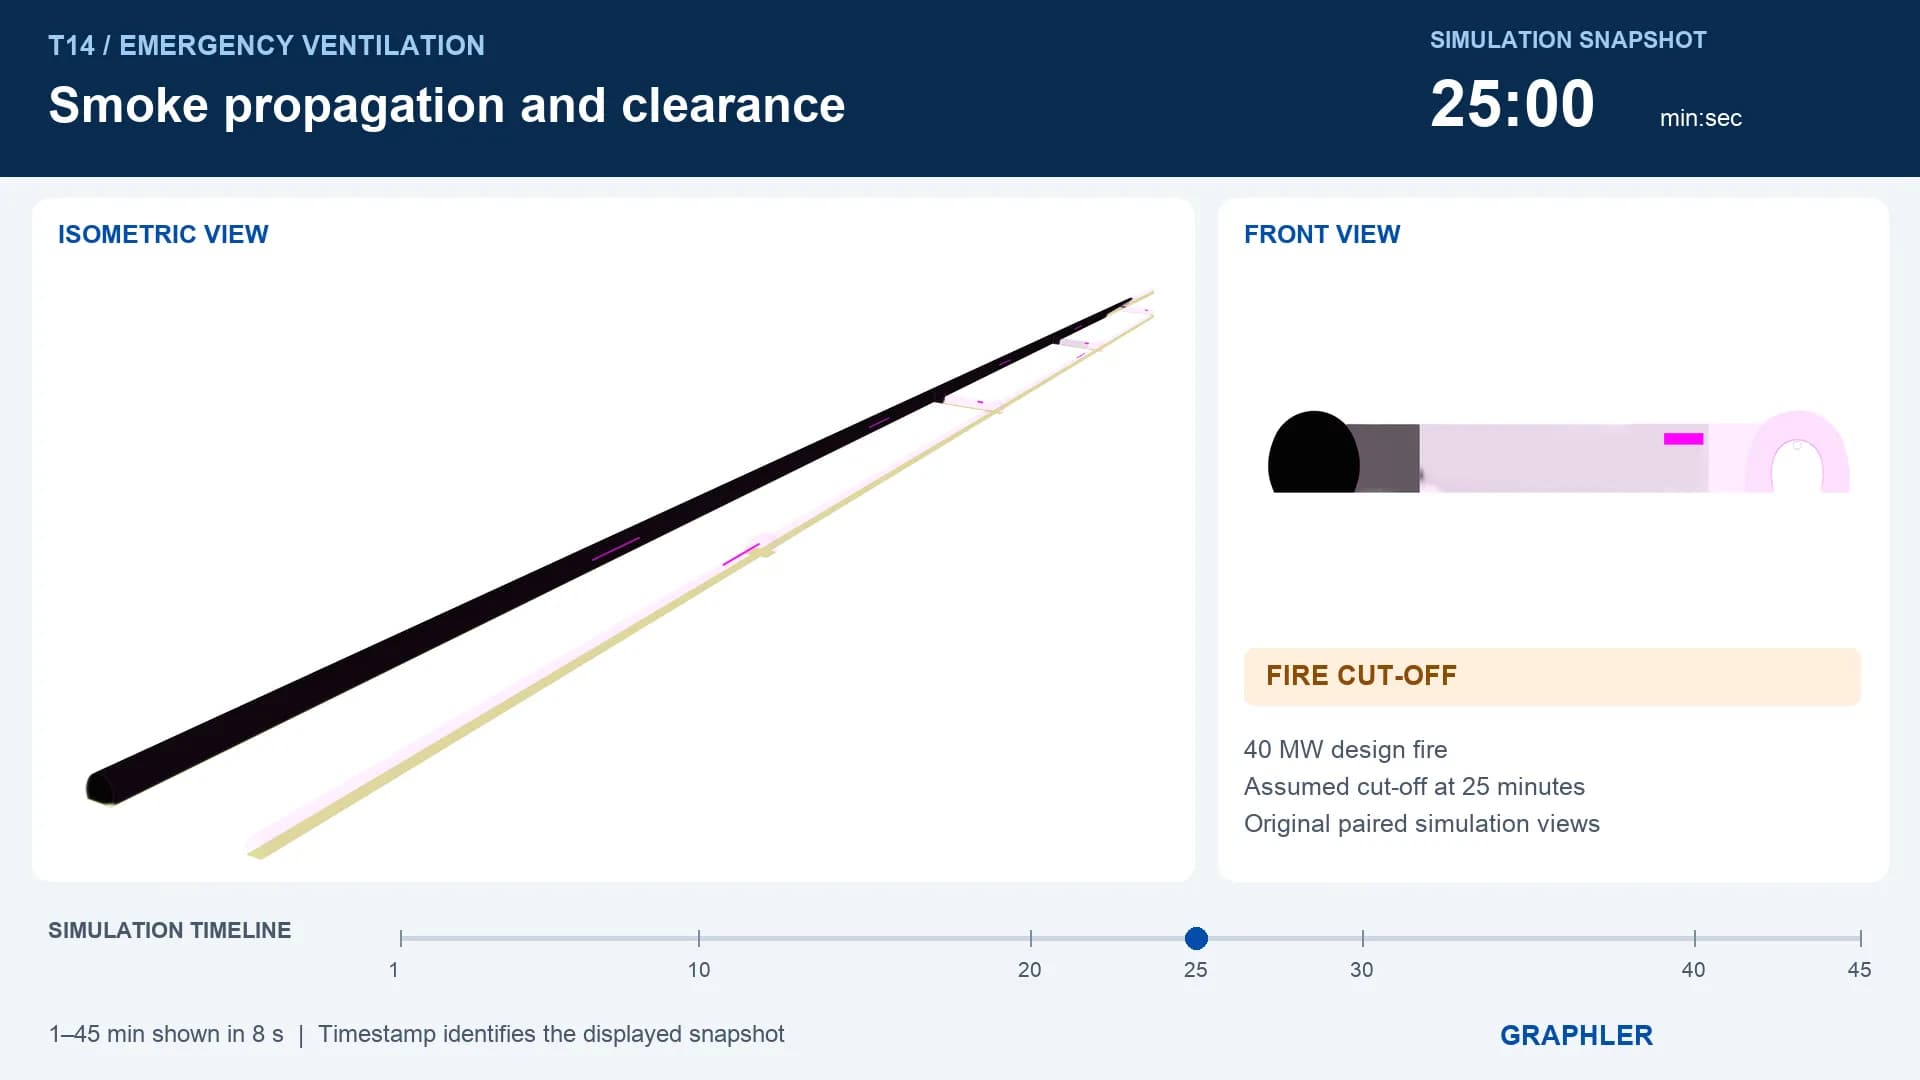
VIDEO / T14_Smoke_Combined_8s.mp4
The timestamp identifies the actual simulation snapshot. Original fields are held between recorded times; no smoke motion is invented between images
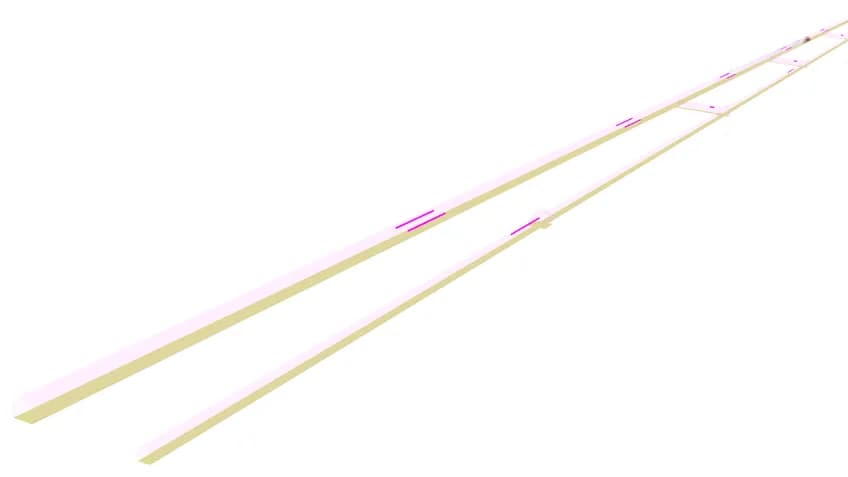
05 min / build-up
The recorded smoke pattern begins to extend downstream from the fire region
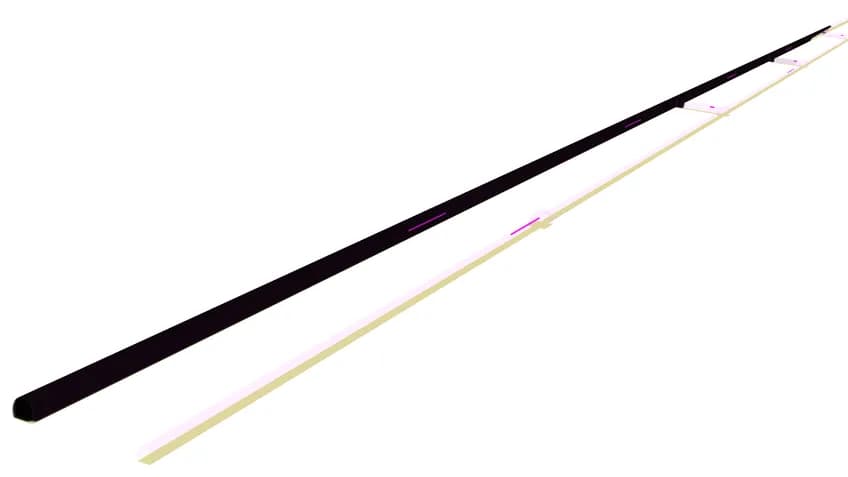
25 min / fire cut-off
The smoke rendering shows the condition at the assumed end of heat and smoke generation
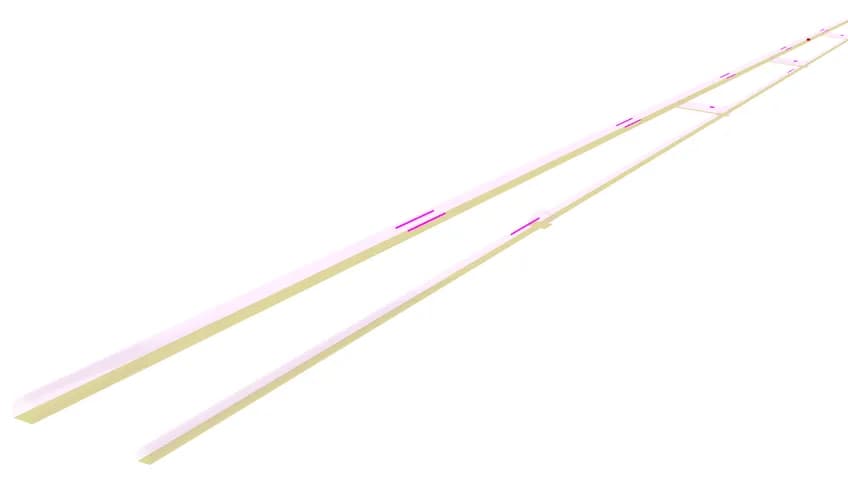
45 min / clearance
The final available snapshot records the state 20 minutes after the assumed fire cut-off
08 / Visibility at 1.5 m
Following the recovery of the occupied-height plane
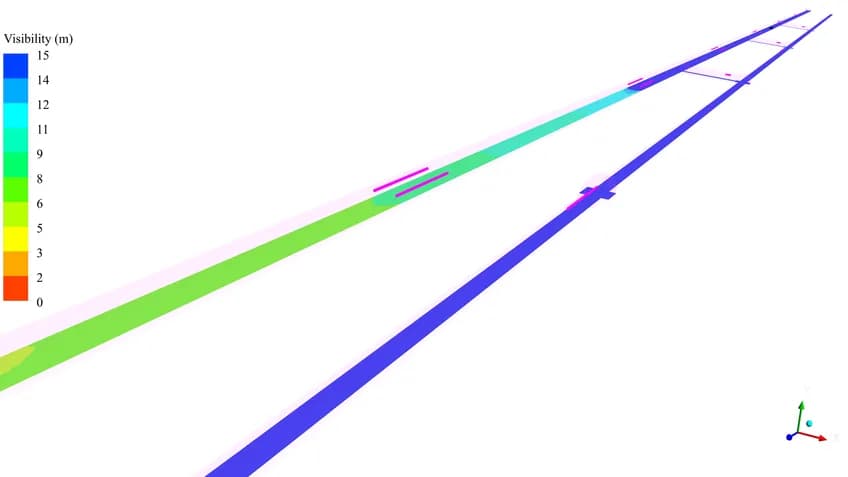
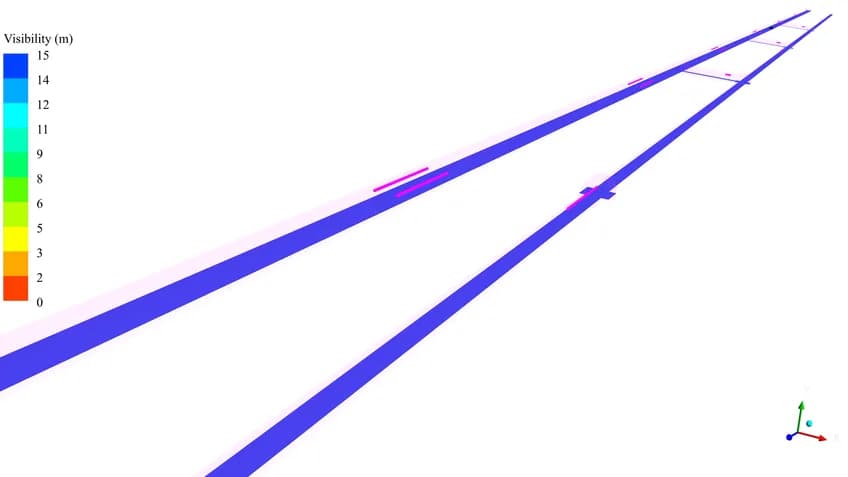
Visibility contours assess the plane 1.5 m above the tunnel floor. Comparing the fire cut-off, intermediate purge and final snapshots shows how the visibility field changes as the ventilation removes smoke
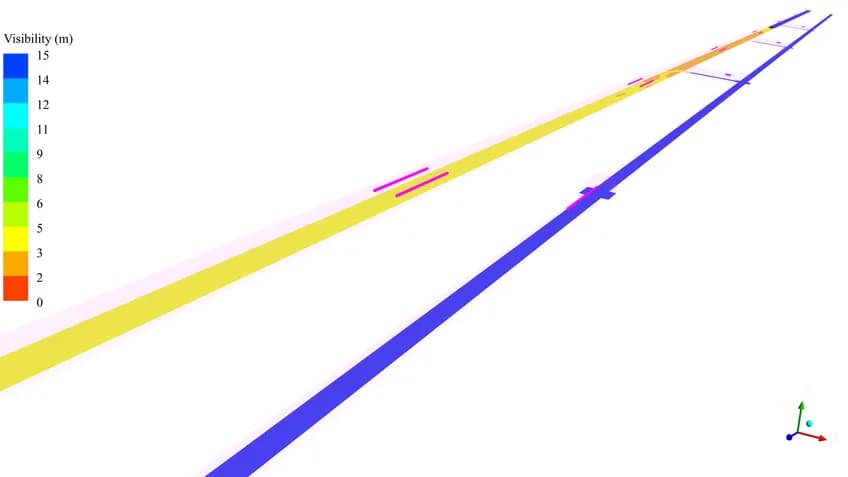
25 minutes
The cut-off snapshot shows reduced visibility in the affected main-tunnel region.
35 minutes
The intermediate view follows the recovery during post-fire ventilation.
45 minutes
The report records visibility above 10 m within 20 minutes after fire cut-off.
This is the reported recovery for the simulated scenario. It does not imply that visibility remained suitable throughout the active fire.
09 / Thermal Response
Peak heat at cut-off, then a declining temperature
The report’s emergency summary lists a maximum temperature of 951 °C at 25 minutes, falling to 17 °C at 45 minutes. The spatial contours locate the heated region, while the numerical history below tracks the reported maxima
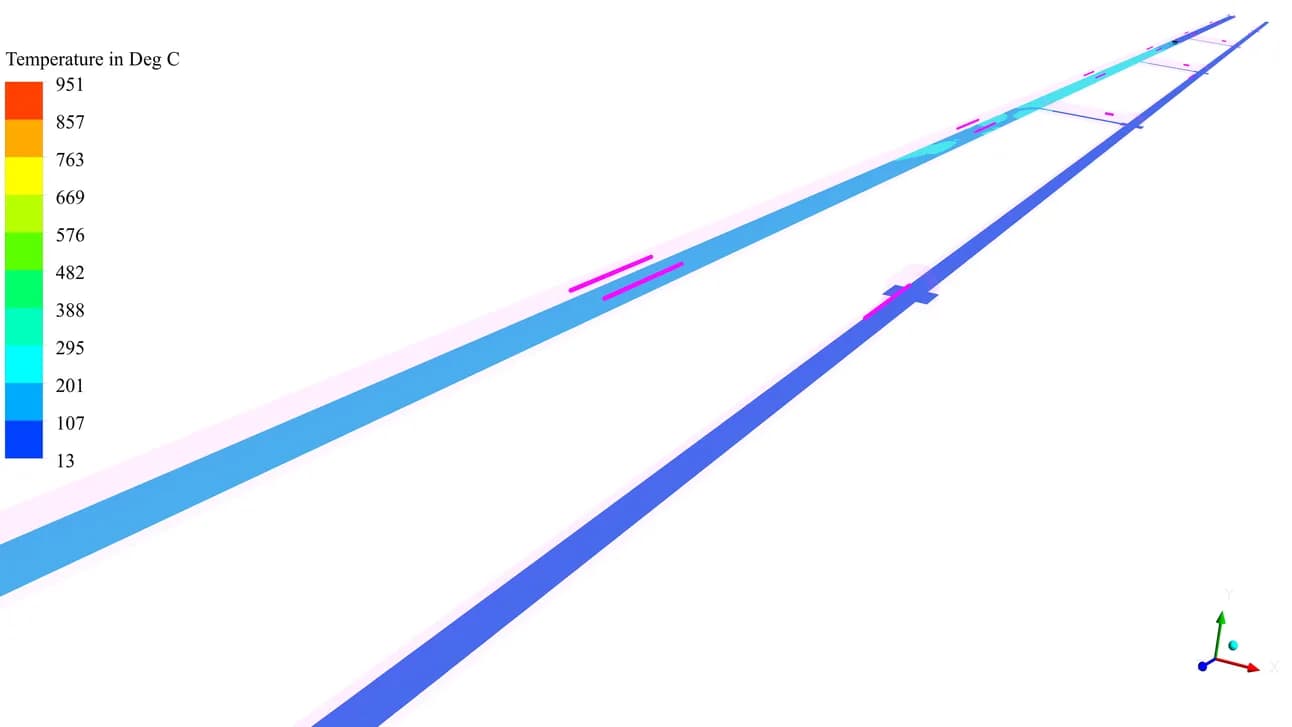
25 min / reported maximum 951 °C
The cut-off contour identifies the concentrated thermal demand around the fire-affected region
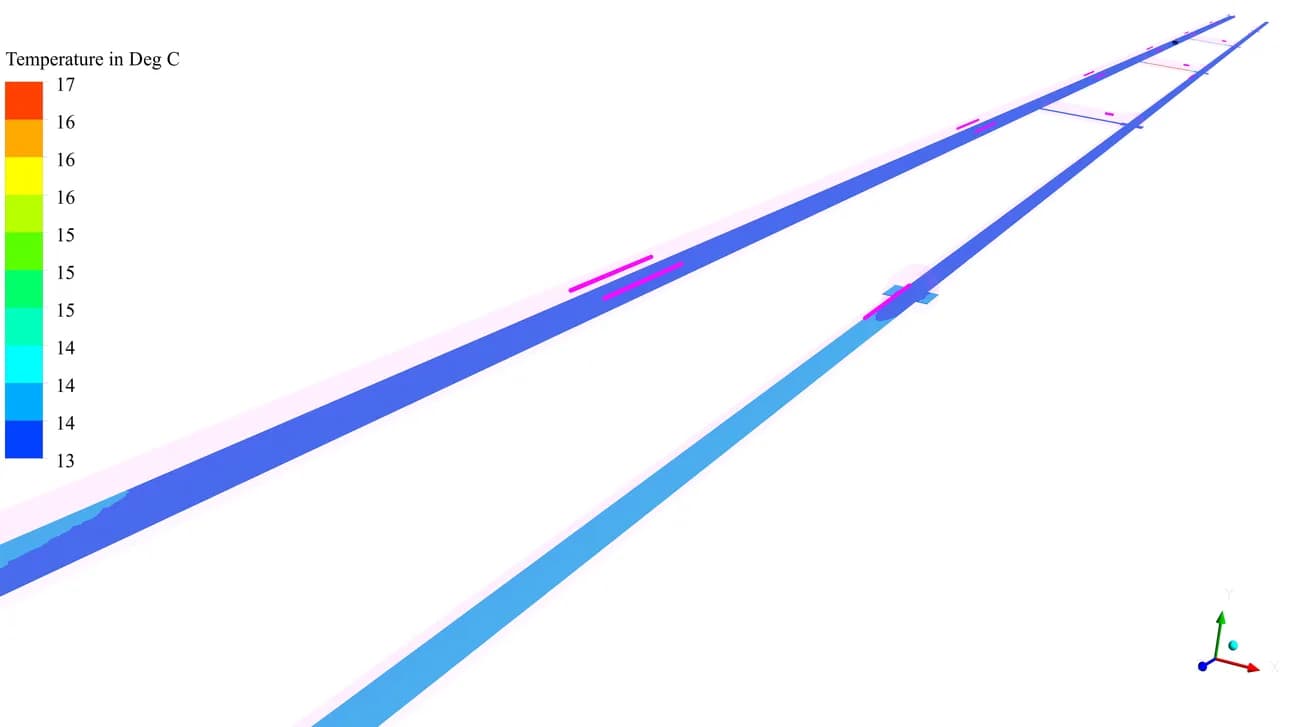
45 min / reported maximum 17 °C
The later contour records the temperature field after 20 minutes of post-fire clearance
The original legends use different ranges. Compare their numerical values rather than matching colours between timesteps
10 / Carbon Monoxide During the Fire
Tracking concentration as the source stops
CO transport provides a separate measure of the fire products. The reported maximum reaches 1,210 ppm at 25 minutes and falls to 4 ppm at 45 minutes. The main tunnel and connecting routes are retained in the result views
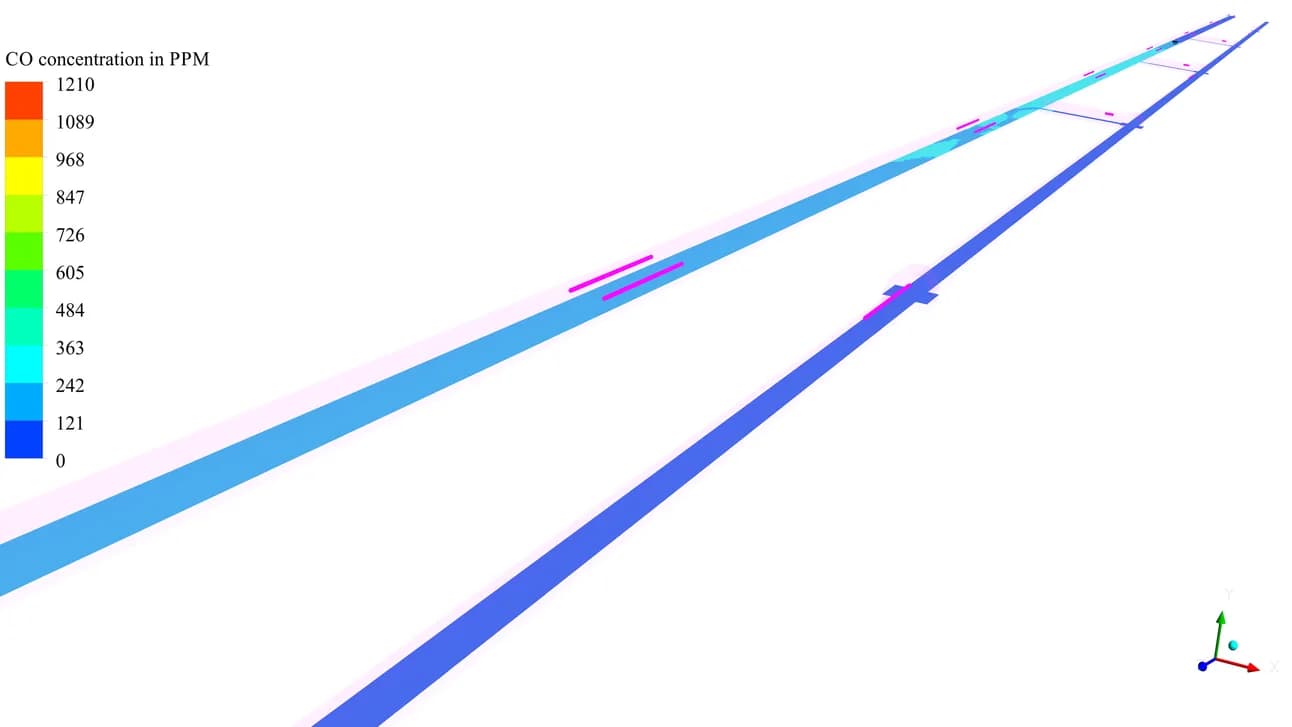
25 min / reported maximum 1,210 ppm
The original mesh view shows the tunnel fluid domain used for the assessment
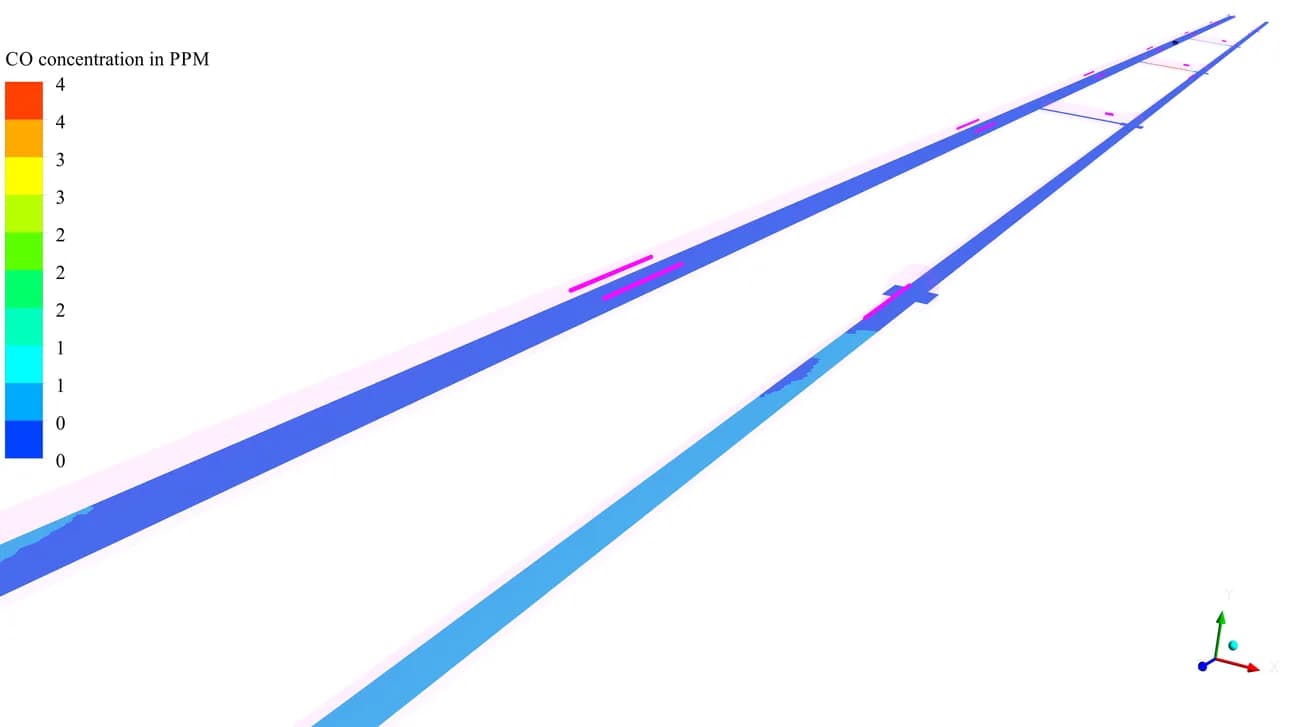
45 min / reported maximum 4 ppm
Fan positions are retained in the geometry so that the local jet flow connects with the longitudinal tunnel airflow.
CO legends also vary by timestep. These are local maxima reported for the simulation, not uniform concentrations throughout the tunnel.
11 / Time History
The reported transition from build-up to recovery
The numerical history places the result snapshots on the same timeline. Temperature and CO peak at the assumed 25-minute fire cut-off, then decline as the source stops and ventilation continues
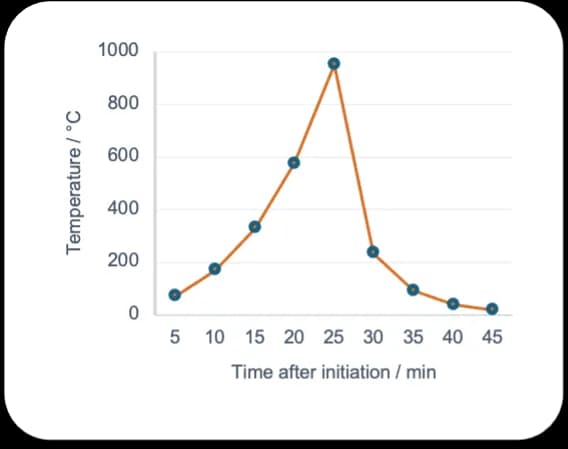
Reported temperature maxima
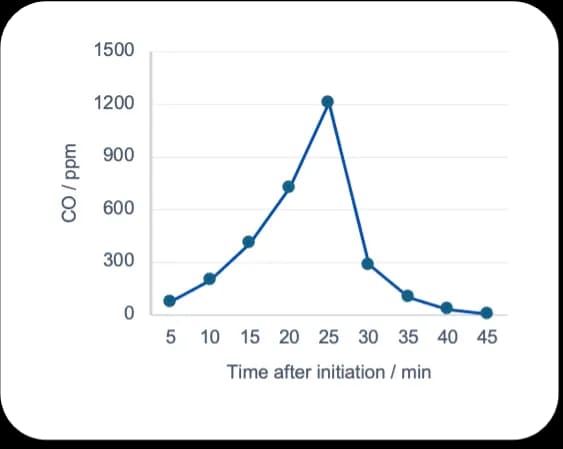
Reported CO maxima
| SIMULATION TIME | TEMPERATURE MAXIMUM | CO MAXIMUM |
|---|---|---|
| 25 min / assumed fire cut-off | 951 °C | 1,210 ppm |
| 35 min / 10 min after cut-off | 91 °C | 100 ppm |
| 45 min / 20 min after cut-off | 17 °C | 4 ppm |
Numerical series reproduced from the final report’s emergency summary. Lines connect the reported five-minute samples.
12 / Engineering Findings
Connecting ventilation response with operating decisions
| AREA REVIEWED | REPORTED FINDING / ENGINEERING IMPLICATION |
|---|---|
| Normal ventilation | The report finds the jet-fan arrangement adequate for flushing the modelled contaminants. |
| Emergency airflow | Reported mean velocities exceed 3 m/s in the assessed sections and 1.5 m plane. |
| Post-fire recovery | Visibility above 10 m is reported within 20 min after the assumed fire cut-off. |
| Fire-response timing | The high 25-minute thermal peak supports the report’s recommendation for earlier fire suppression. |
A documented basis for ventilation design review
The work linked routine air-quality assessment with the tunnel’s transient fire response. Geometry, fan sequencing, smoke views and result histories showed where the ventilation acted and how the modelled conditions changed after fire cut-off. The assessment also exposed the consequence of a 25-minute suppression delay: high local temperature and CO at cut-off. The report therefore recommends a shorter fire-response time to reduce thermal build-up and its impact.