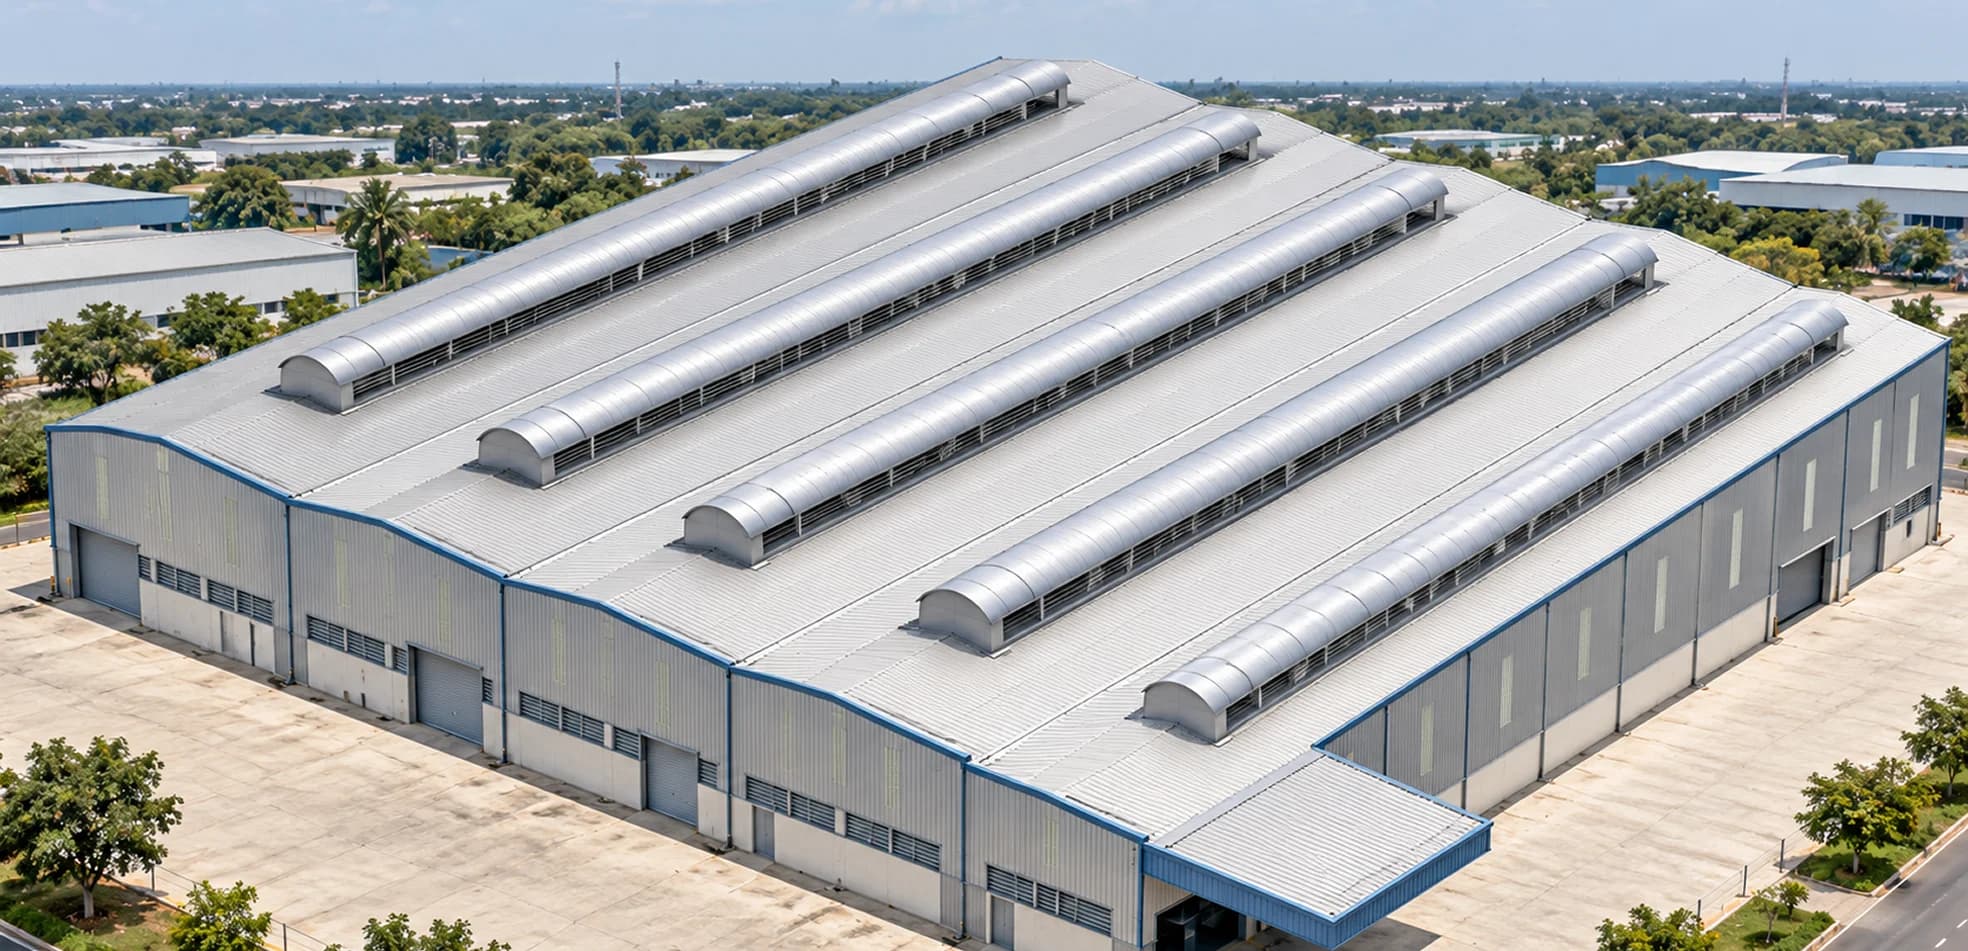
Natural Ventilation of an Industrial Building
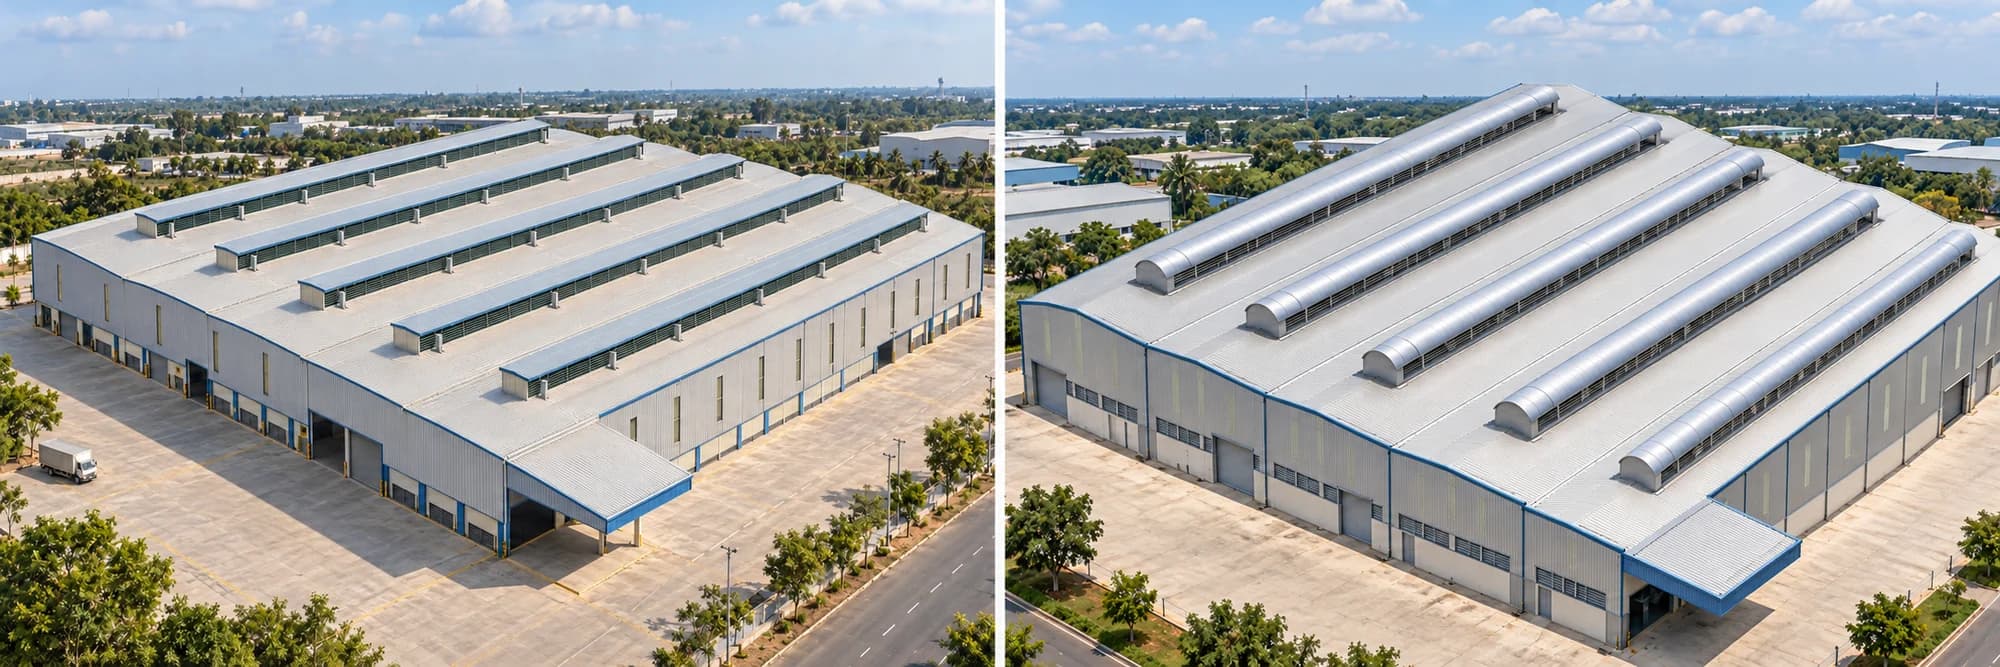
We compared two roof-monitor concepts for a bus-chassis assembly hall, tracing air exchange and indoor temperature through changing daytime weather
Option A Straight Roof Monitors
Option B Curved Roof Monitors
COMPUTATIONAL FLUID DYNAMICS
Natural ventilation of an industrial building
- Requirement
Assess ventilation through the day
Quantify air exchange and indoor temperature in the assembly hall under changing wind, solar radiation and process heat
- Challenge
Connect airflow with thermal response
Roof openings and façade louvres interact with the external wind field. More air exchange does not always mean a cooler building
- Deliverables
A comparative CFD assessment
Building models and mesh, external pressure fields, hourly results, local flow and temperature plots, and an evaluation of both concepts
01 / PROJECT SCOPE
The building and its ventilation problem
The analysis examined the bus-chassis assembly unit at the Oragadam facility. It combined an external wind study with internal flow and heat-transfer calculations to understand how the building openings and roof monitors respond to the specified operating conditions
- Reported process floor area
- 6,985.3 m²
- Target building height
- 11 m
- Reported process heat gain
- 287 kW
The workflow progressed through geometry and opening definition, mesh preparation, external wind-pressure calculation, and transient indoor flow and thermal analysis. Results were then compared by time, design option and location within the hall
02 / VENTILATION CONCEPTS
Two roof-monitor arrangements on the same hall
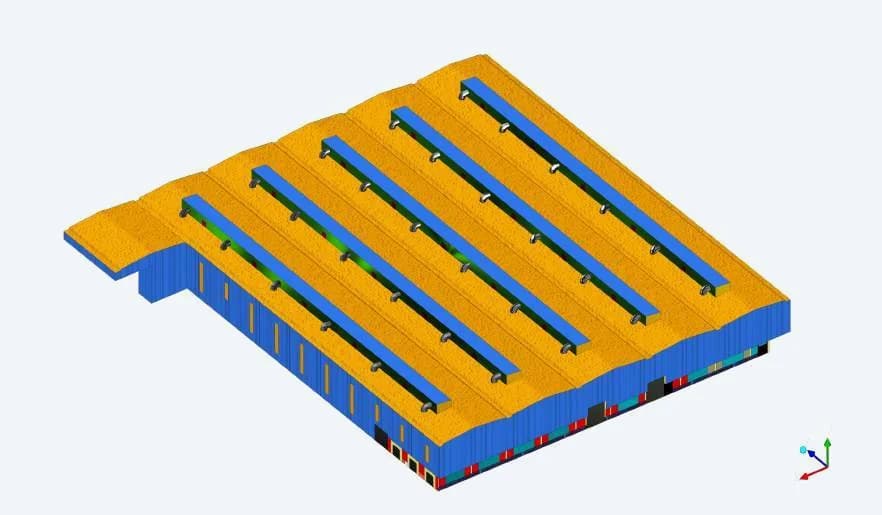
Option A / straight monitor caps
Five long roof-monitor rows sit above the shallow roof bays. Side louvres, shutters and roof openings form the principal modelled ventilation paths
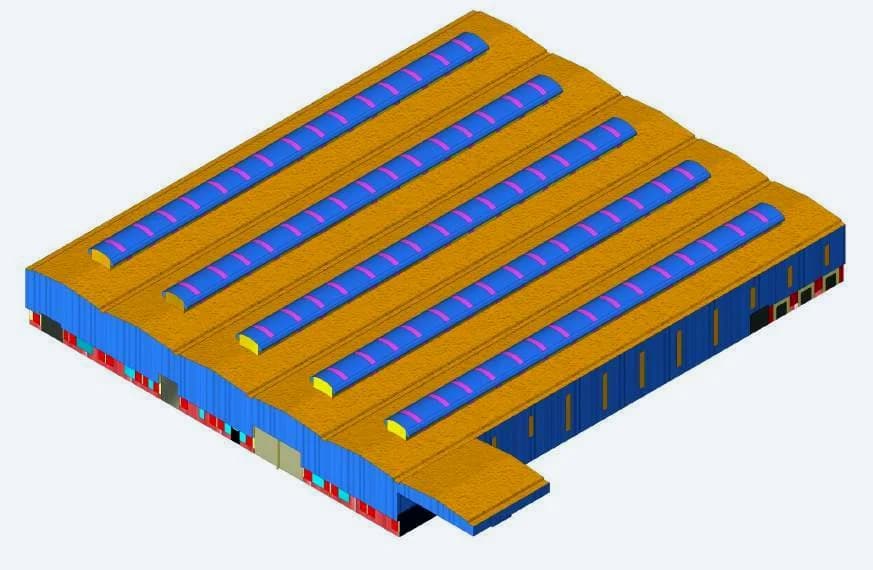
Option B / curved monitor caps
The alternative uses rounded monitor hoods with openings along their sides. The study compares its air exchange and thermal response with Option A
Original analysis geometry. The CAD colours identify model regions and do not specify the building finish.
03 / MODEL PREPARATION
The openings and roof geometry in the mesh
The building model followed the supplied drawings and assigned properties to the openings. The surface-mesh views show the roof monitors and the repeated façade openings. An isolated adjoining area remained in the external wind model but was excluded from the internal ventilation domain
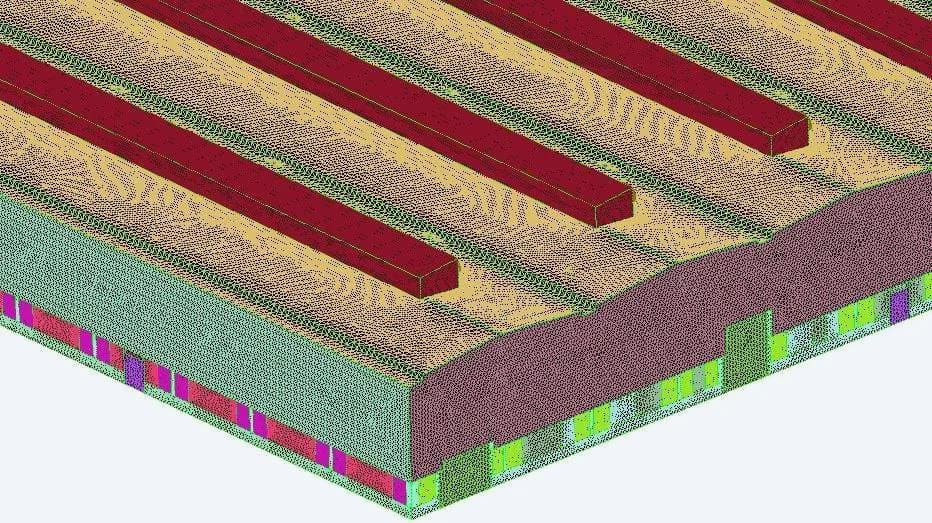
Roof-monitor mesh
The roof view preserves the long monitor openings and their relationship to the main roof surface
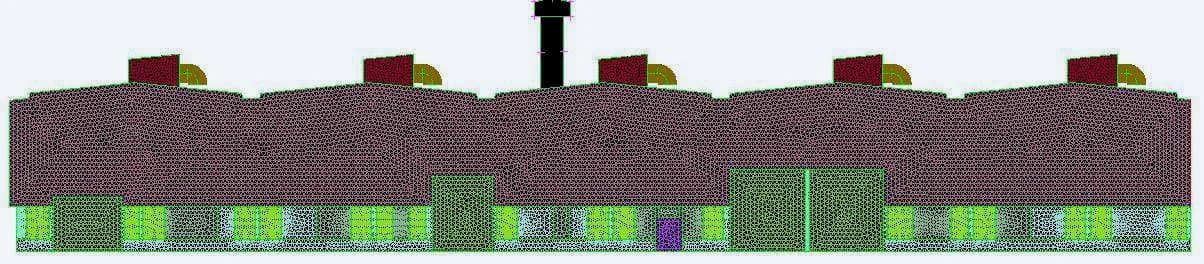
Façade mesh
The elevation retains the louvre bands and large shutter openings through which air enters or leaves the hall
04 / OPENING DEFINITION
Ventilation paths around the building envelope
The opening schedule provided a geometric basis for the airflow model. It distinguished roof-monitor louvres from façade louvres and individual shutters, allowing the result tables to trace flow through named openings
| OPENING GROUP | REPORTED AREA |
|---|---|
| Roof-monitor louvres, all | 36 m² |
| North-east louvres, front | 13 m² |
| North-west louvres | 52.5 m² |
| South-east louvres | 52.3 m² |
| South-west louvres, rear | 68 m² |
Selected louvre areas from the report. The schedule does not separately specify areas for each roof option. Individual shutters were also included
05 / THERMAL & WEATHER INPUTS
A daytime simulation with changing conditions
The transient analysis followed the period from 06:00 to 17:00. It combined hourly ambient conditions and solar radiation with the reported process heat gain. The thermal model included the properties and thicknesses of steel, polycarbonate, gypsum, concrete and glass
| TIME | AMBIENT / °C | EXTERNAL WIND | SOLAR / W/m² |
|---|---|---|---|
| 09:00 | 34.7 | South, 2.8 m/s | 791.65 |
| 11:00 | 38.0 | South, 2.8 m/s | 1,008.32 |
| 13:00 | 38.7 | South, 5.0 m/s | 672.72 |
| 14:00 | 38.0 | Zero wind | 619.16 |
| 16:00 | 35.4 | South-east, 6.3 m/s | 238.36 |
Selected conditions from the report’s weather-input table. The 14:00 case isolates the effect of removing the external wind
06 / EXTERNAL WIND STUDY
Pressure around the hall and its roof openings
The external study represented terrain roughness and neighbouring buildings to establish pressures around the target hall. The report describes checking these pressures against reference values and adjusting them for the opening types before the detailed indoor analysis
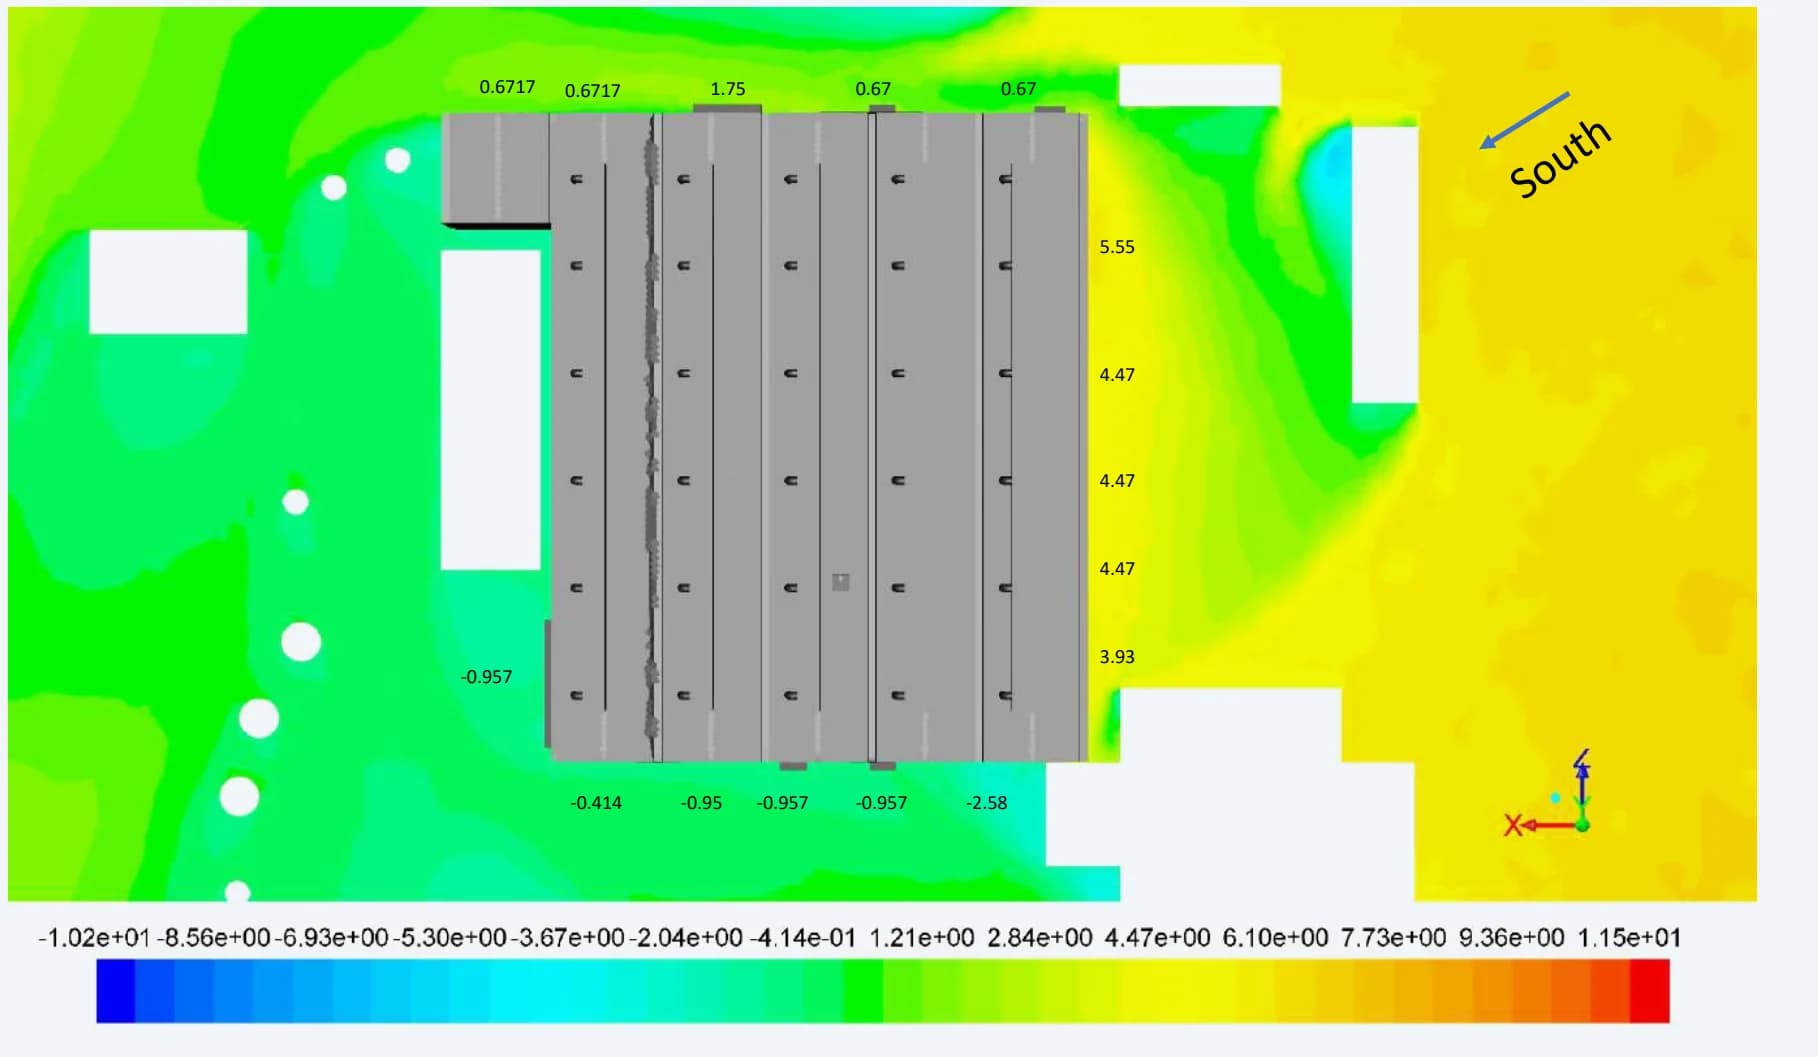
Southerly wind / 4 m/s
The pressure field shows how the building and its surroundings affect the pressures applied around the envelope
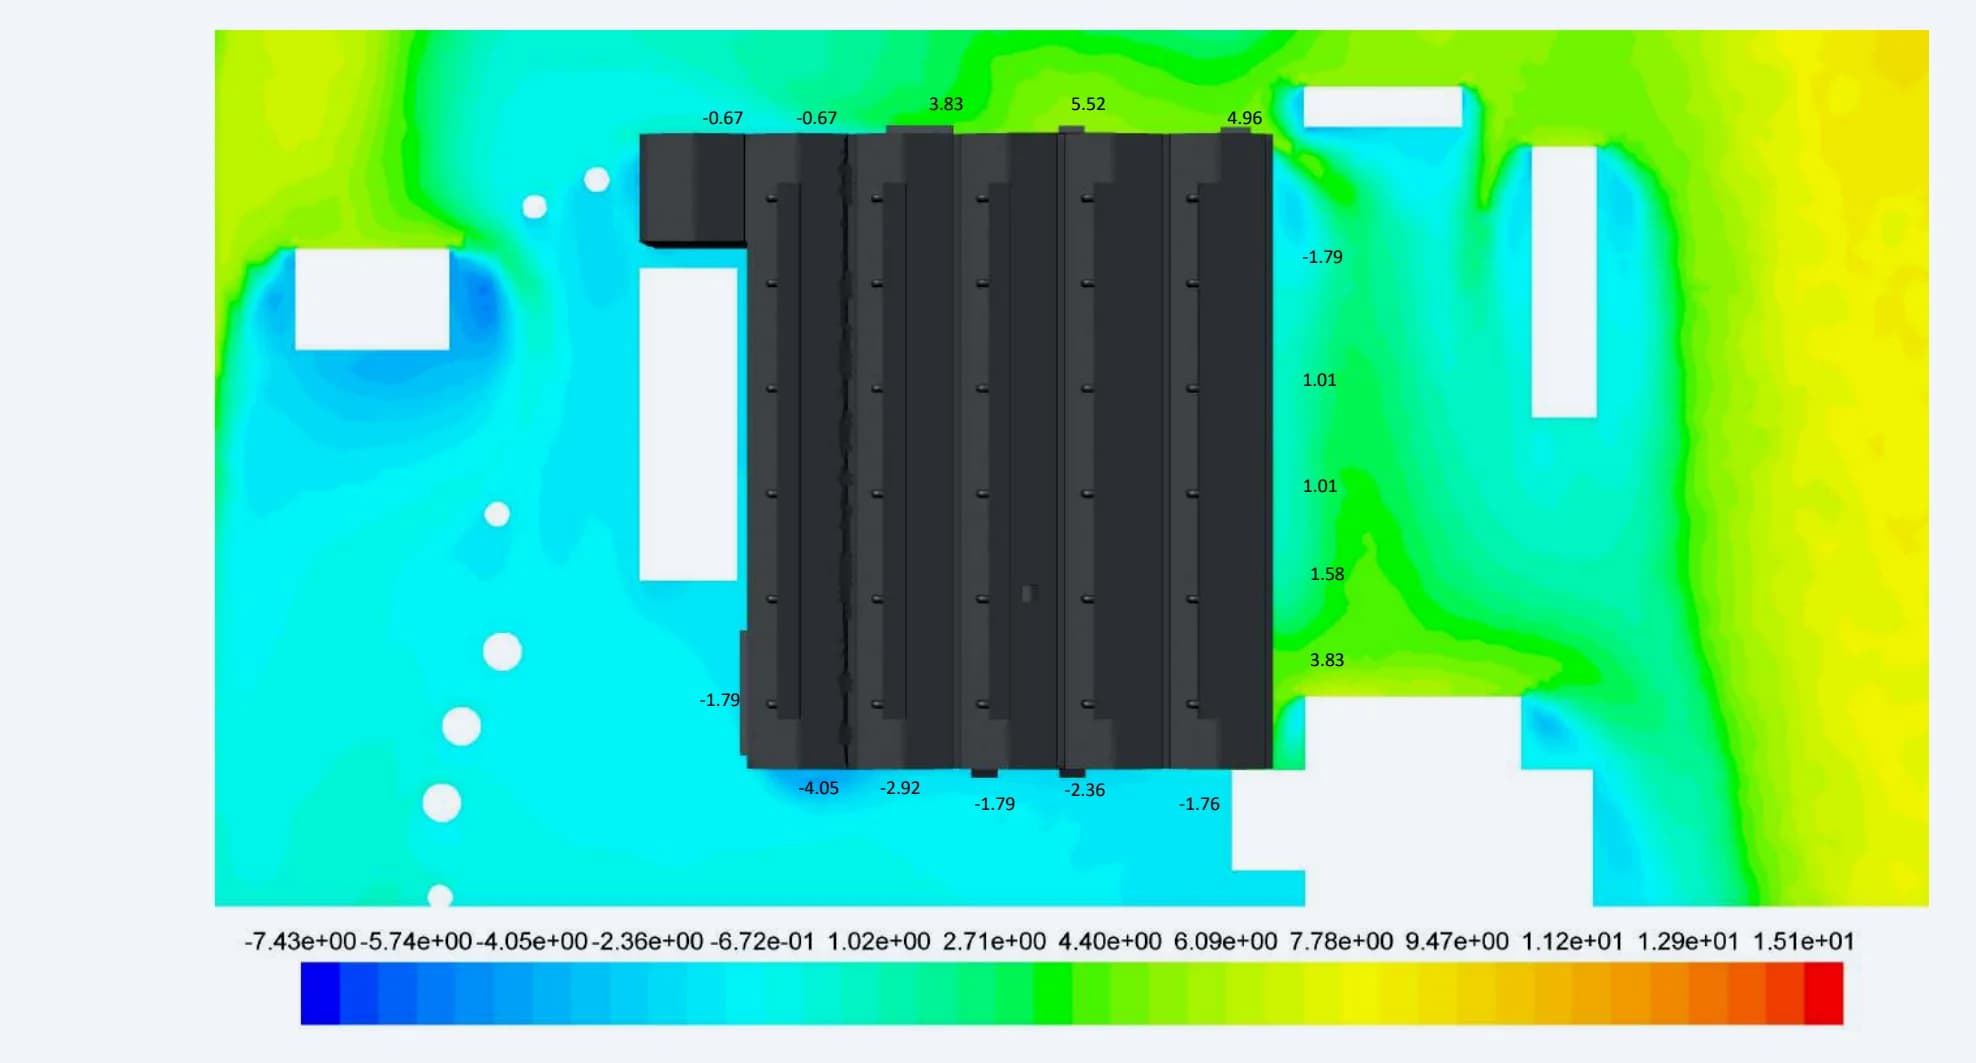
South-easterly wind / 4.9 m/s
A change in wind direction changes the pressure pattern around the façade openings and roof monitors
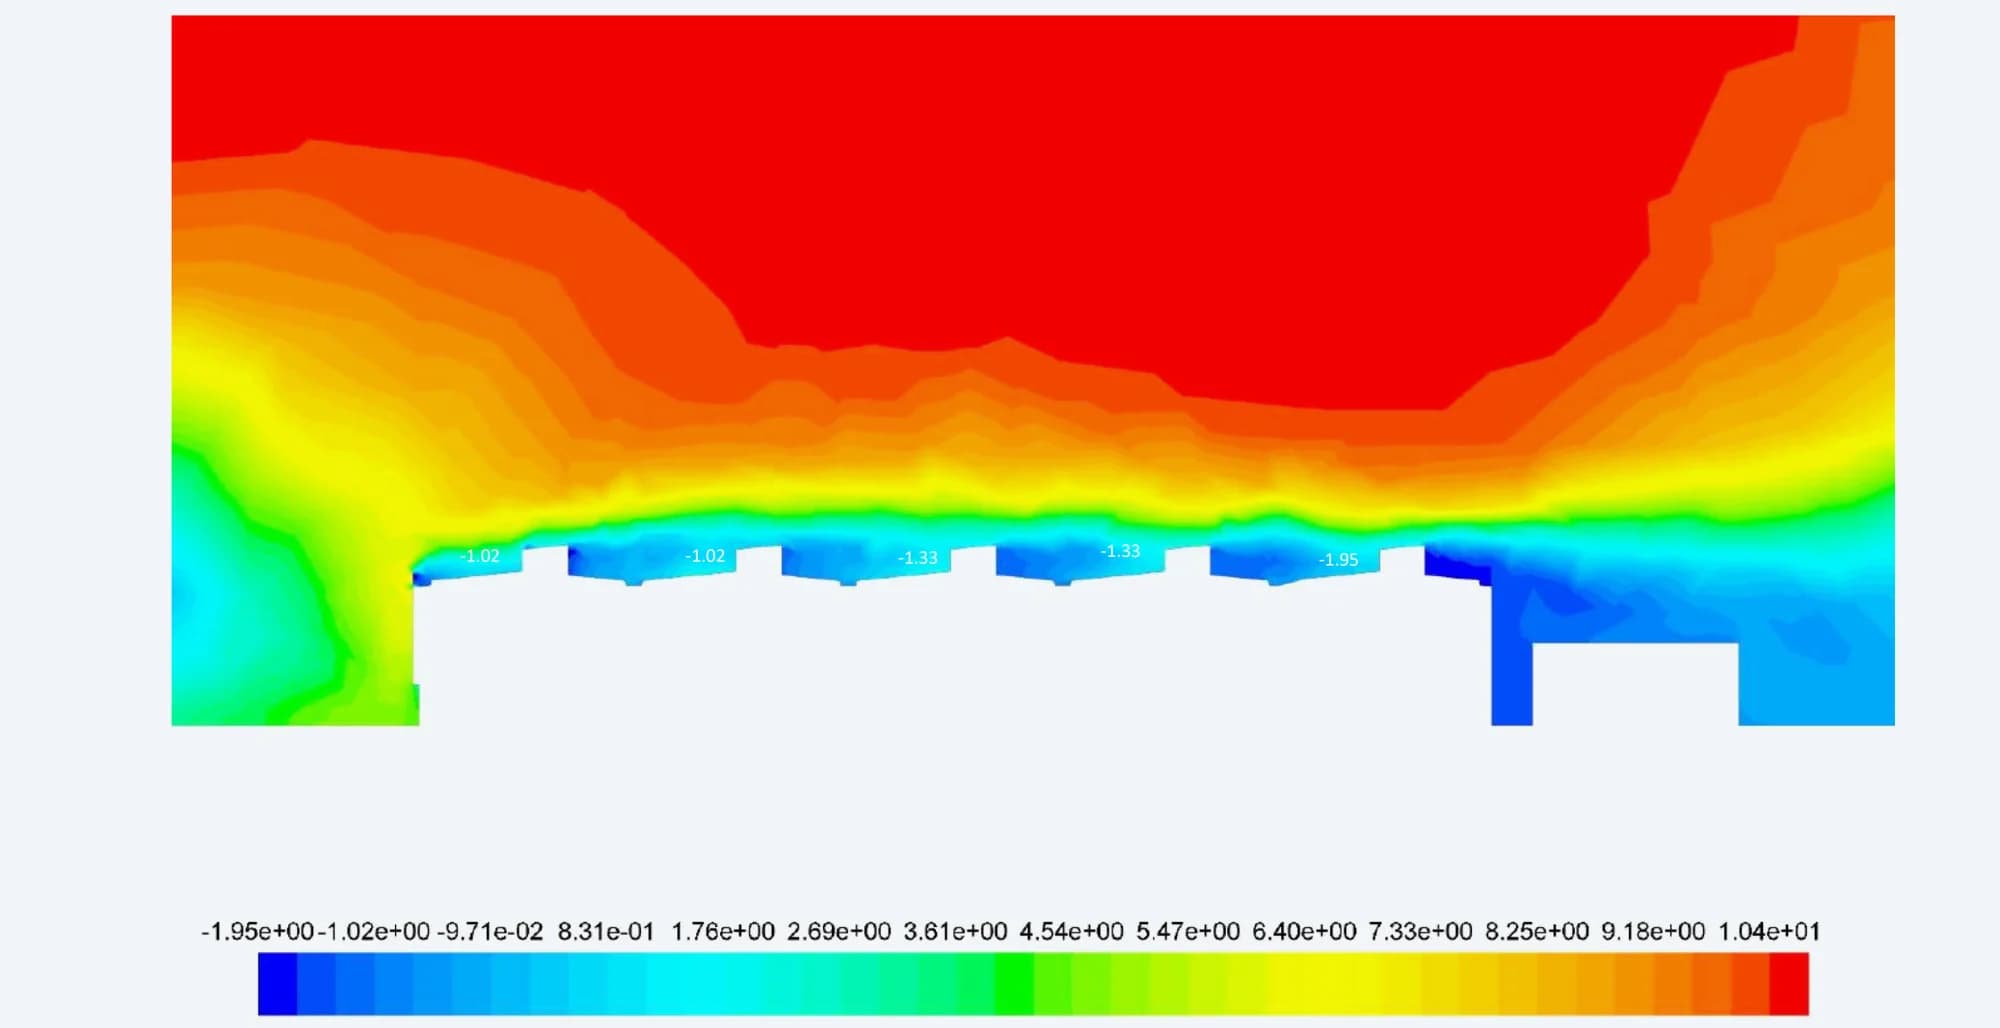
Pressure across the roof
The section shows the pressure variation around the raised monitor rows under the southerly wind condition
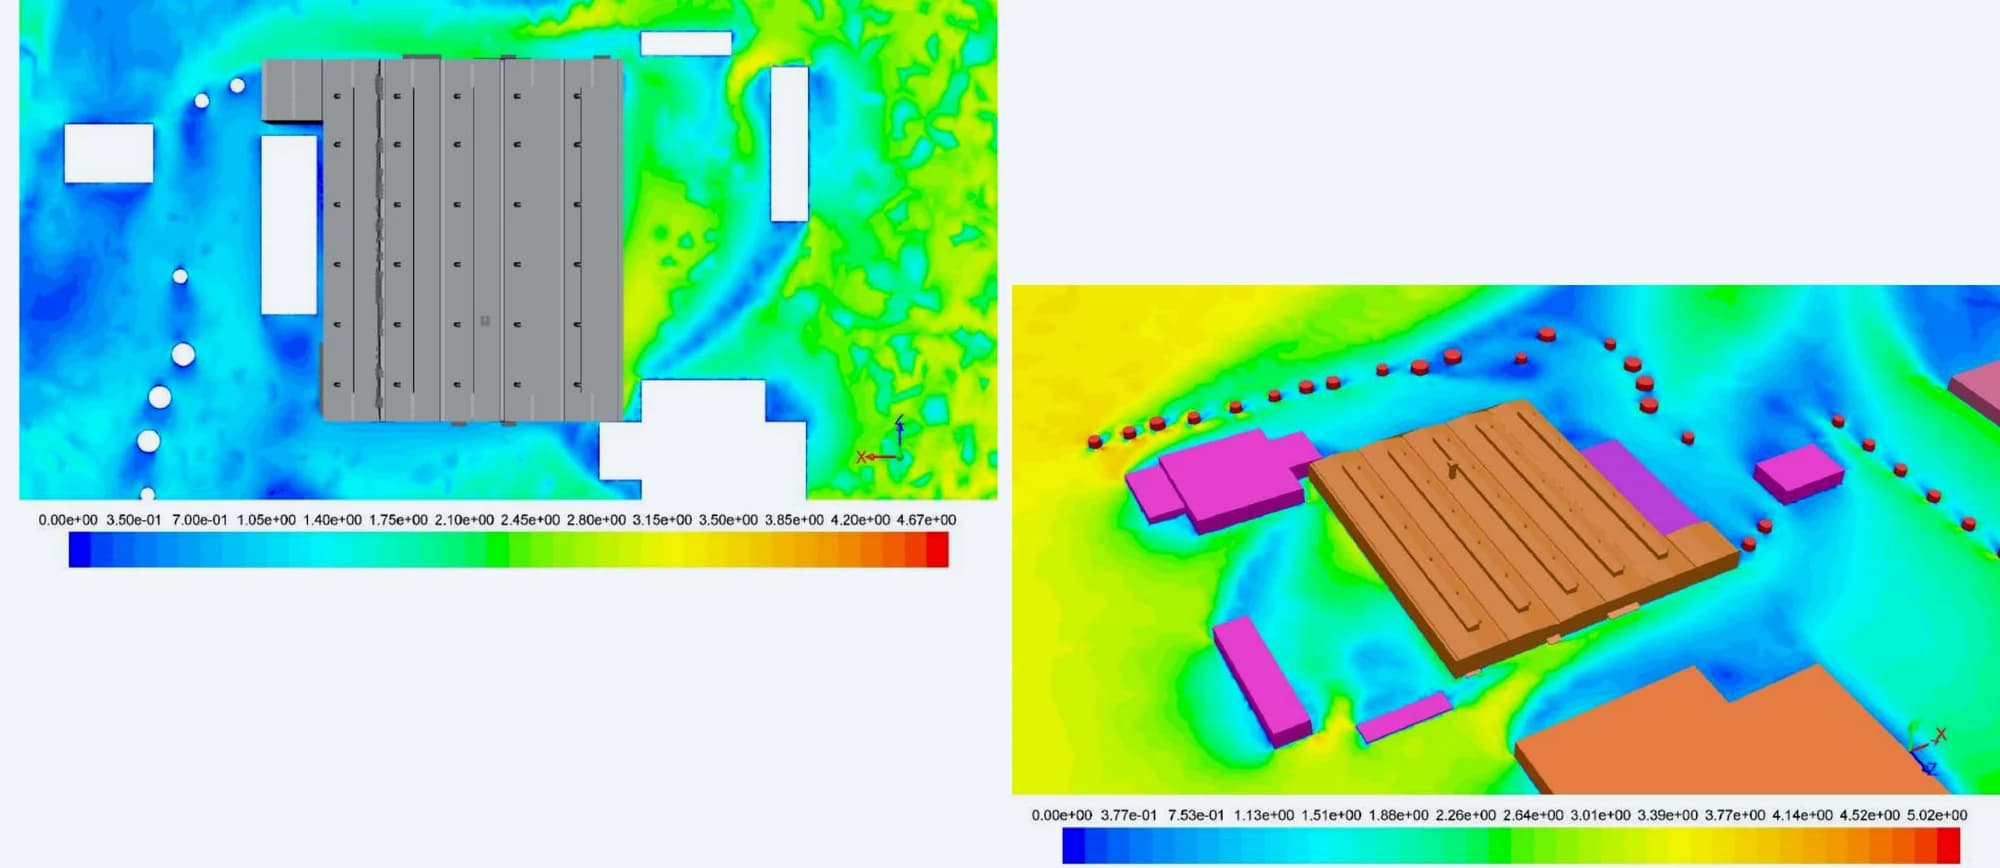
Air movement around the building
The plan and oblique views relate the external velocity field to the surrounding obstacles and the hall
Pressure contours use Pa. External velocity contours use m/s. Read each figure with its own colour scale
07 / RESULT EVALUATION
Whole-building metrics and local conditions
Air changes per hour describe total exchange through the building. To understand where that air travels, the study also reviewed a horizontal plane 1.2 m above the floor and vertical sections through the hall. These spatial results complement the reported average indoor temperatures
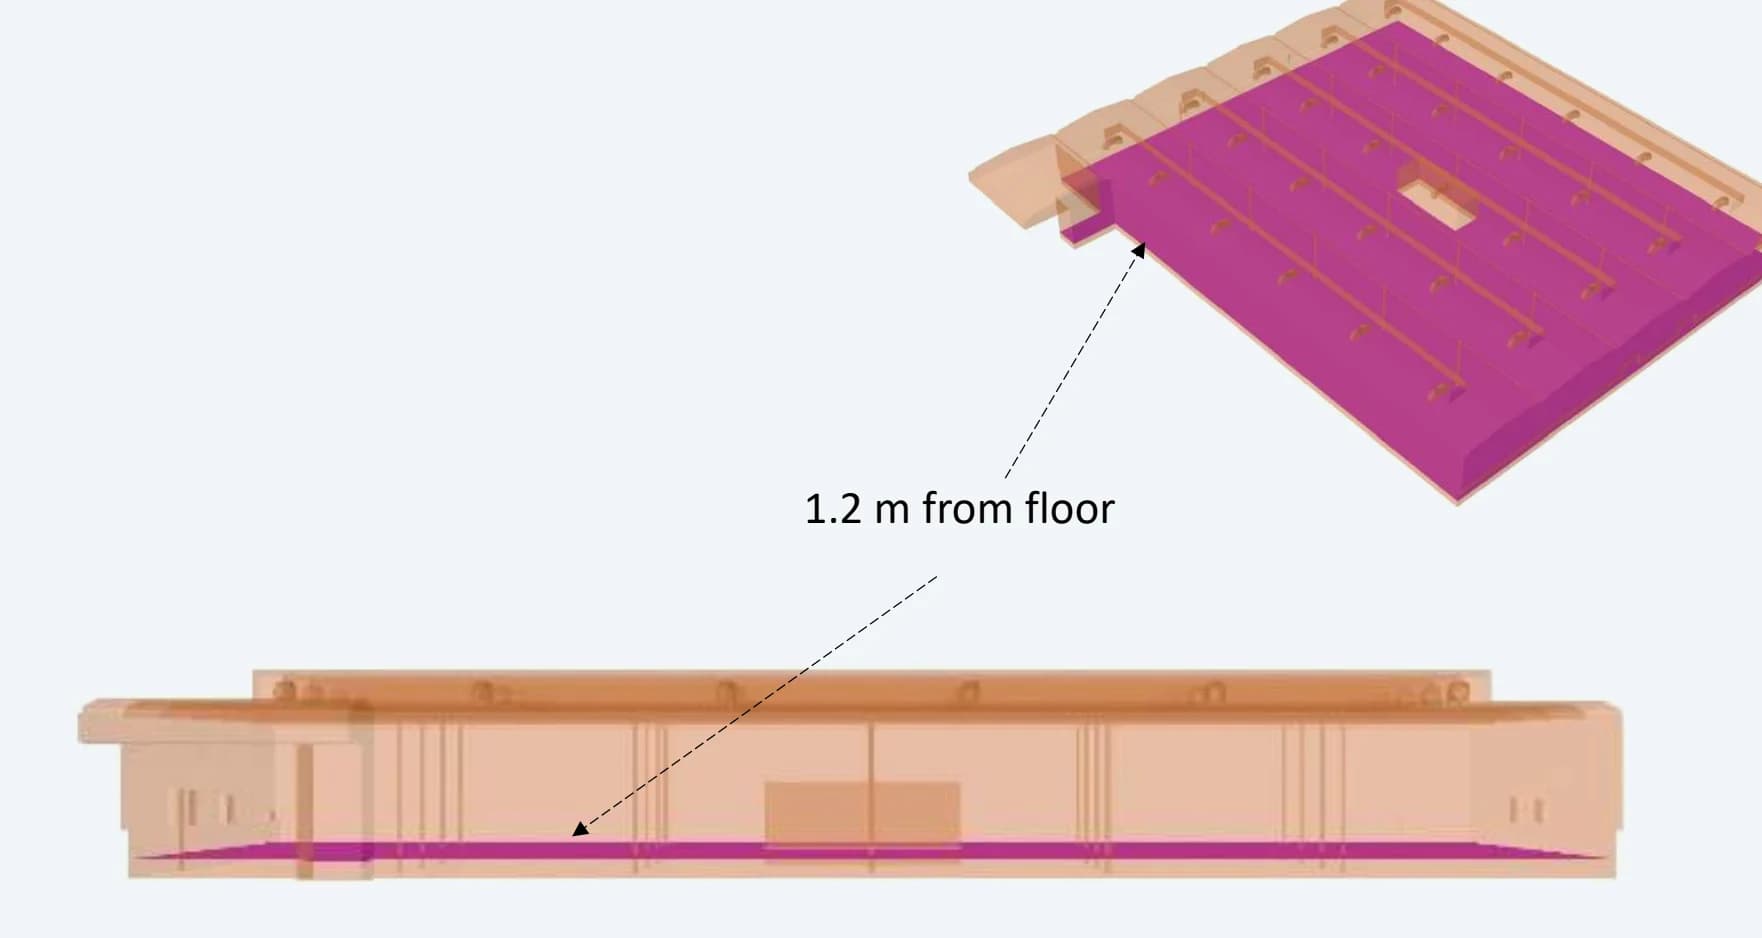
Horizontal plane at 1.2 m
This level provides a consistent view of velocity and temperature across the working area
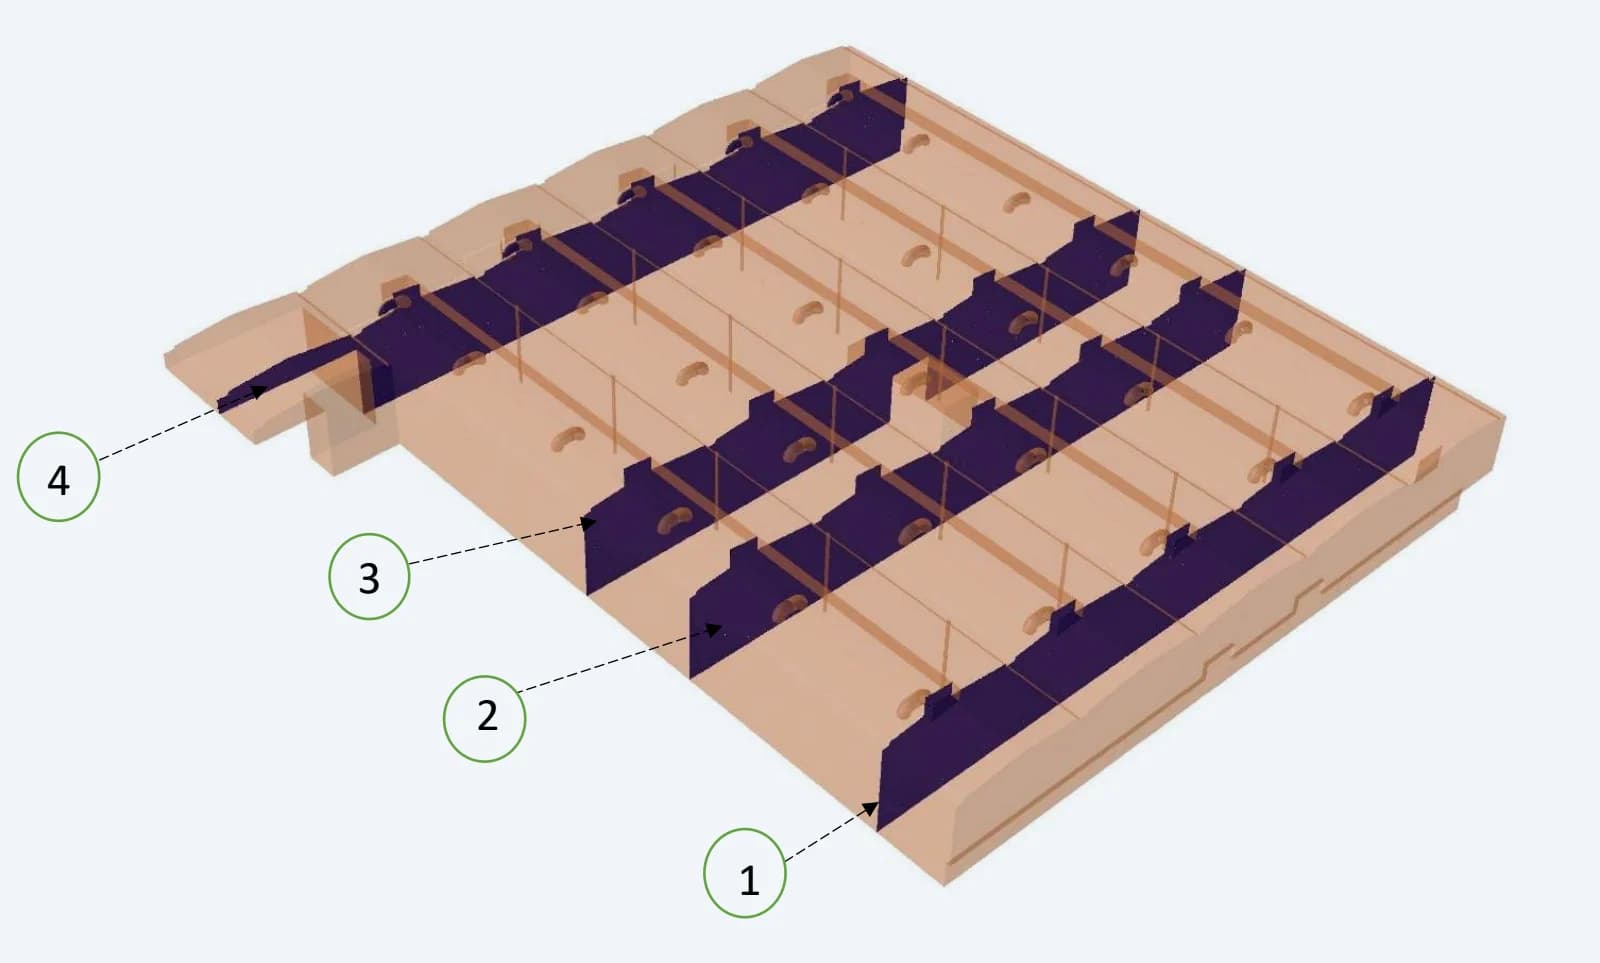
Sections through the roof and floor
The vertical planes expose the flow beneath the roof monitors and the variation through the height of the building
08 / HOURLY COMPARISON
Air exchange and temperature over the day
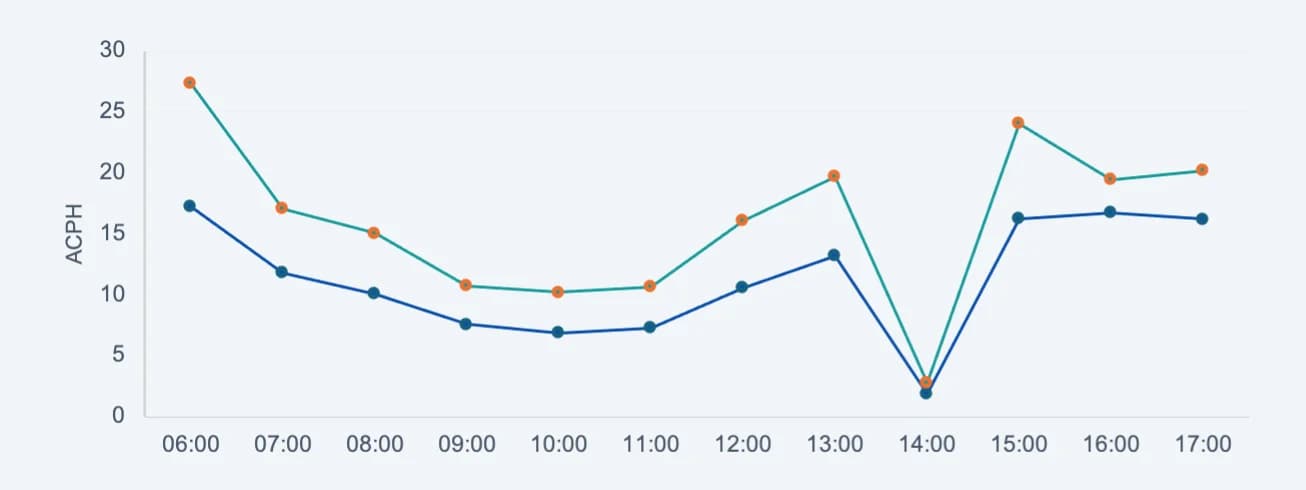
Option B produces a higher air-change rate at every reported hour. Its temperature response varies with time: it is slightly cooler around midday and late afternoon, but warmer from 06:00 to 10:00 and in the zero-wind case. The two measures therefore need to be reviewed together
Air changes per hour
Average indoor temperature
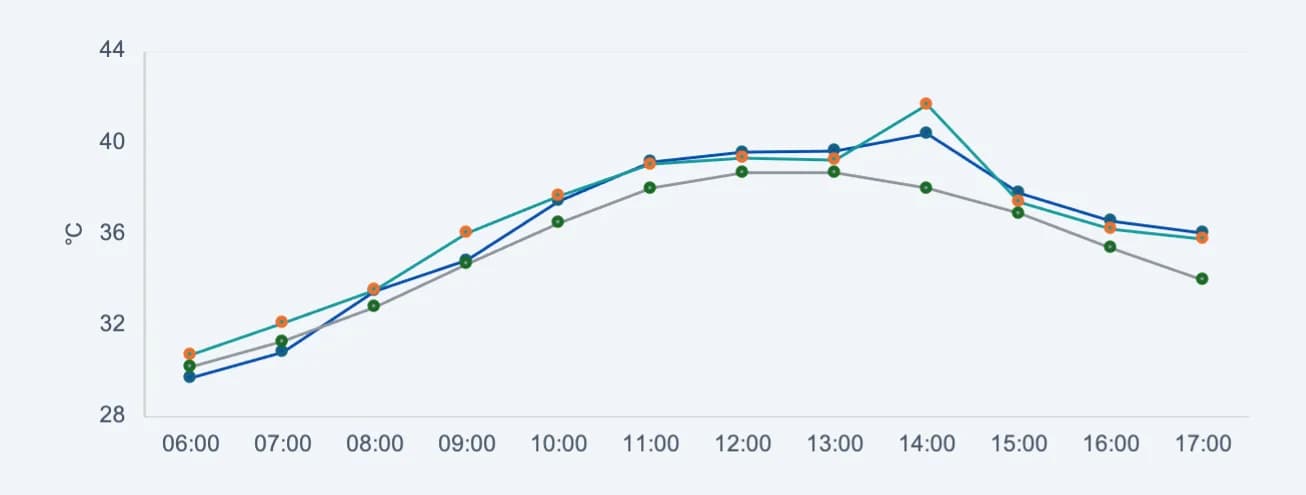
Hourly values from the report’s comparison tables. The sharp change at 14:00 corresponds to the zero-wind test condition
This level provides a consistent view of velocity and temperature across the working area
09 / MORNING RESPONSE
Higher exchange without a lower average temperature
At 09:00, with a southerly wind of 2.8 m/s, Option B increases reported ventilation from 7.57 to 10.74 air changes per hour. Its average indoor temperature is 36.06 °C compared with 34.85 °C for Option A. The local velocity field helps explain why exchange rate alone is an incomplete design measure
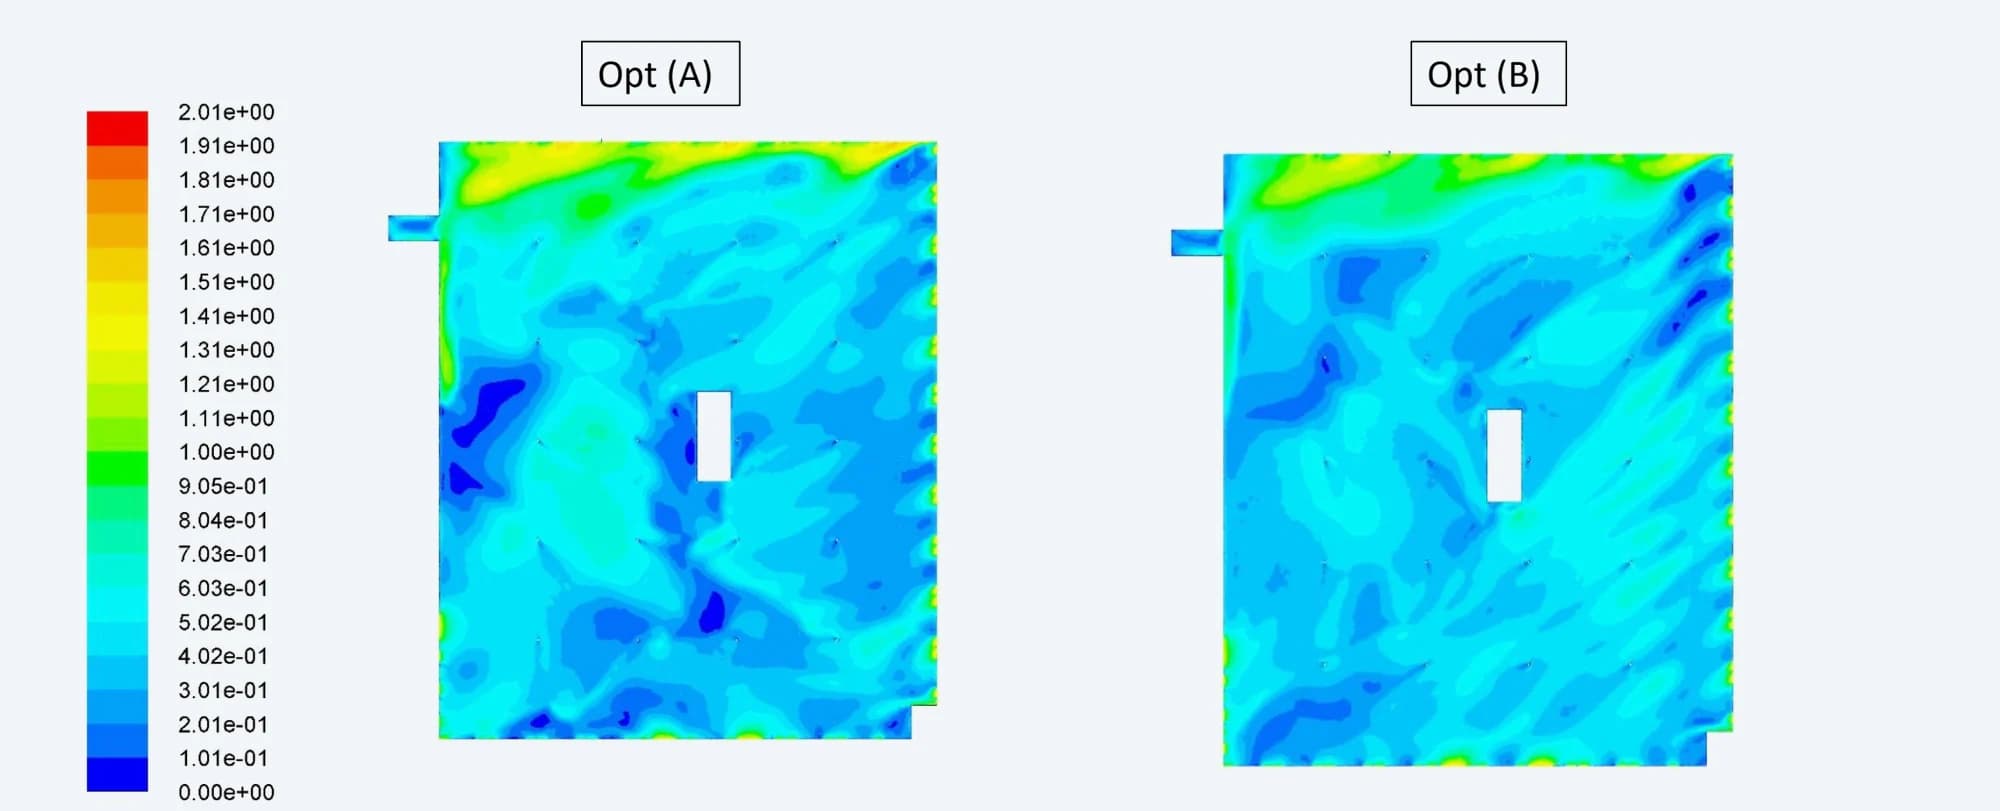
09:00 velocity in m/s at 1.2 m above the floor. Option A at left and Option B at right, on the same velocity scale
10 / ZERO-WIND CASE
The most demanding thermal condition in the study
At 14:00, the report removes the external wind and labels the case “stack effect only”. Air exchange falls to 1.90 ACPH for Option A and 2.81 ACPH for Option B. The average temperatures rise to 40.40 °C and 41.65 °C respectively, against a 38.0 °C ambient condition
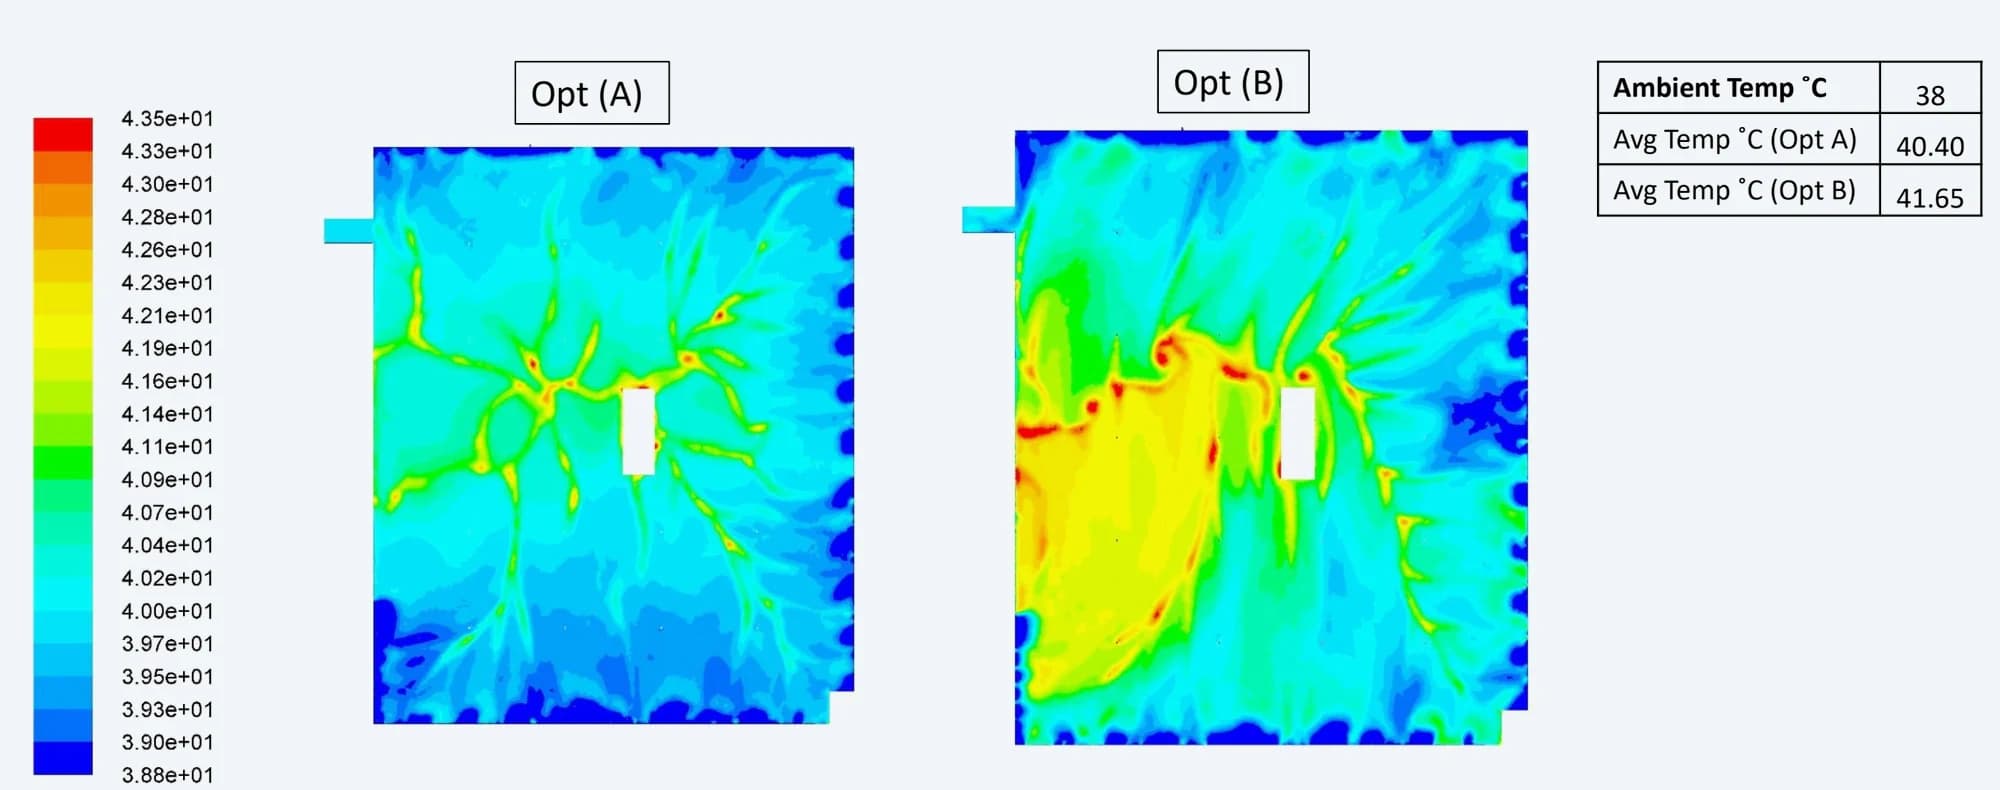
14:00 temperature in °C at 1.2 m above the floor. The local warmer regions remain visible alongside the whole-building averages
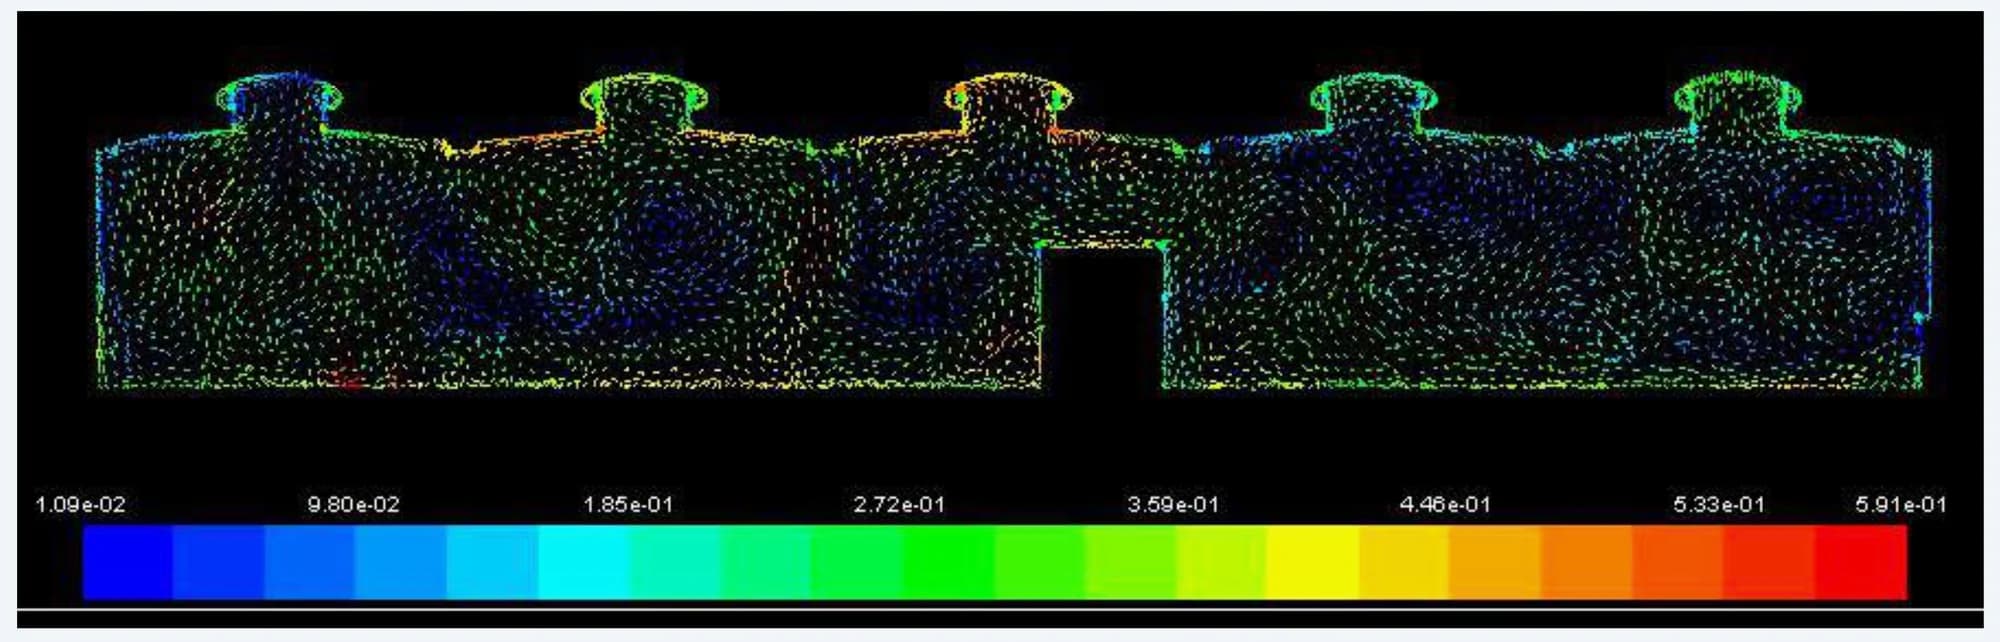
Option B vertical-section velocity vectors show local circulation around the monitor openings. Velocity is in m/s
11 / LATE-AFTERNOON RESPONSE
Improved exchange as the wind strengthens
The 16:00 summary uses a south-easterly wind of 6.3 m/s. Option B reaches 19.47 ACPH compared with 16.75 ACPH for Option A, while its average indoor temperature is 0.33 °C lower. Local distributions still matter when interpreting those building-wide values
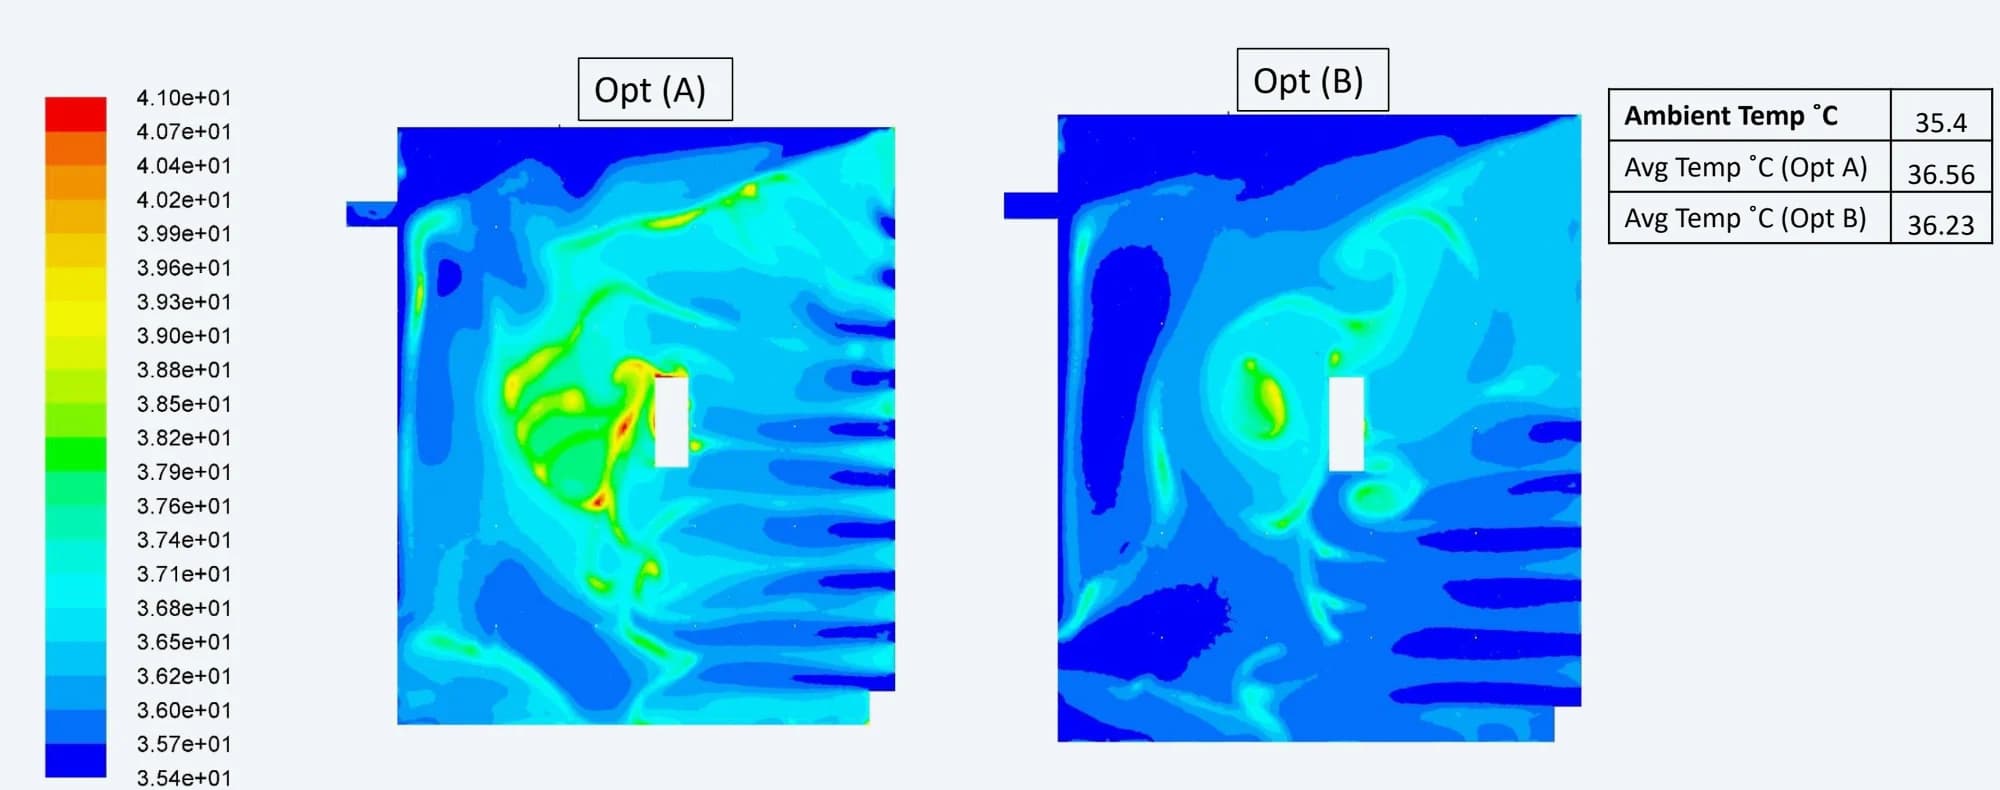
16:00 temperature in °C at 1.2 m above the floor. Each time case uses its own contour scale, so colours should be read with the accompanying legend
12 / DESIGN REVIEW
The result depends on the operating condition
| CONDITION | ACPH A / B | AVERAGE TEMPERATURE A / B |
|---|---|---|
| 09:00 / south wind | 7.57 / 10.74 | 34.85 °C / 36.06 °C |
| 14:00 / zero wind | 1.90 / 2.81 | 40.40 °C / 41.65 °C |
| 16:00 / south-east wind | 16.75 / 19.47 | 36.56 °C / 36.23 °C |
Selected values reproduce the three detailed executive summaries. Small rounding differences occur in the hourly comparison tables
A quantified comparison of two ventilation concepts
The analysis established how each concept exchanges air and manages heat across the specified daytime conditions. Option B increased the predicted air-change rate, while the thermal comparison revealed the limits of that improvement during the morning and the zero-wind case The geometry, pressure fields and local indoor results gave the design team a documented basis for comparing roof-monitor options and reviewing conditions that need particular attention