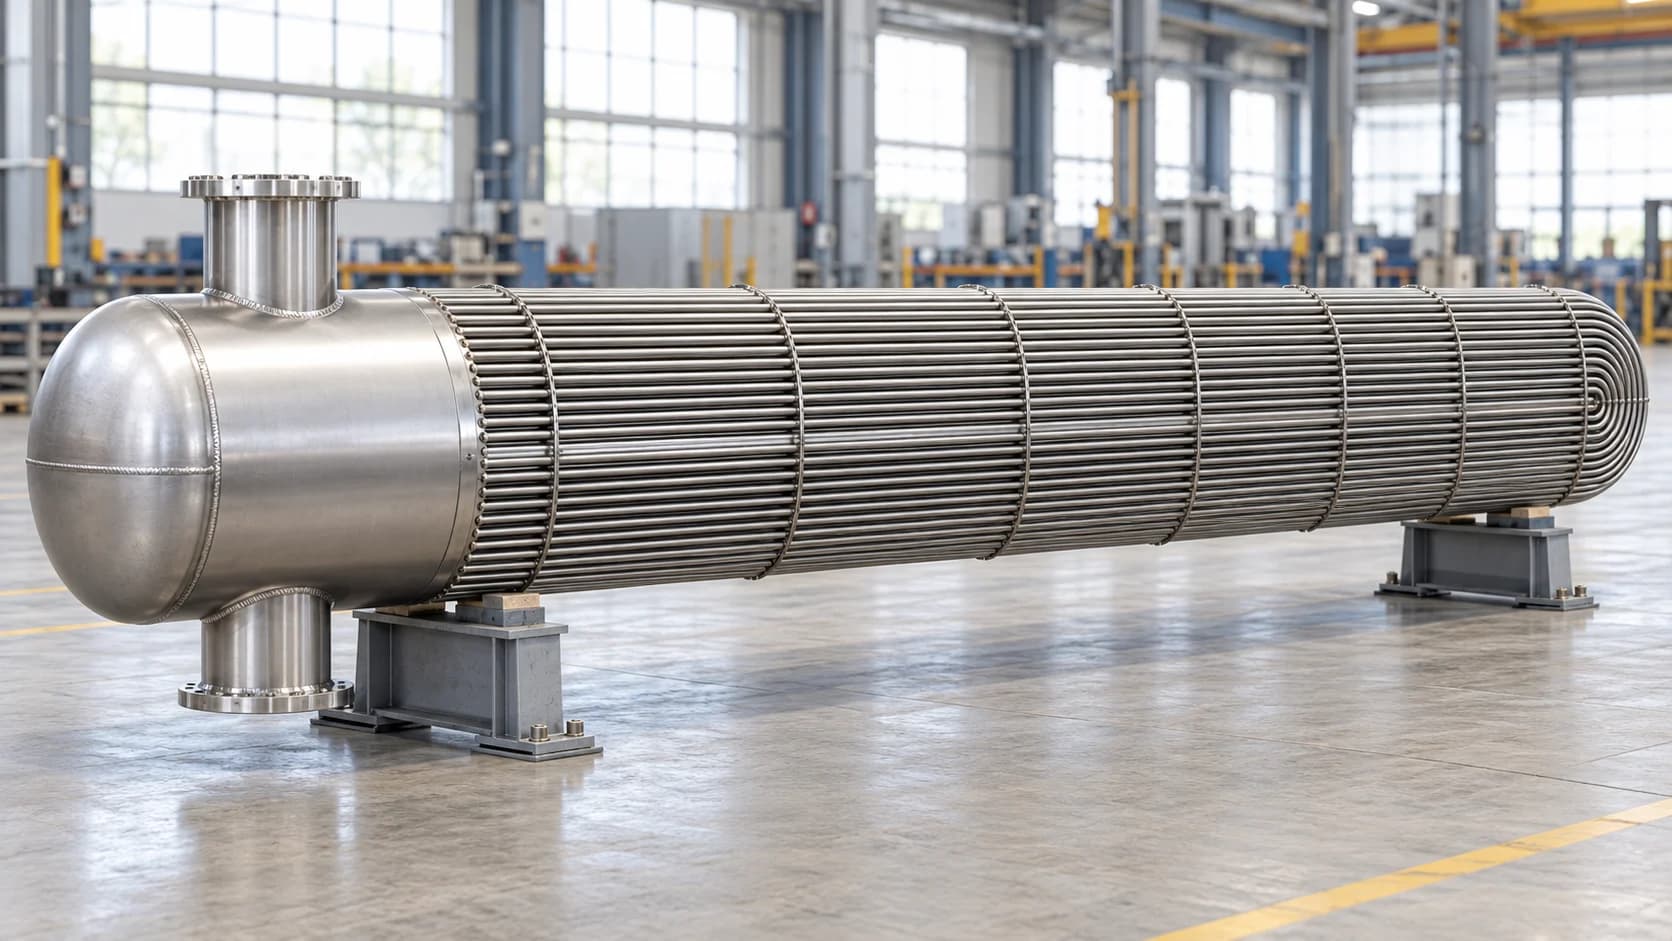
CFD of a submerged tube-bundle heat exchanger
Natural-gas heating, flow distribution and pressure loss
THOMAS ODRY CONSULTING LLC / CFD
CFD Of a Submerged tube-bundle heat exchanger
- Requirement
Quantify thermal performance
Determine natural-gas outlet temperature, pressure loss and heat transfer for the defined operating condition
- Challenge
Connect heating and flow
Resolve flow through the header, parallel tubes and return bends while representing wall heat transfer and fouling
- Deliverables
A performance assessment
Geometry and mesh views, documented inputs, pressure and velocity plots, temperature fields and a consolidated results table
01 / ENGINEERING SCOPE
From the design inputs to a thermal-flow model
The work began by resolving the geometry and operating inputs for a natural-gas heater. We defined the wetted flow passages, the heated tube region and the thermal assumptions, then assessed the internal flow and energy transfer together

Step 01: Input review
Geometry, tube sizes and operating conditions

Step 02: Model development
Fluid domain, wall treatment and mesh

Step 03: CFD assessment
Pressure, velocity and temperature fields

Step 04: Performance review
Outlet condition, pressure loss and heat duty
02 / GEOMETRY & FLOW PATH
Retaining the header, tubes and return bends
The geometry represents a divided header connected to a bundle of U-shaped flow passages. Gas enters one header region, travels through the heated tubes, turns through the return bends and collects in the outlet region
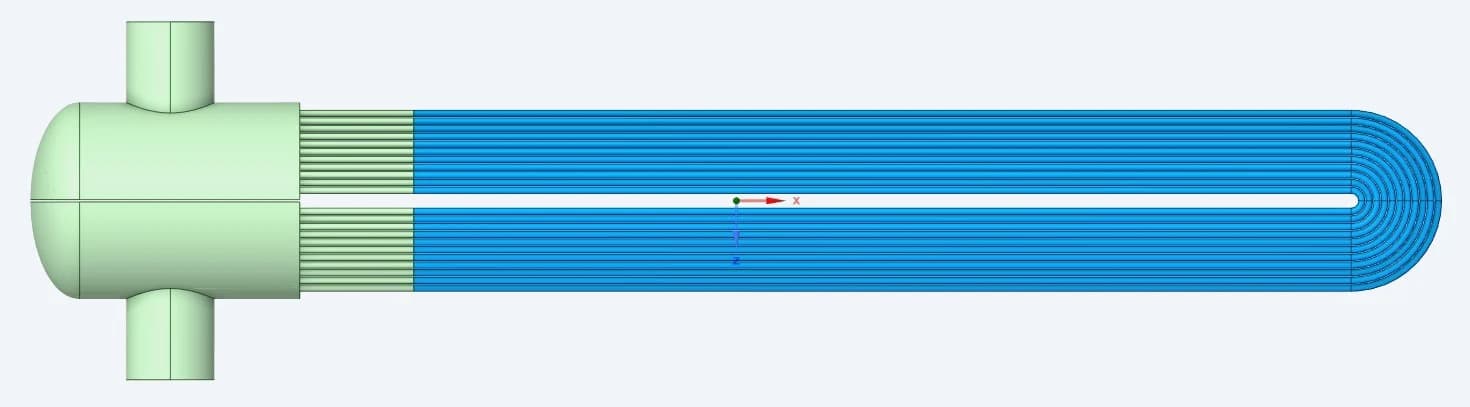
Original fluid-domain model: header at left, straight tube passes and U-bends at right
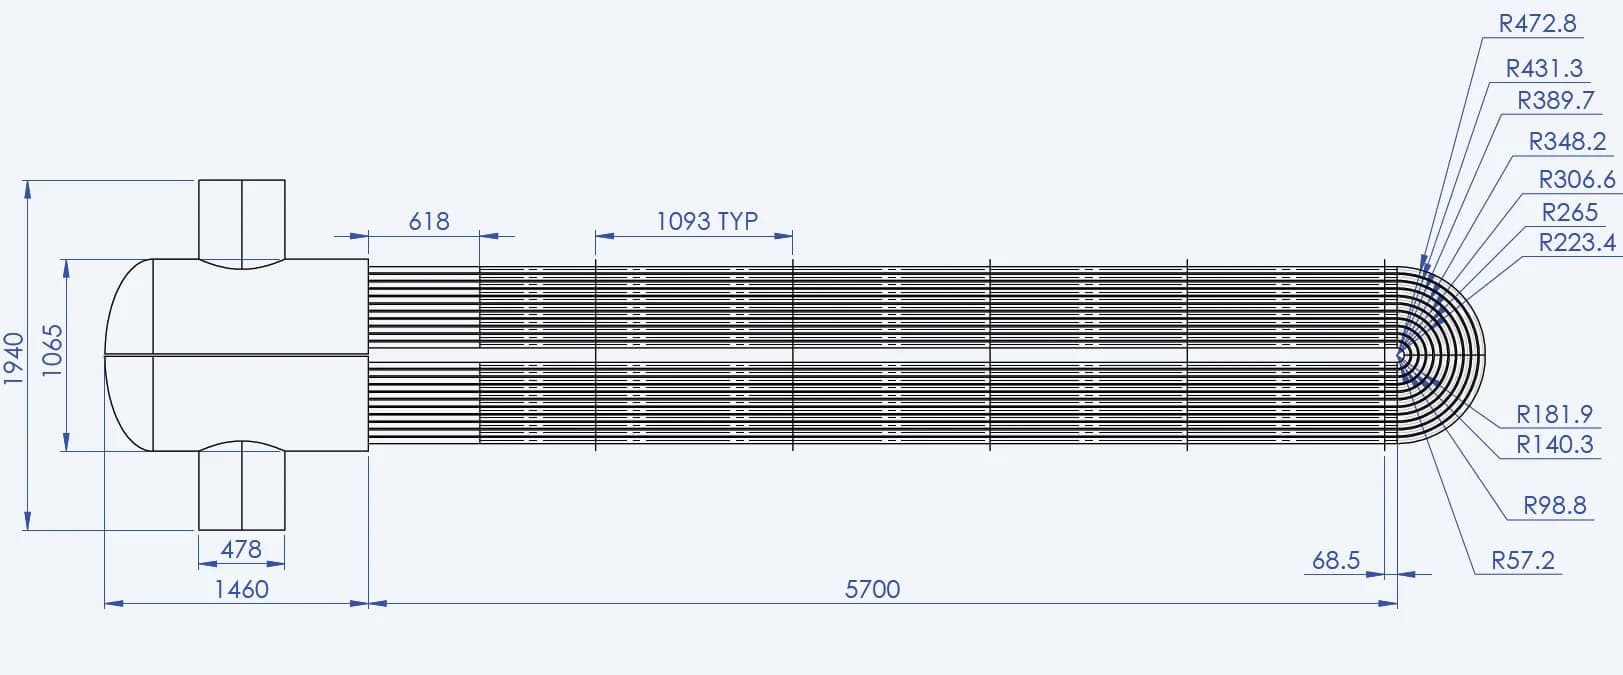
Geometry clarification
The working geometry identifies the straight lengths, header transition and return-bend radii used to define the flow domain
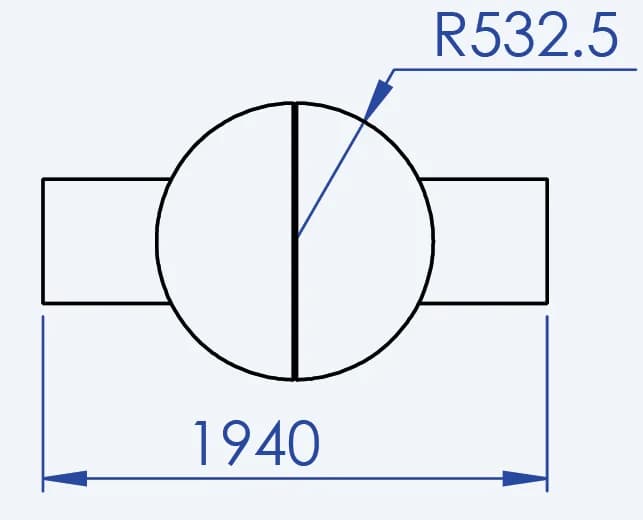
Wetted passage dimensions
The clarified tube size is 38.1 mm outside diameter with a 2.11 mm wall, giving a 33.88 mm internal flow diameter
03 / OPERATING CONDITIONS
A defined gas flow and heating boundary
| INPUT | REPORTED VALUE | ROLE IN THE ASSESSMENT |
|---|---|---|
| Natural-gas mass flow | 87.84 kg/s | Equivalent to 316,228 kg/h |
| Inlet temperature | 15 °C | Starting thermal condition |
| Inlet pressure basis | 34 bar(g) | Reported operating pressure |
| Tank-contact region | 120 °C | Specified heating temperature |
| Outlet condition | 0 Pa reference | Reported outlet boundary value |
The outlet value is the report’s pressure reference. The 0.42 bar result below describes the reported inlet-to-outlet pressure difference
04 / THERMAL INPUTS
Representing gas properties, tube material and fouling
The final model uses temperature-dependent natural-gas properties. This captures the changing density and transport properties as the gas heats. The thermal inputs also include the tube material and a specified fouling resistance
| NATURAL GAS PROPERTY | At 15 °C | At 75 °C |
|---|---|---|
| Density / kg/m³ | 30.3114 | 23.7544 |
| Dynamic viscosity / kg/(m·s) | 0.0000111 | 0.0000129 |
| Specific heat / J/(kg·K) | 2339.8 | 2369.3 |
| Thermal conductivity / W/(m·K) | 0.0368 | 0.0450 |
SA210 Gr.A-1
Reported tube material
52 W/(m·K)
Solid thermal conductivity
0.00018 m²·K/W
Fouling resistance
During input clarification, the work also addressed the tube wall’s thermal representation and regions treated as adiabatic. These decisions define where heat enters the gas and how the wall and fouling affect that transfer
05 / MESH DEVELOPMENT
Resolving small passages within the full assembly
The mesh follows the complete gas path and the local transitions at the header, tube entries and U-bends. The reported surface, volume and near-wall views show how the domain was discretised for the flow and thermal assessment
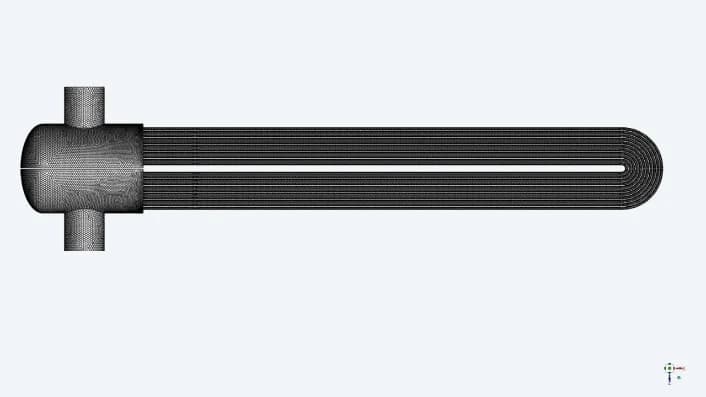
Complete surface mesh
A full-domain view preserves the header-to-bundle connection and the repeated tube passages
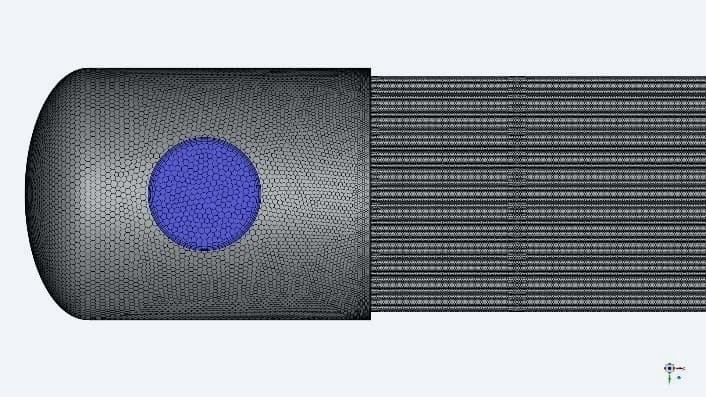
Header and tube entries
Local detail captures the entrance geometry where gas distributes from the header into the tubes
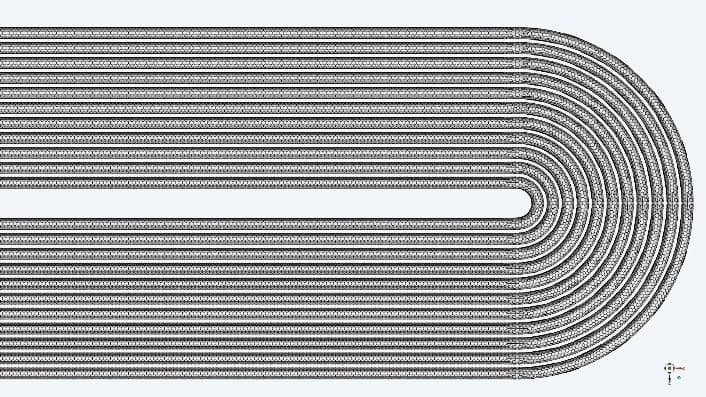
Return-bend region
The mesh follows the nested U-bends, where the flow changes direction between the two passes

Volume discretisation
The section view shows the connected fluid mesh through the header and tube bundle

Near-wall header layers
Layers beside the wall resolve the region where velocity and temperature gradients develop
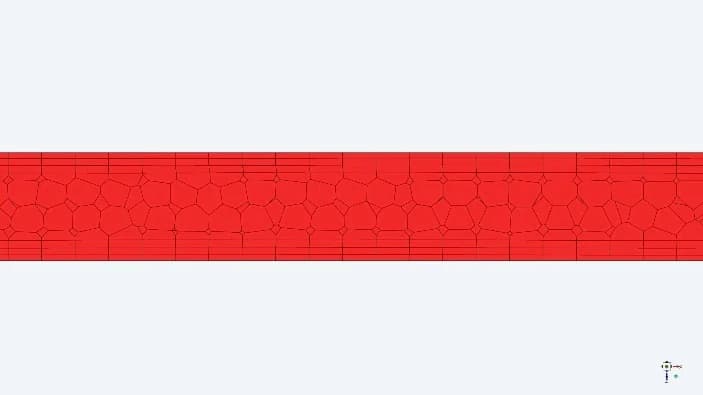
Inside a single tube
The detailed view shows the core cells and near-wall layers within an individual flow passage
06 / RESULT EXTRACTION
A common plane through the flow circuit
A longitudinal plane cuts through the header and the U-tube passes. Reviewing pressure, velocity and temperature on this same plane connects the flow path with the observed hydraulic and thermal behaviour
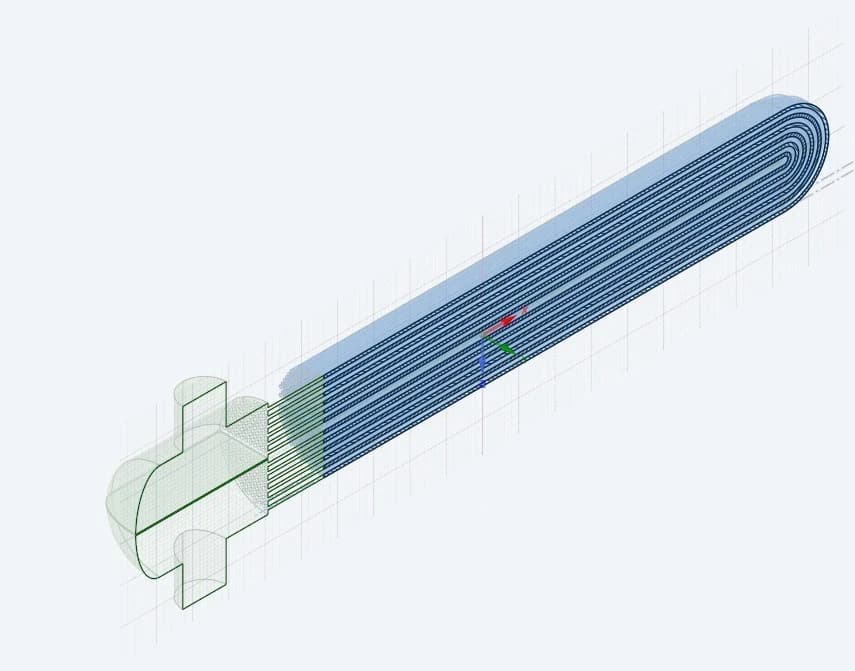
Plane position in the model
The original view locates the evaluation plane within the three-dimensional tube-bundle domain

Header-to-return section
The extracted section exposes both passes and the return bends for a consistent comparison of the result fields.
07 / PRESSURE RESULTS
Following the pressure change through the exchanger
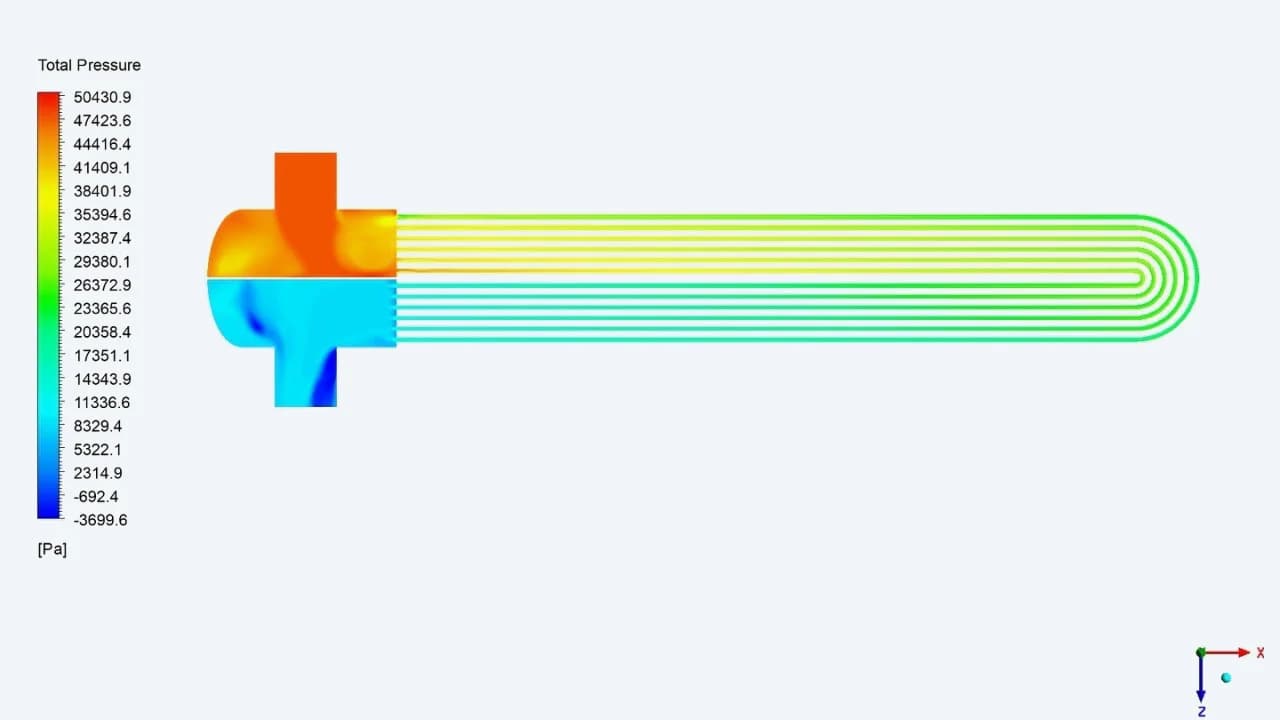
Total pressure across the flow path
The full contour traces the pressure field through the inlet header, tubes, return bends and outlet header
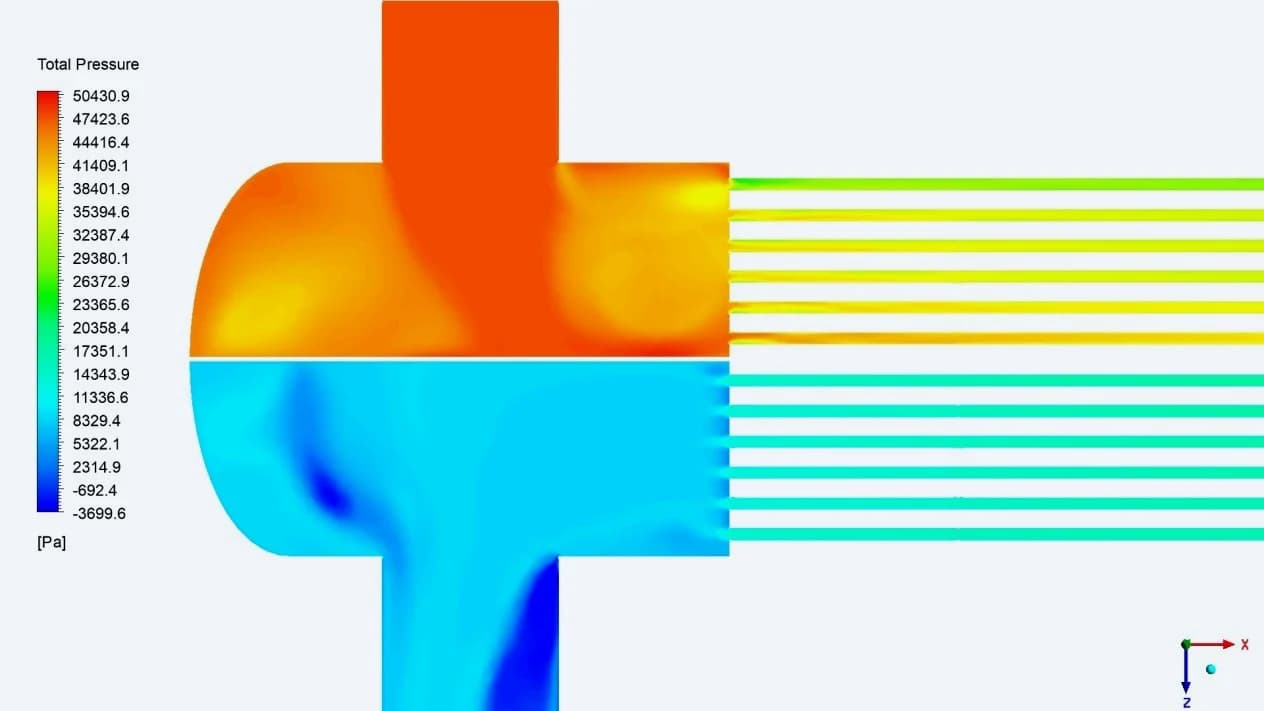
Header transition in detail
The close view isolates the pressure variation near the inlet and outlet connections and the tube-entry region
0.42 bar
Reported inlet-to-outlet pressure difference for the simulated operating condition
08 / FLOW DISTRIBUTION
How the gas enters, turns and leaves the bundle
Velocity contours and vectors show how the gas redistributes at the header and accelerates into the tube passages. The local views make the turning flow and the non-uniform velocity in the outlet region visible
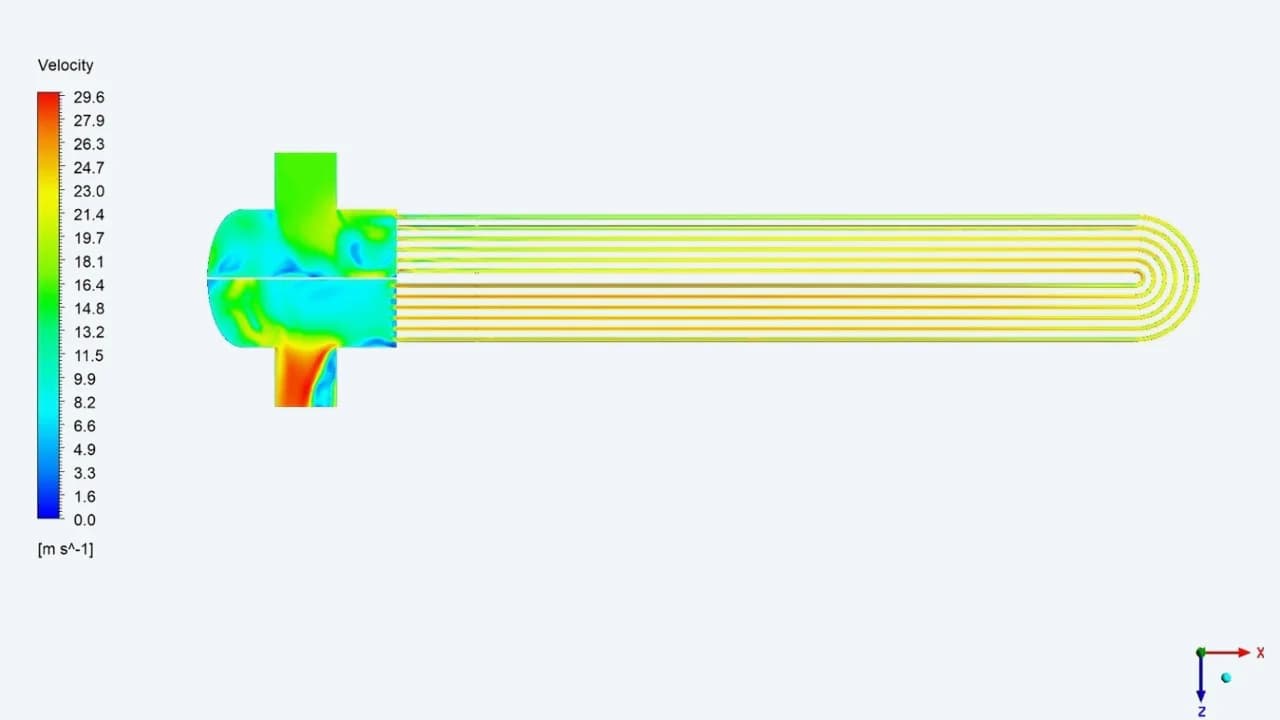
Velocity along the bundle
The contour shows the spatial variation in speed through the tube passes and their connection to the header
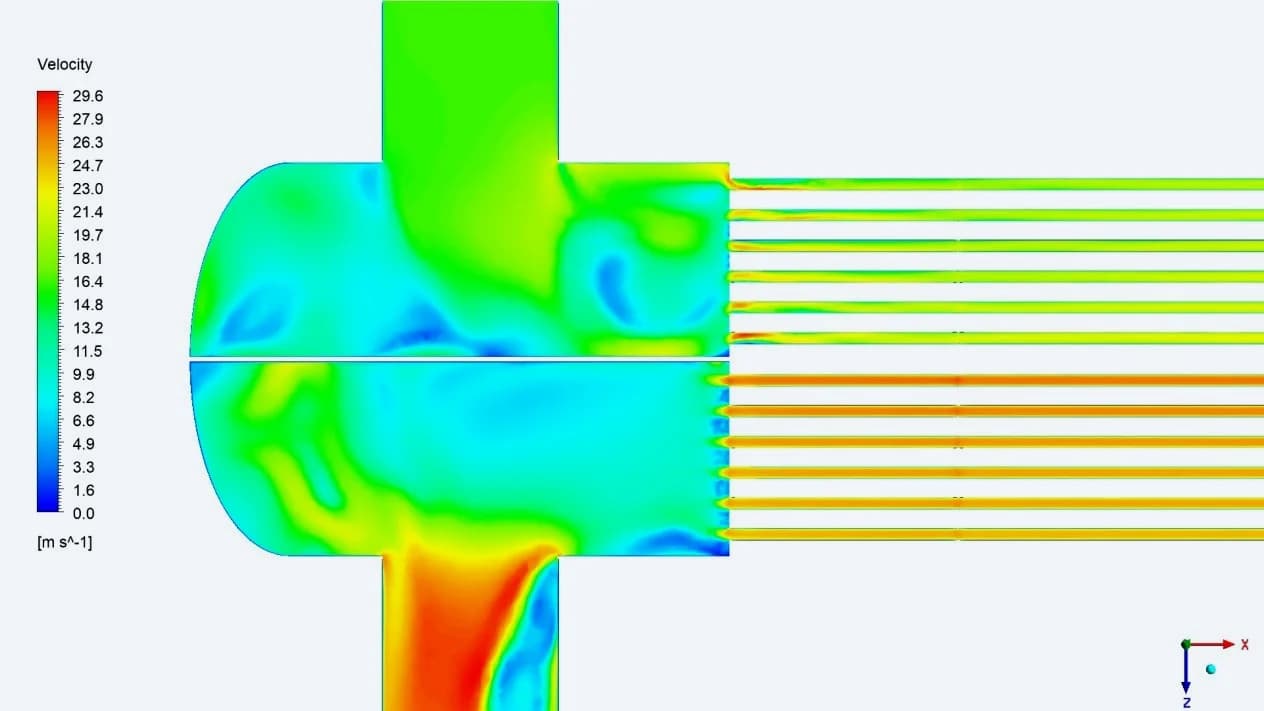
Local header velocity
The close view reveals higher- and lower-speed regions around the inlet, outlet and tube junctions
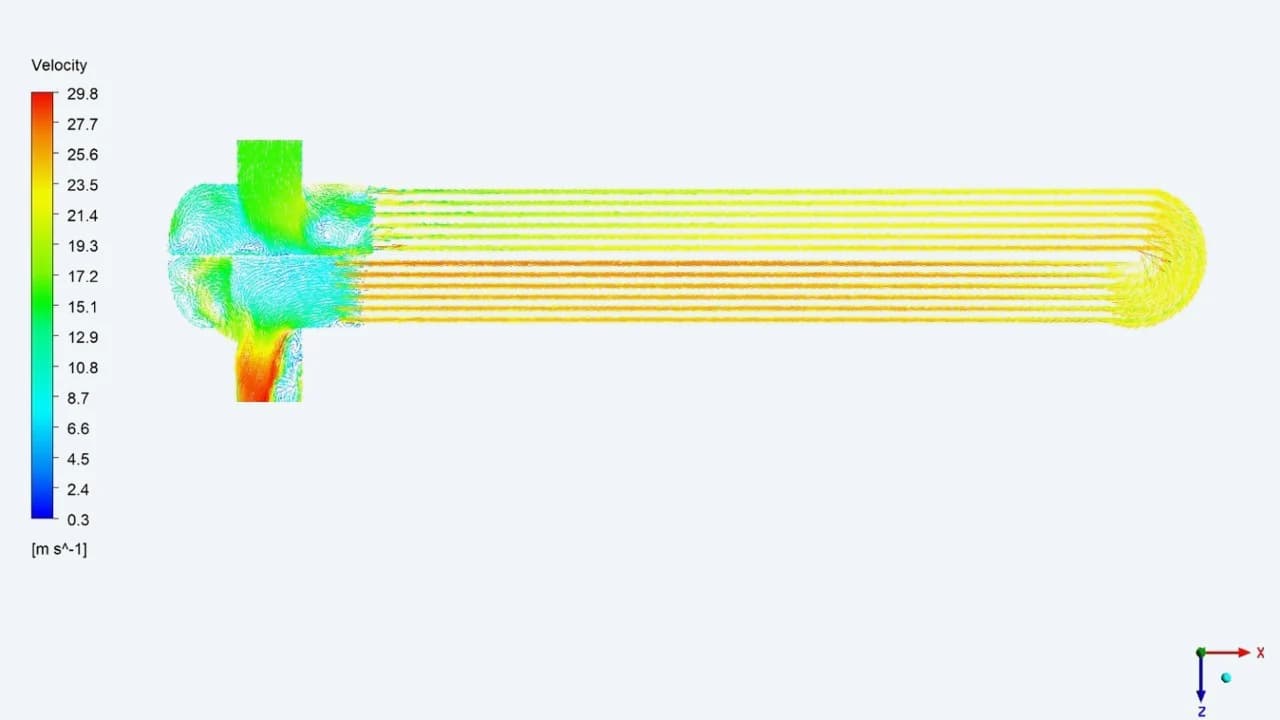
Direction through both passes
Vectors follow the flow through the bundle and around the U-bends, connecting the inlet and outlet regions
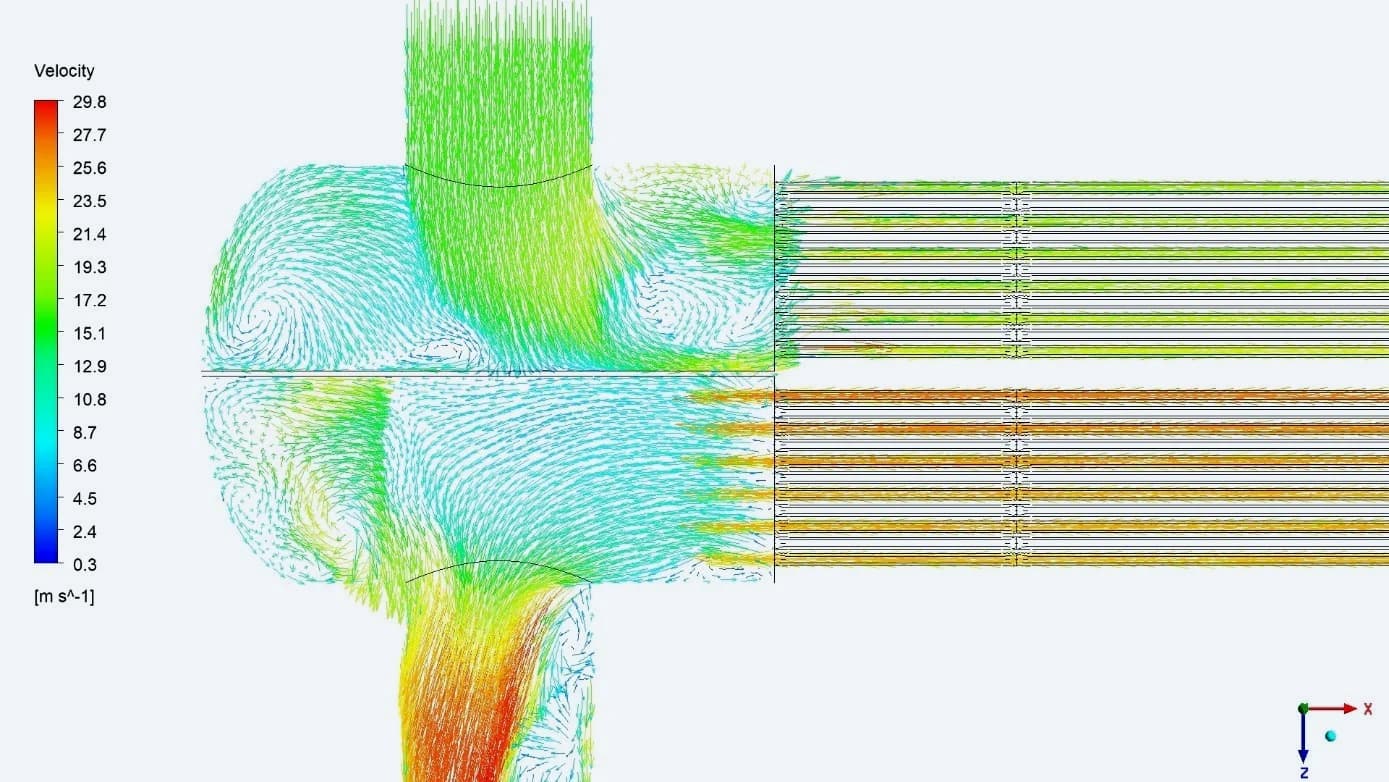
Turning and redistribution
The header vector view shows directional changes and local circulation as the gas enters and collects from the tubes
09 / TEMPERATURE RESULTS
Heating the gas along the tube passes
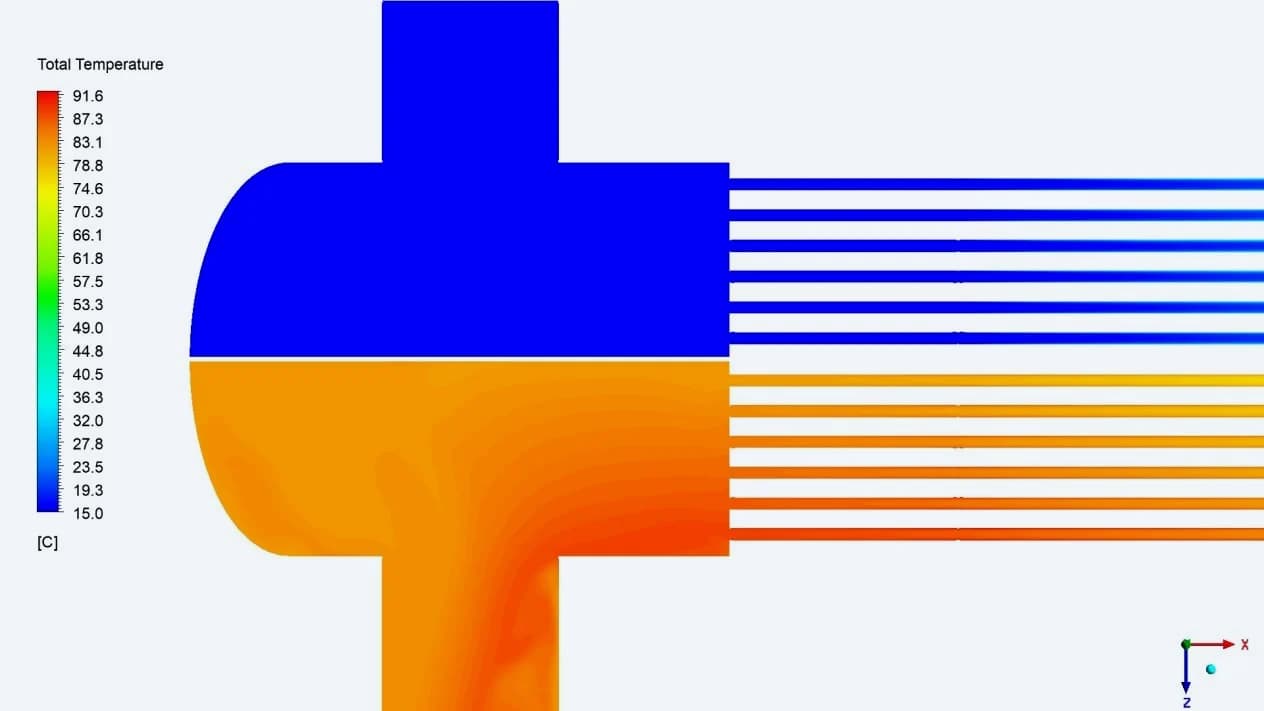
The temperature field shows cooler gas entering the first pass and warming along the heated flow path. The warmer return pass discharges into the outlet region. These views connect the heat-transfer boundary with the resulting gas temperature
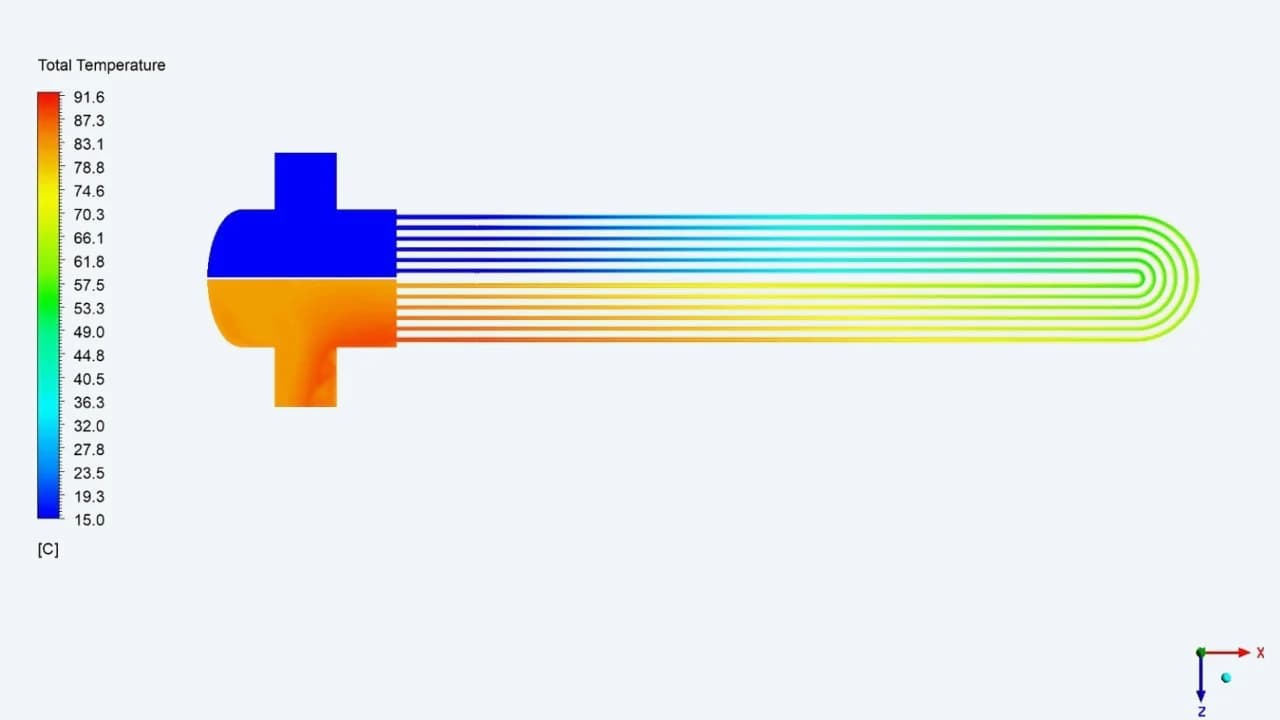
Temperature through the circuit
The original total-temperature contour shows the progression from the inlet through the U-bend to the warmer return pass
Inlet and outlet regions
The divided header brings the cooler inlet and warmer outlet regions into one view while retaining their separate flow paths
10 / OUTLET PROFILES
Checking the distribution behind the average
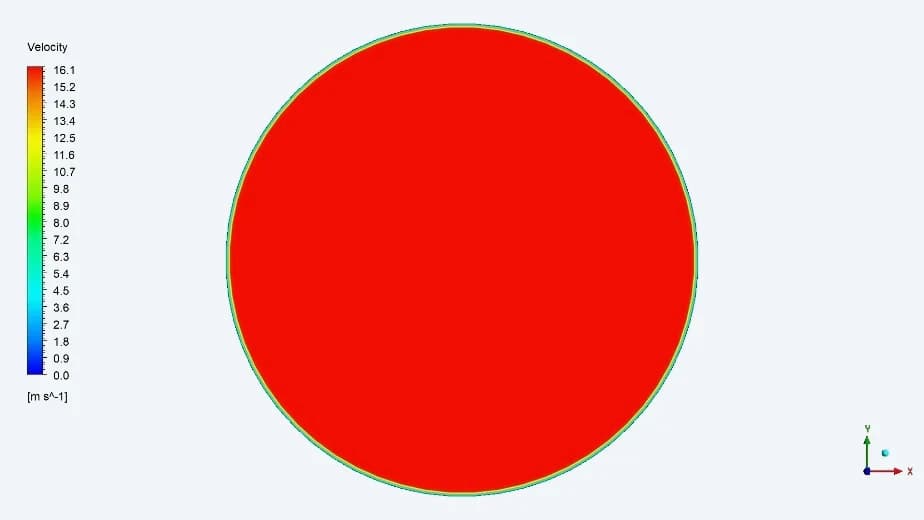
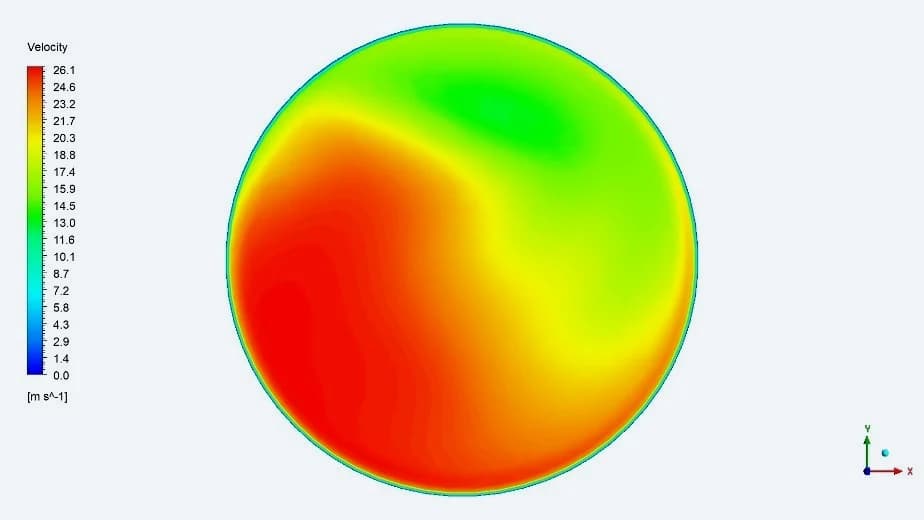
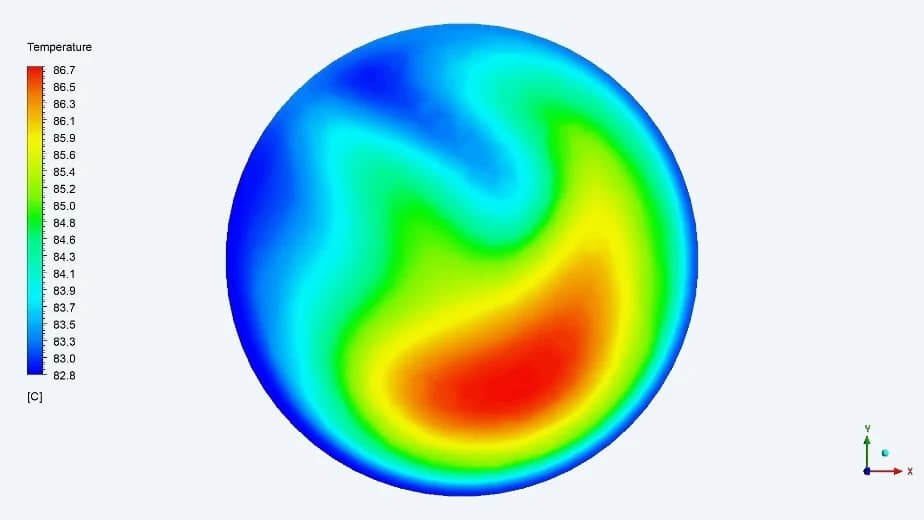
The outlet is described by a spatial profile as well as a single reported average. Face contours show the remaining variation in velocity and temperature after the gas passes through the bundle and outlet header
Inlet velocity
The inlet face shows the imposed inflow profile. The result summary lists an inlet velocity of 16.22 m/s
Outlet velocity
The outlet face shows a non-uniform distribution after the gas collects from the return tubes
Outlet temperature
The temperature profile retains spatial variation. The report gives an average outlet temperature of 84.58 °C
11 / PERFORMANCE & OUTCOME
A quantified operating point for design review
| NATURAL GAS PROPERTY | At 15 °C |
|---|---|
| Density / kg/m³ | 30.3114 |
| Dynamic viscosity / kg/(m·s) | 0.0000111 |
| Specific heat / J/(kg·K) | 2339.8 |
| Thermal conductivity / W/(m·K) | 0.0368 |
Results from the final report for the specified operating condition. These are simulation predictions; no physical test comparison is included in the supplied material
Thermal duty and pressure loss in one assessment
The work established the predicted heating performance of the submerged tube bundle and the associated hydraulic loss. The reported gas temperature rose from 15 °C to 84.58 °C, with a heat-transfer rate of 14.37 MW and a pressure difference of 0.42 bar The engineering package linked these performance figures to the original geometry, mesh, operating inputs and local flow fields, giving the design team a documented basis for reviewing the exchanger at the assessed condition