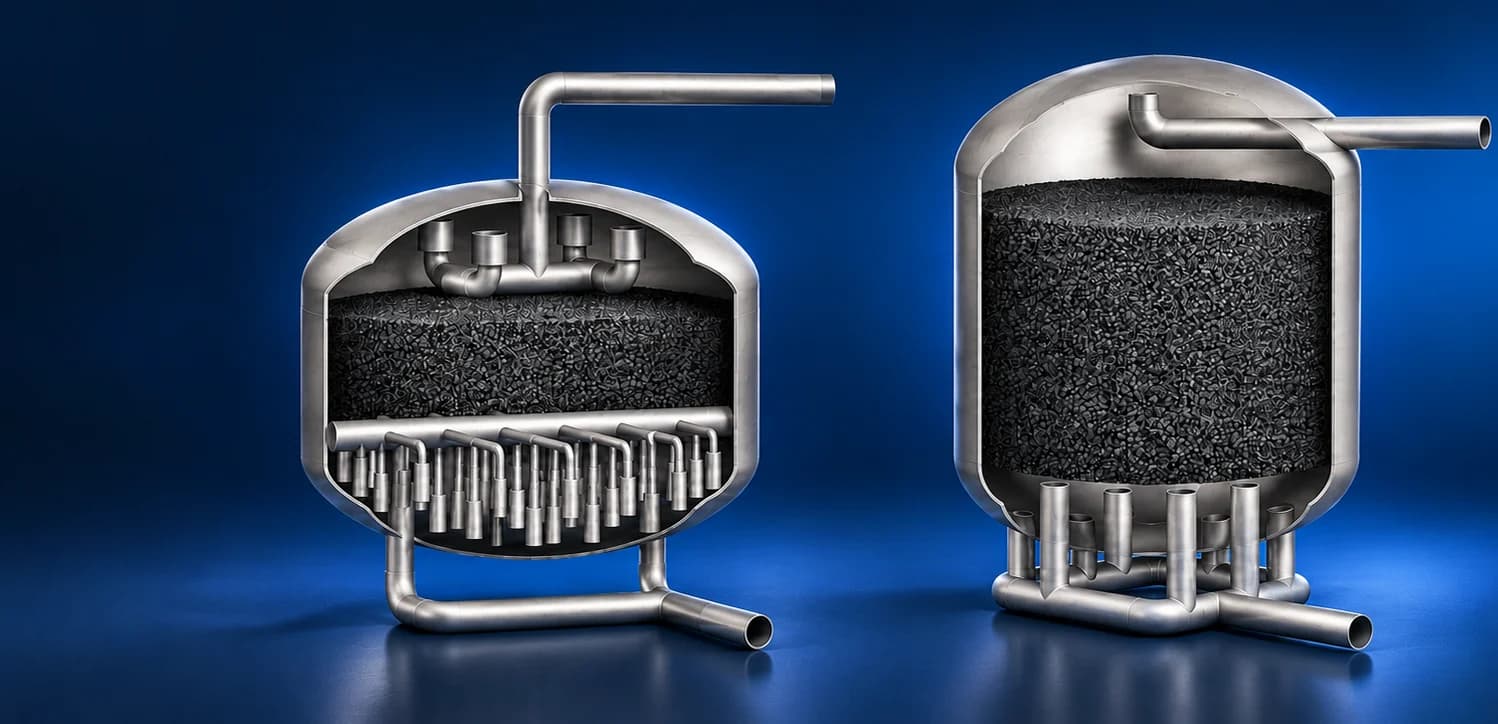
Filtration Tank
Understanding the Flow distribution in CSI and SEPTA assemblies
CYPRESS ROCK SOLUTIONS / CFD
Filtration Tank
- Requirement
Compare the two filtration layouts
Support 15 photovoltaic modules for a solar pumping application, with manual rotation and tilt adjustment built into a structure that can be fabricated and assembled on site
- Challenge
Reveal uneven use of the bed
Carry the module load through bolted purlins, rafters and bracing into a single post, while accommodating the rotating bearing, adjustable connections and wind loading
- Deliverables
A detailed hydraulic comparison
Product CAD, detailed assembly drawings, bills of materials and installation records, supported by CFD wind-load evaluation and structural FEA
- CSI and SEPTA configurations
- 2 tank layouts
- Specified flow for both cases
- 1,000 GPM
- Five bed sections and the outlets
- 6 comparison levels
THE PROJECT PROCESS
An investigation of flow through the complete tank

Step 01: Geometry
Review the tank, inlet distributor and lower collection system

Step 02: Inputs
Establish flow conditions and review screen and bed resistance data

Step 03: Mesh
Discretise the fluid domain and the small manifold features

Step 04: Simulation
Evaluate velocity and total pressure on selected section planes

Step 05: Comparison
Compare bed distribution and outlet behaviour at common relative levels
01 / FLUID-DOMAIN DEFINITION
Two assemblies with different internal arrangements
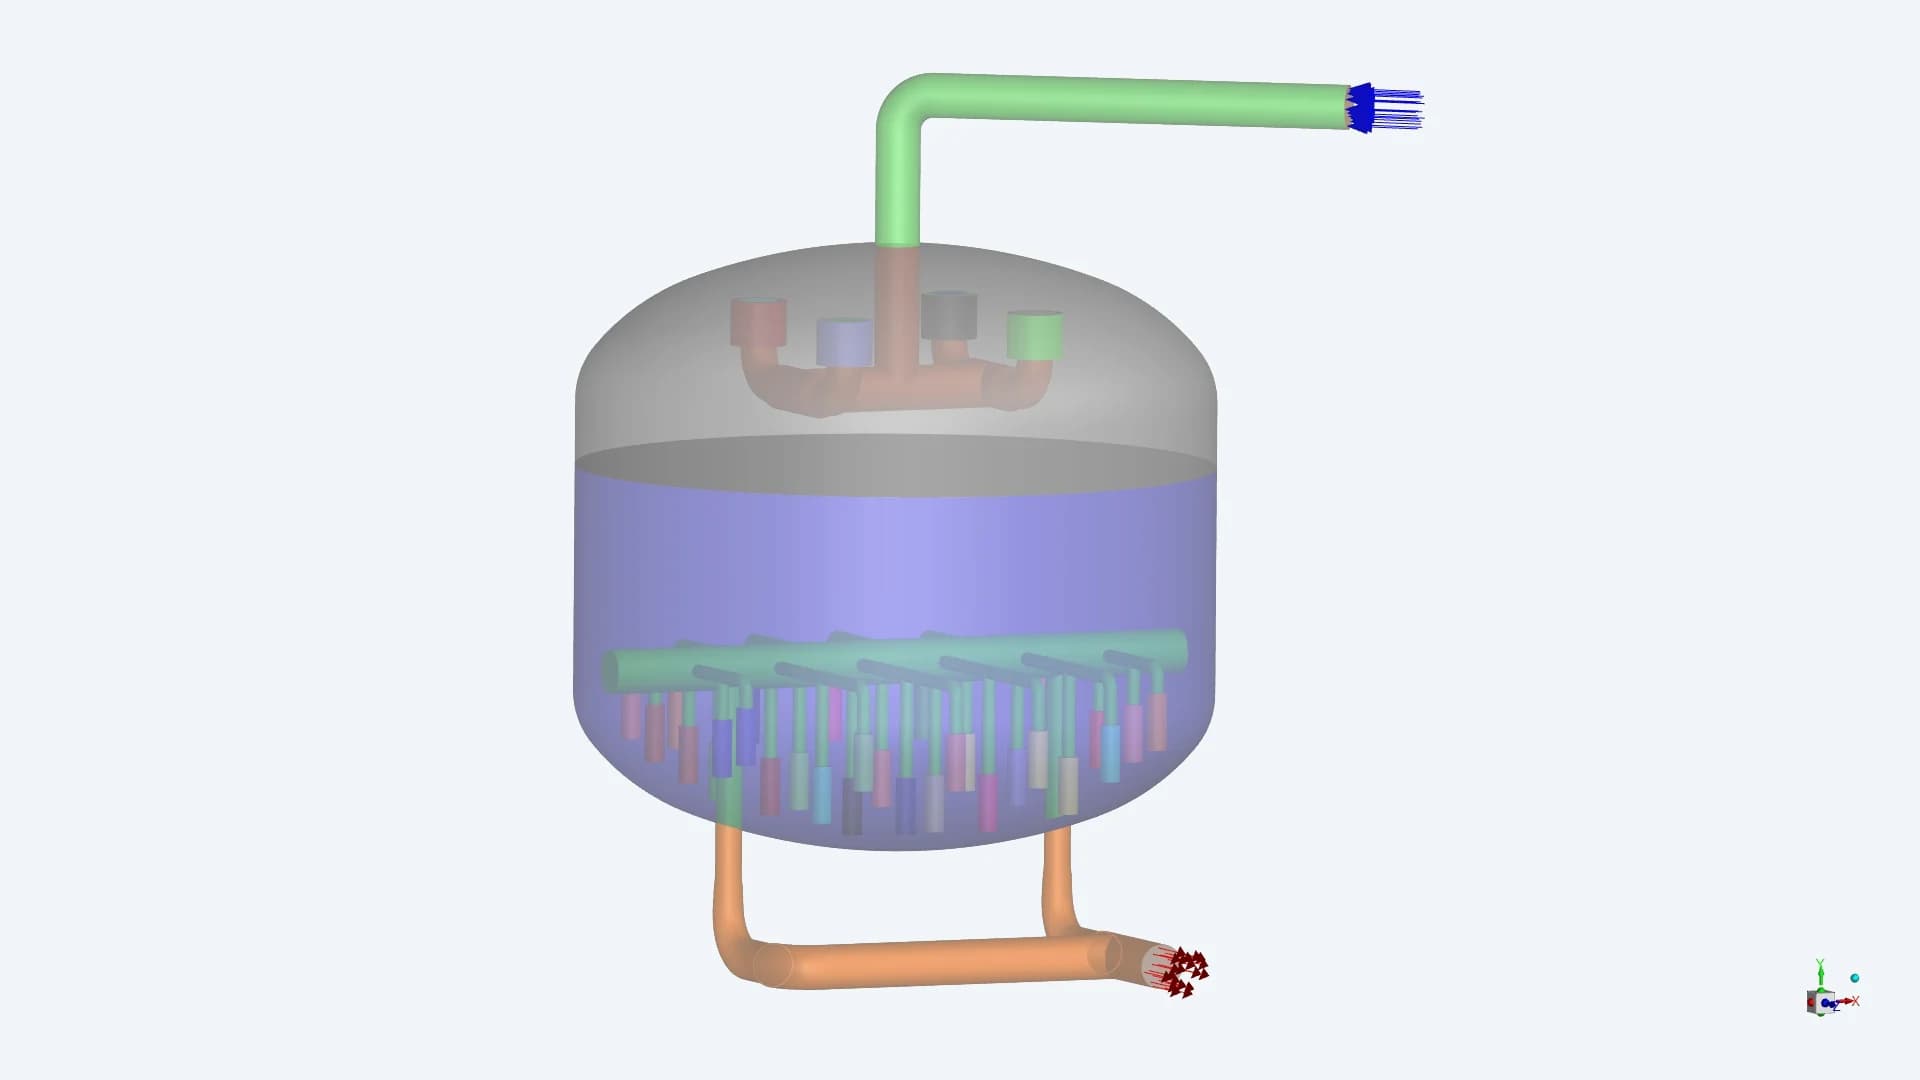
CSI / Distributed internal collection
A top-entry pipe feeds four distributor branches. A network of collector elements in the lower bed connects to two discharge branches
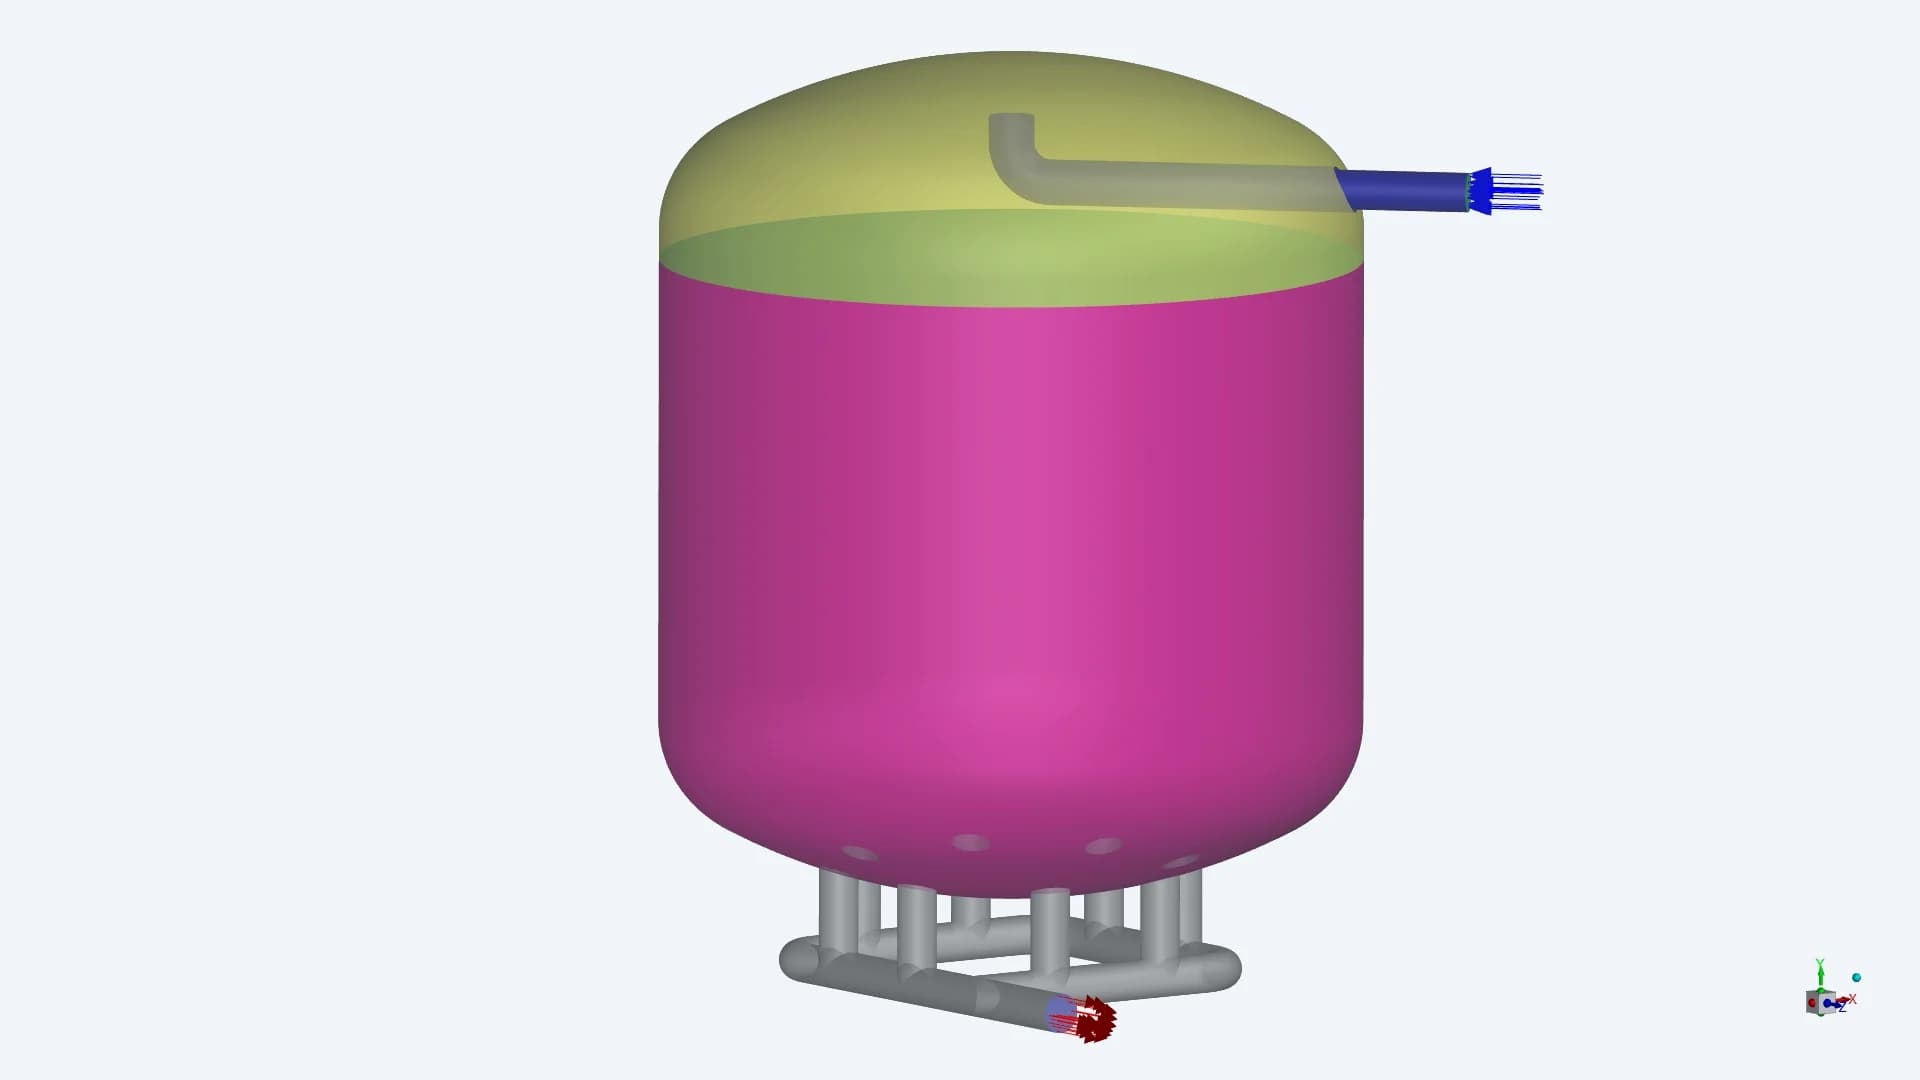
SEPTA / Bottom header collection
A side-entry pipe turns upward near the upper head. Eight bottom connections lead into a common lower header
The reports label the media region “coal bed”. The supplied material reference identifies activated carbon
02 / INLET GEOMETRY
The distributor sets the initial flow pattern
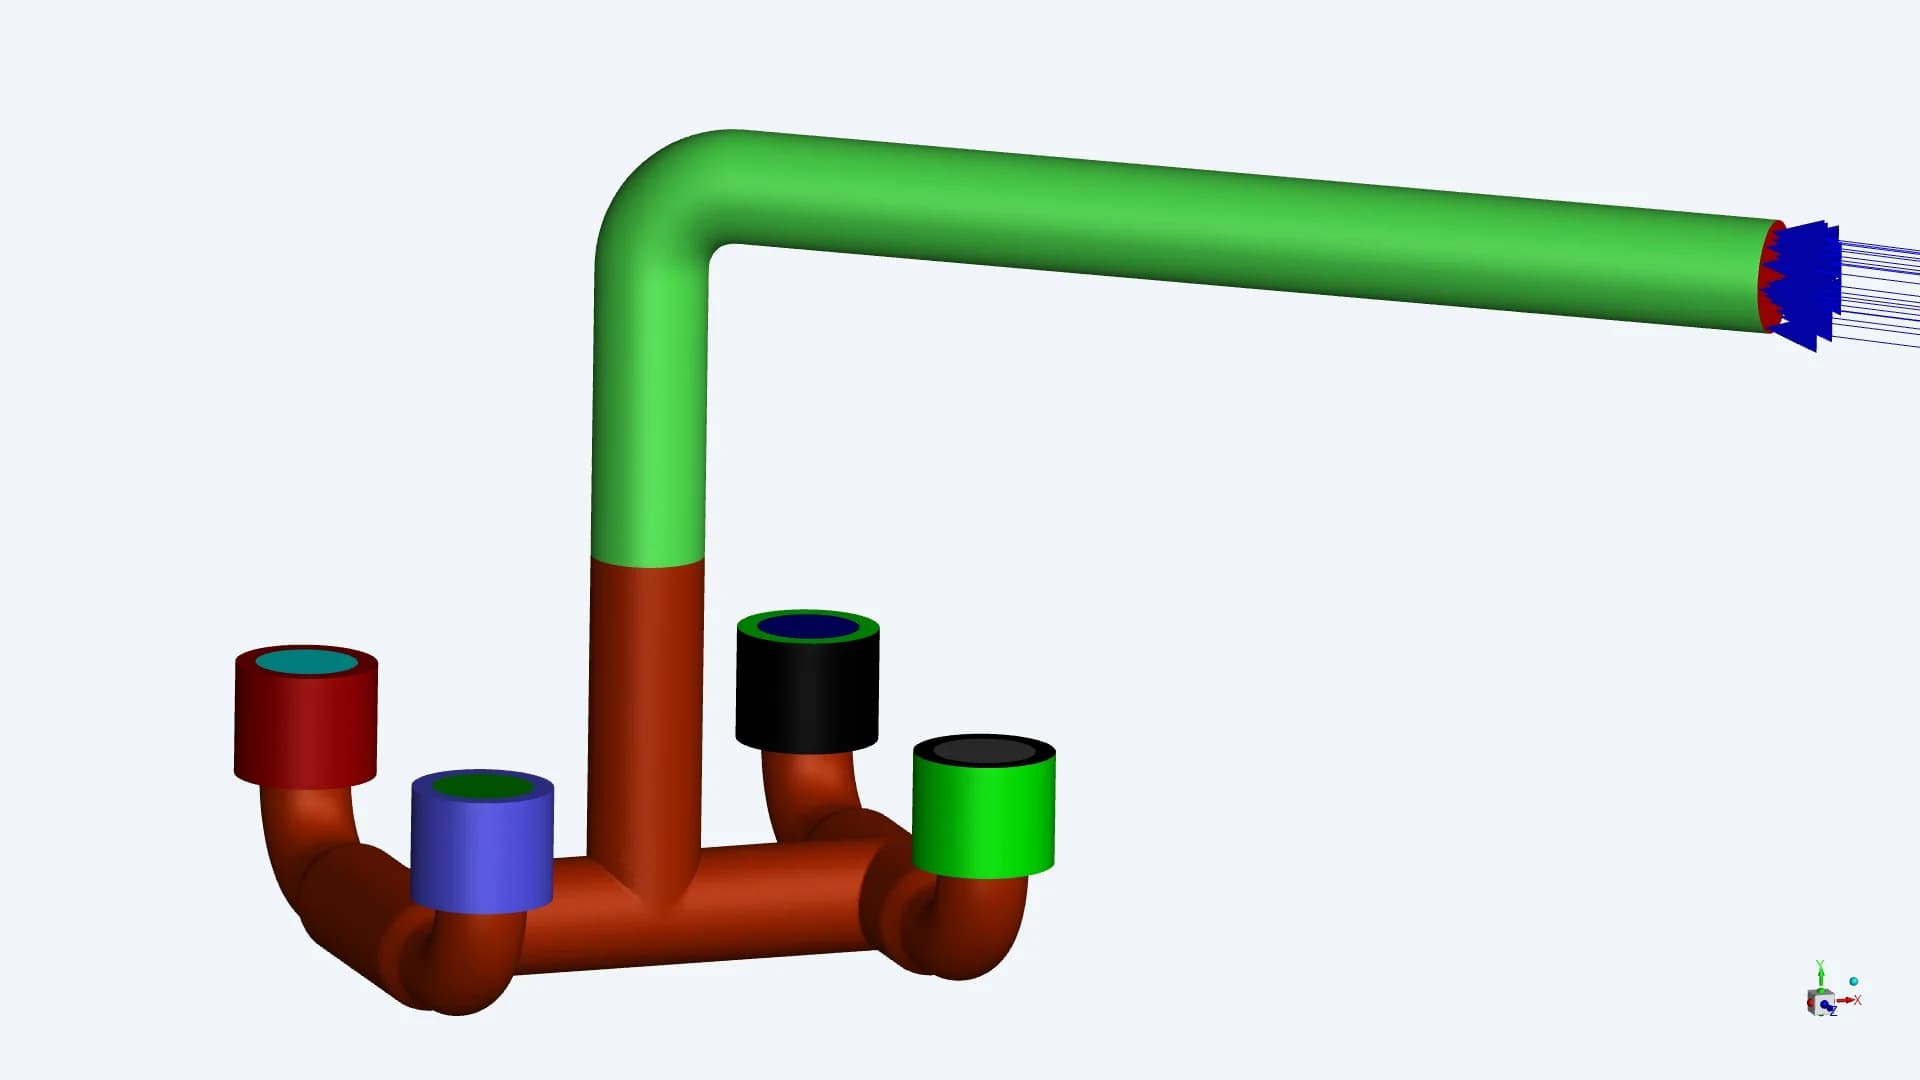
CSI / Four screened branches
The four openings spread the incoming flow. The comparison report includes porous resistance at the CSI inlet manifold
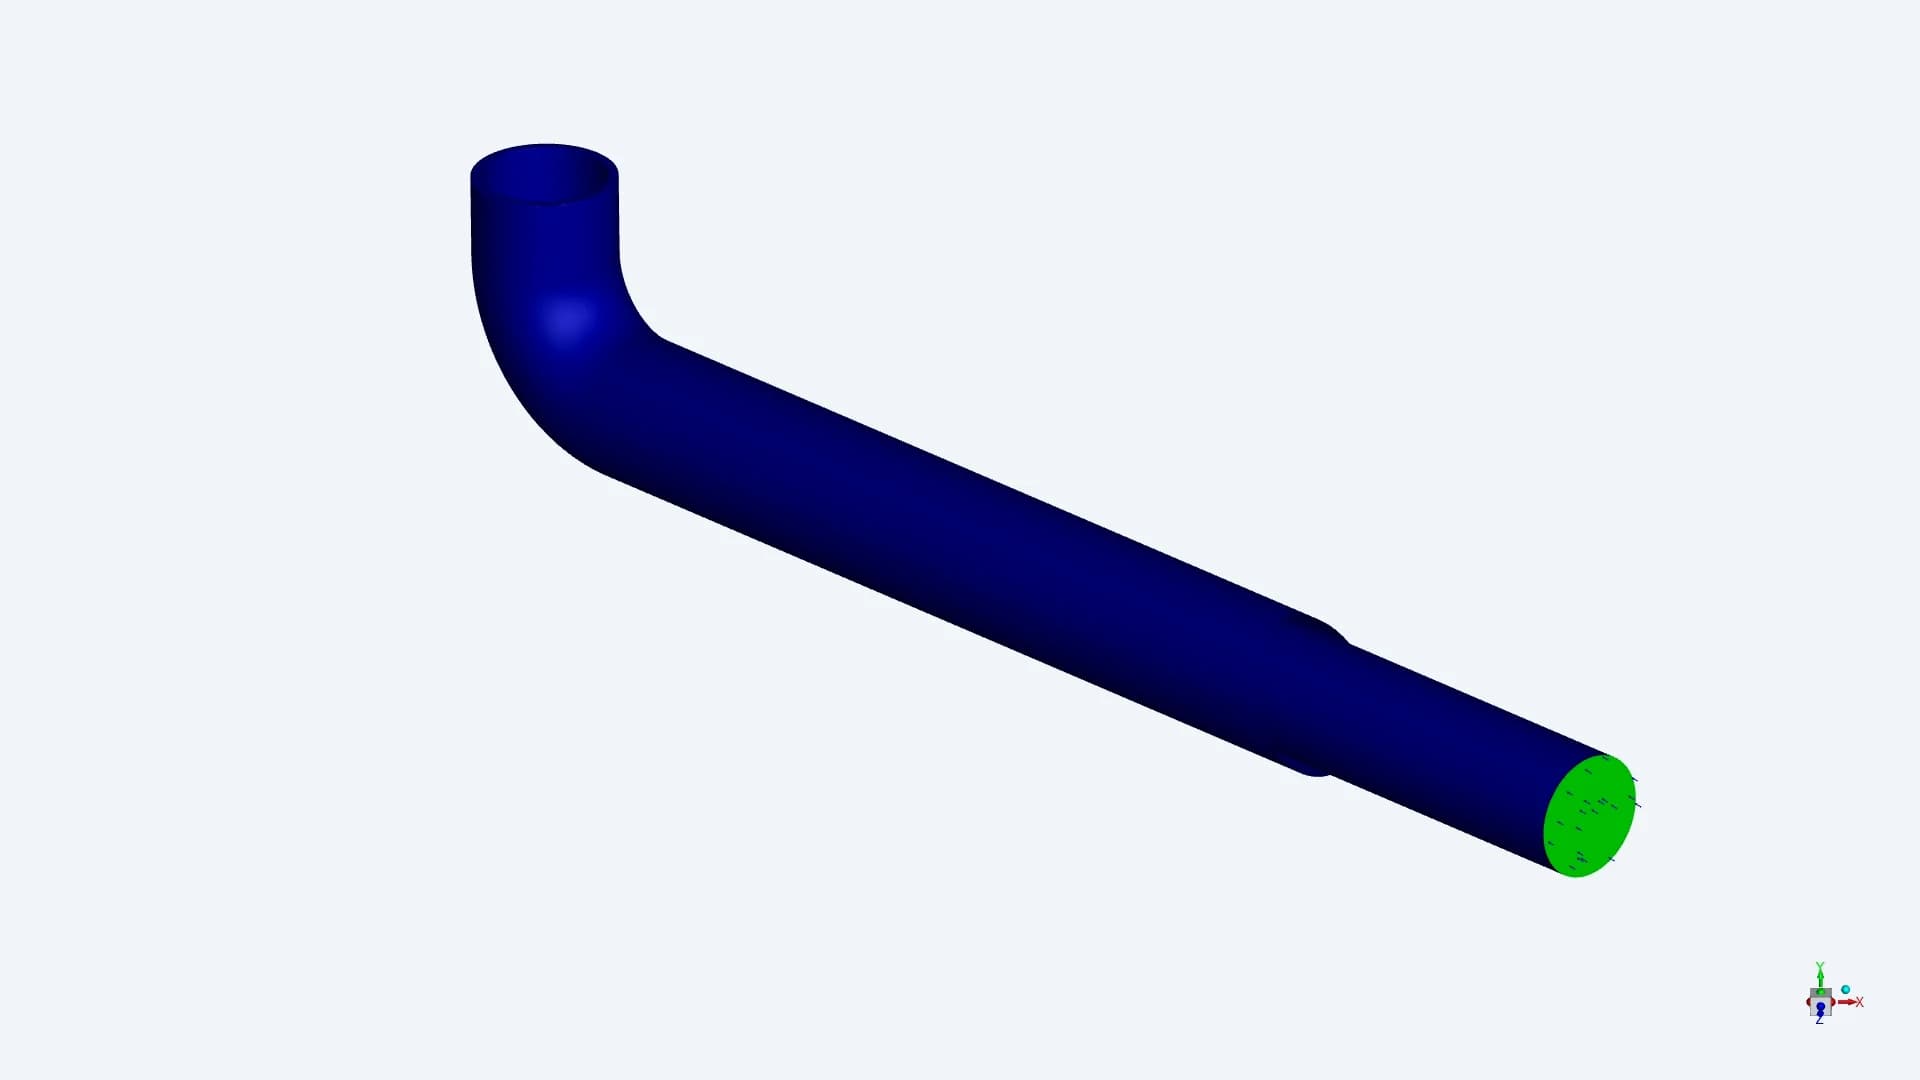
SEPTA / One upward-facing entry
The single pipe directs the incoming stream toward the upper head. The analysis investigates how this flow redistributes before entering the bed
03 / OUTLET GEOMETRY
The collection system shapes the lower-bed flow
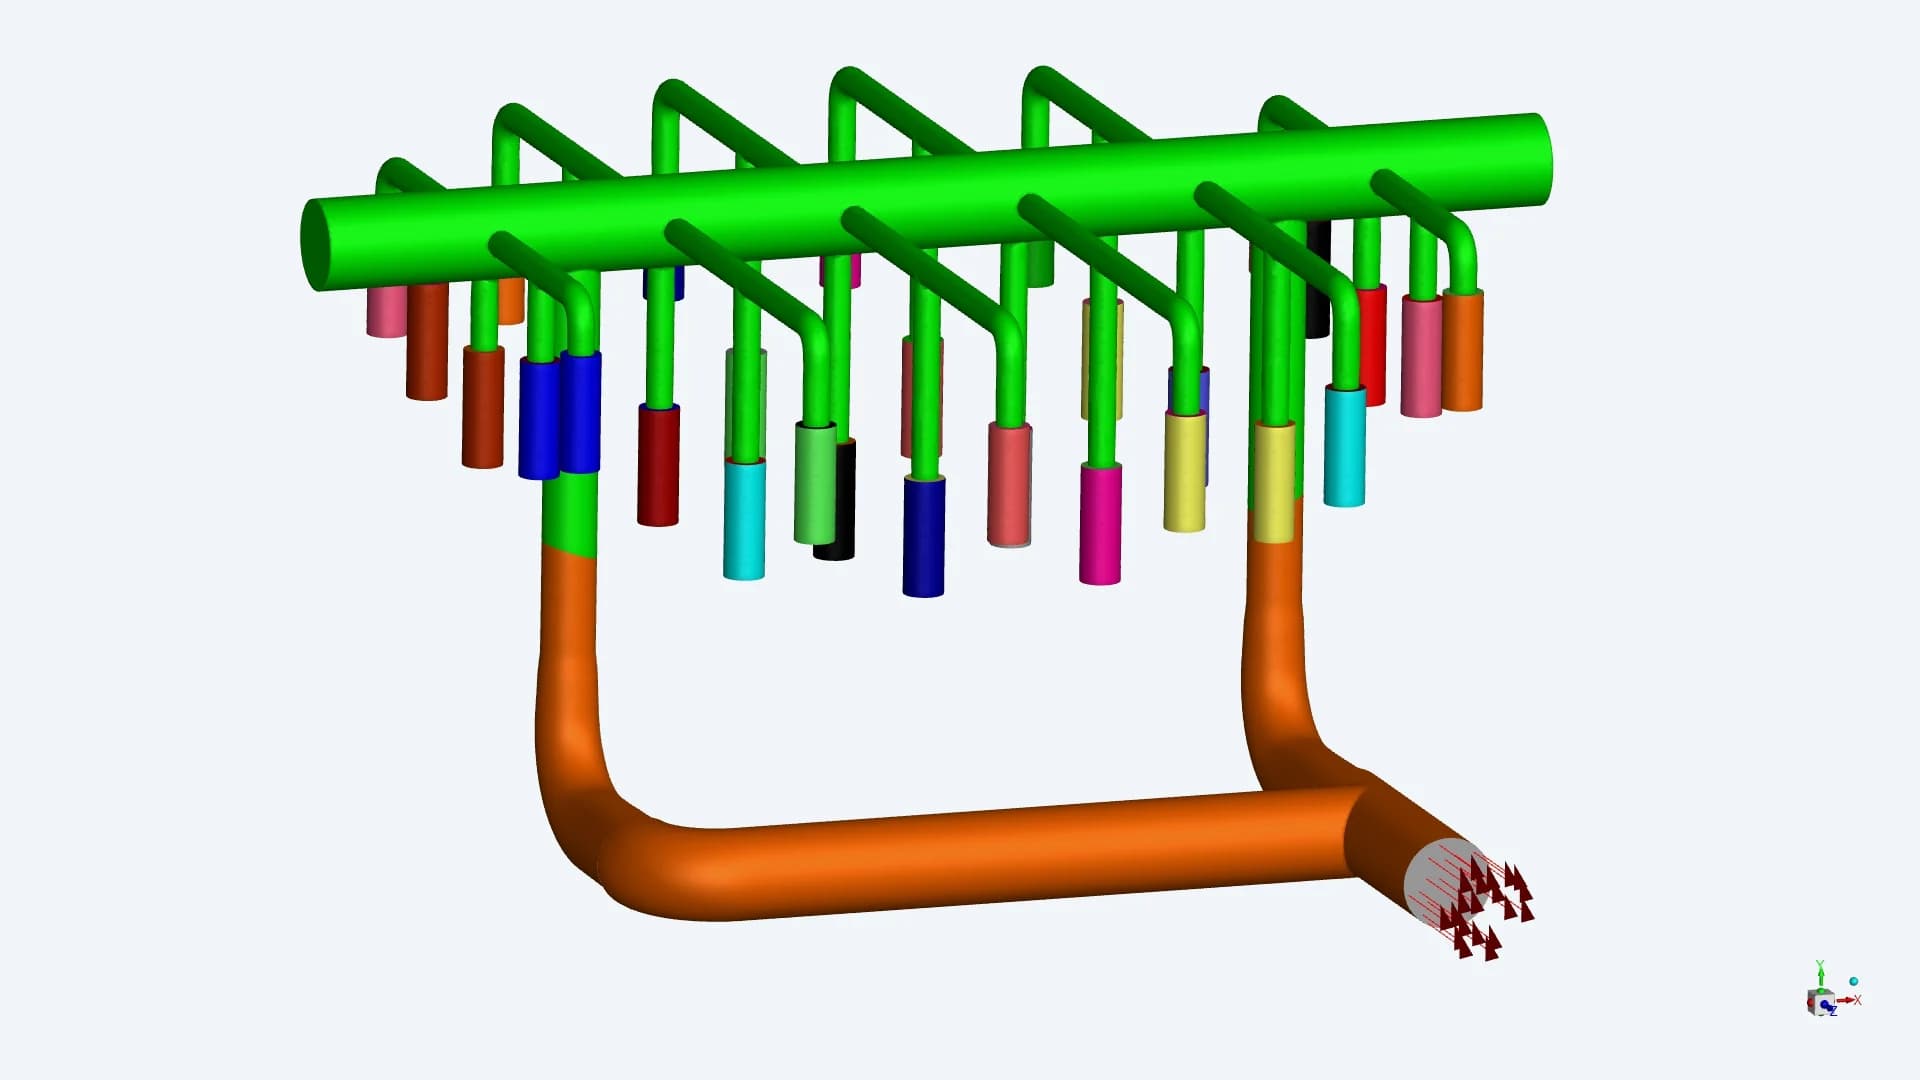
CSI / Distributed collector elements
The many collector elements provide distributed pickup locations within the vessel. Two larger branches carry the combined discharge
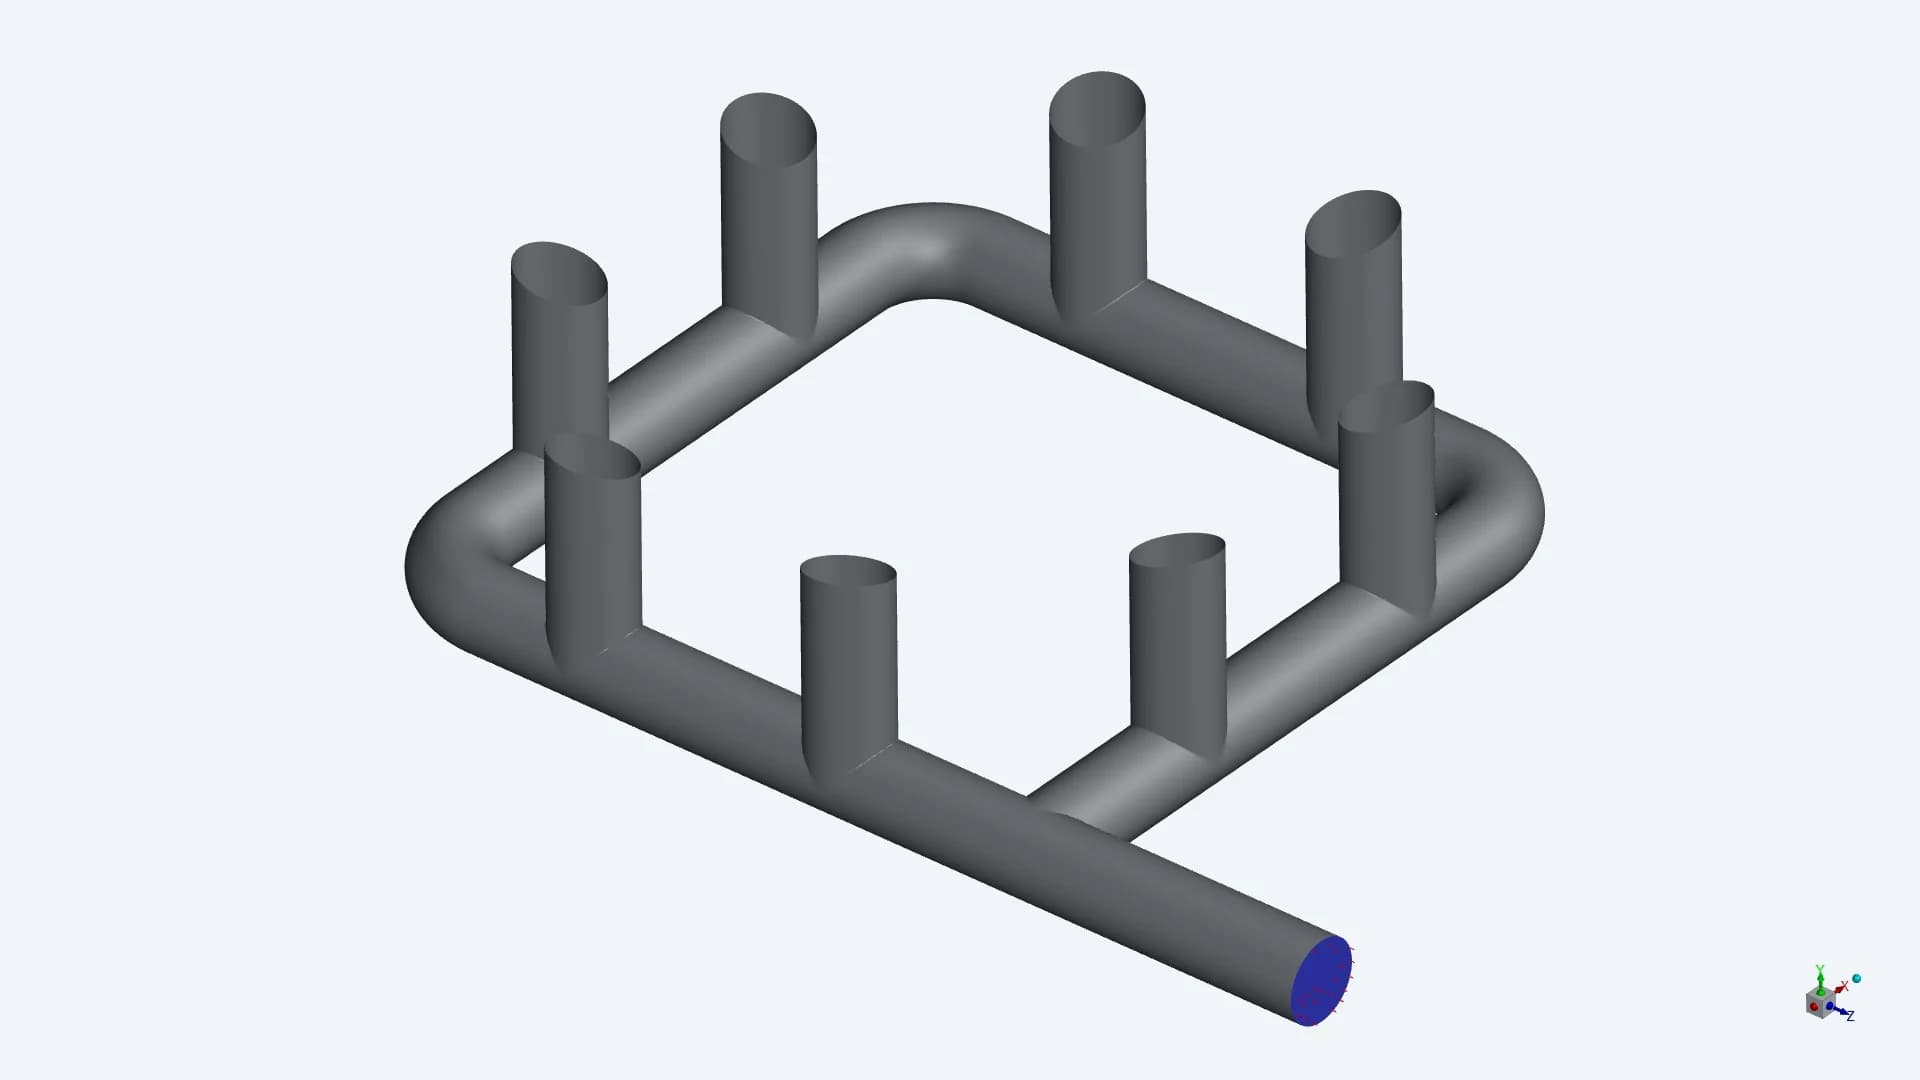
SEPTA / Eight bottom connections
The bottom connections feed a looped header. Their position relative to the inlet-side flow becomes important in the outlet comparison
04 / PRE-PROCESSING
Surface and volume meshes around the internals
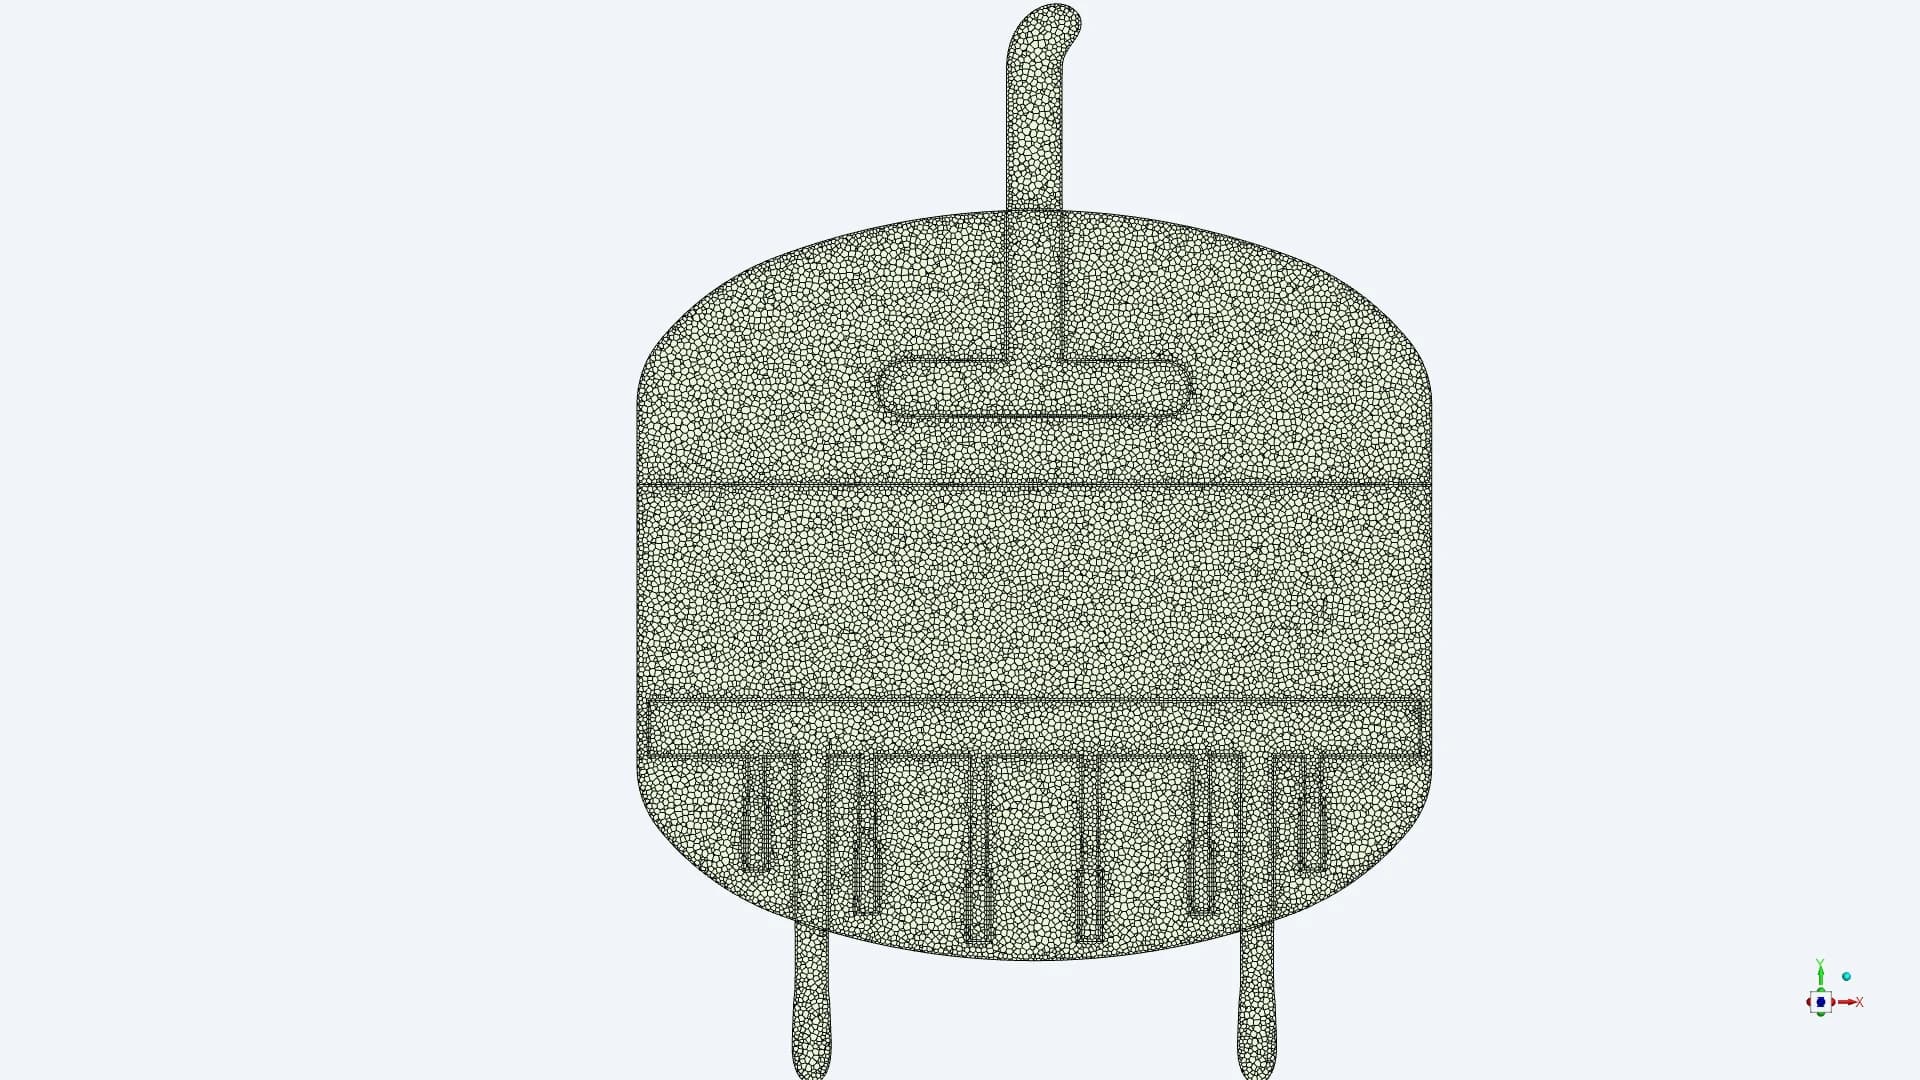
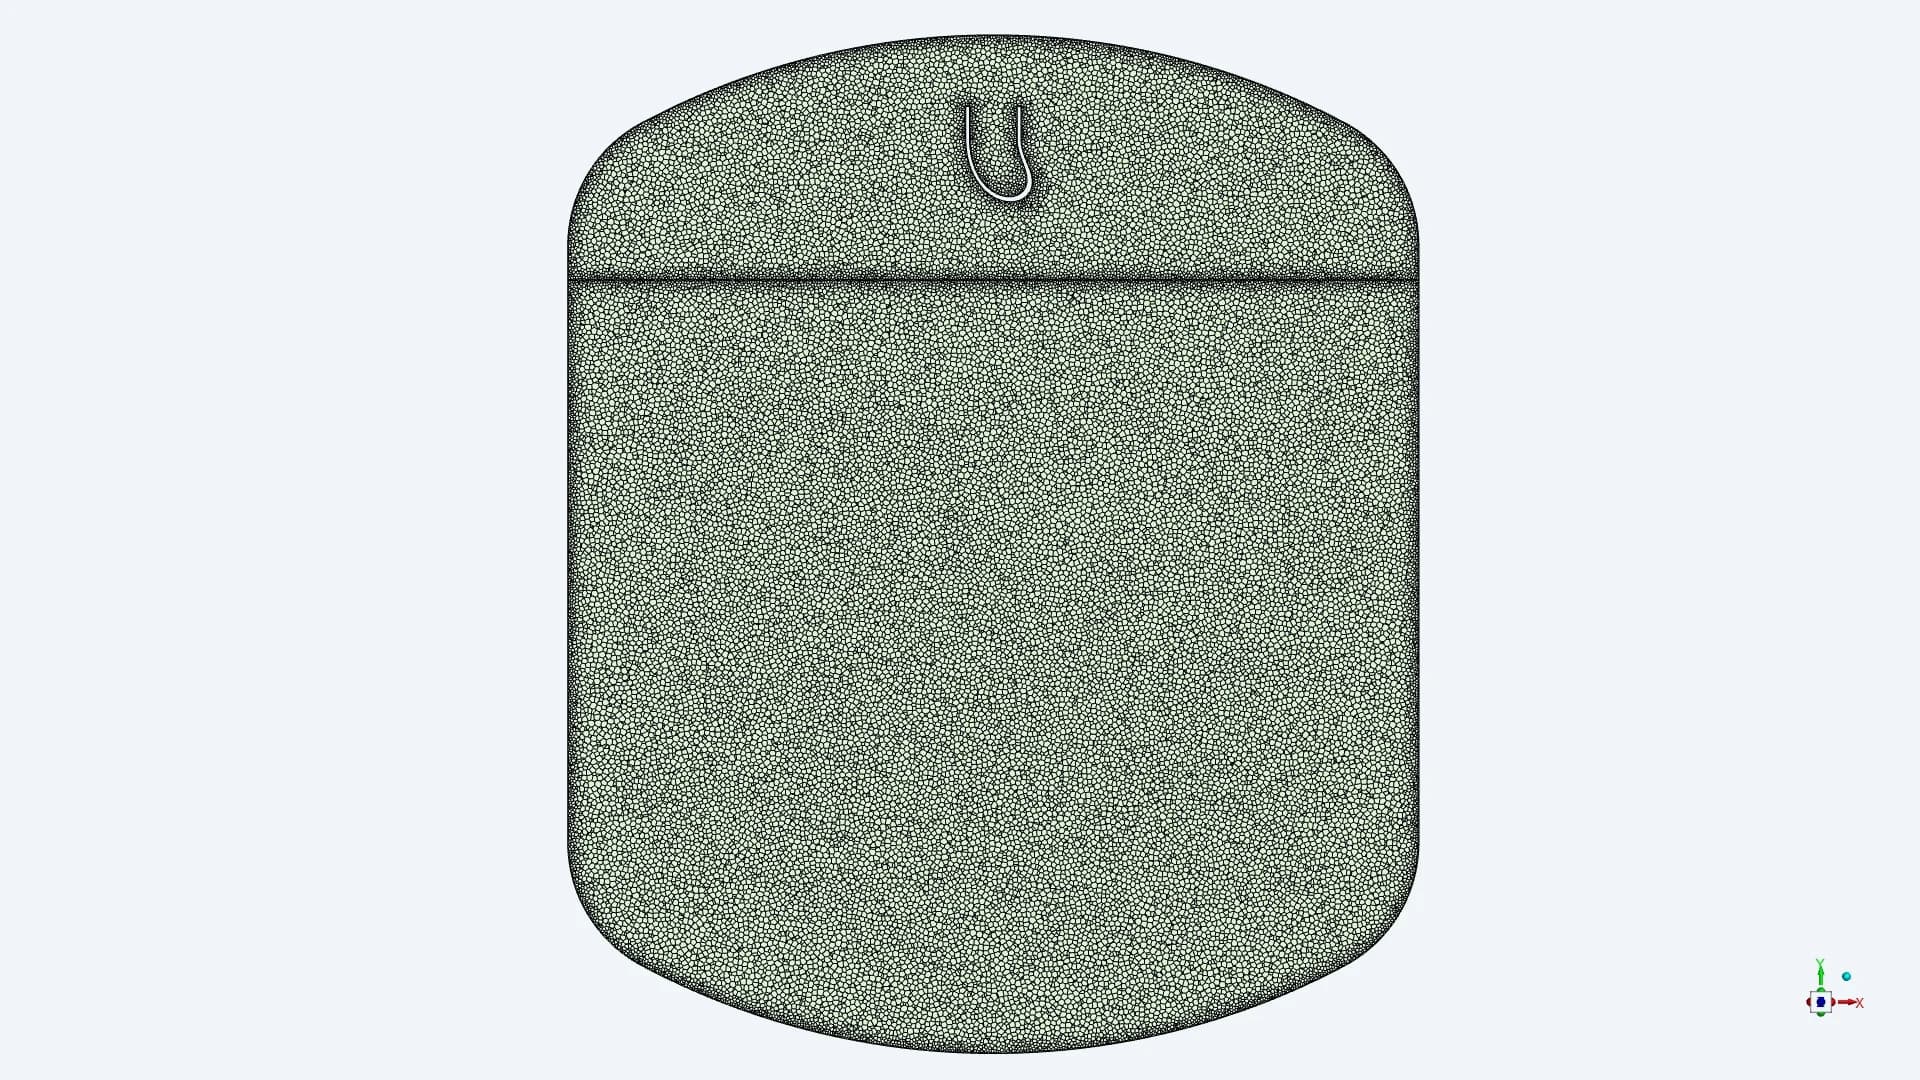
CSI / Domain section
SEPTA / Domain section
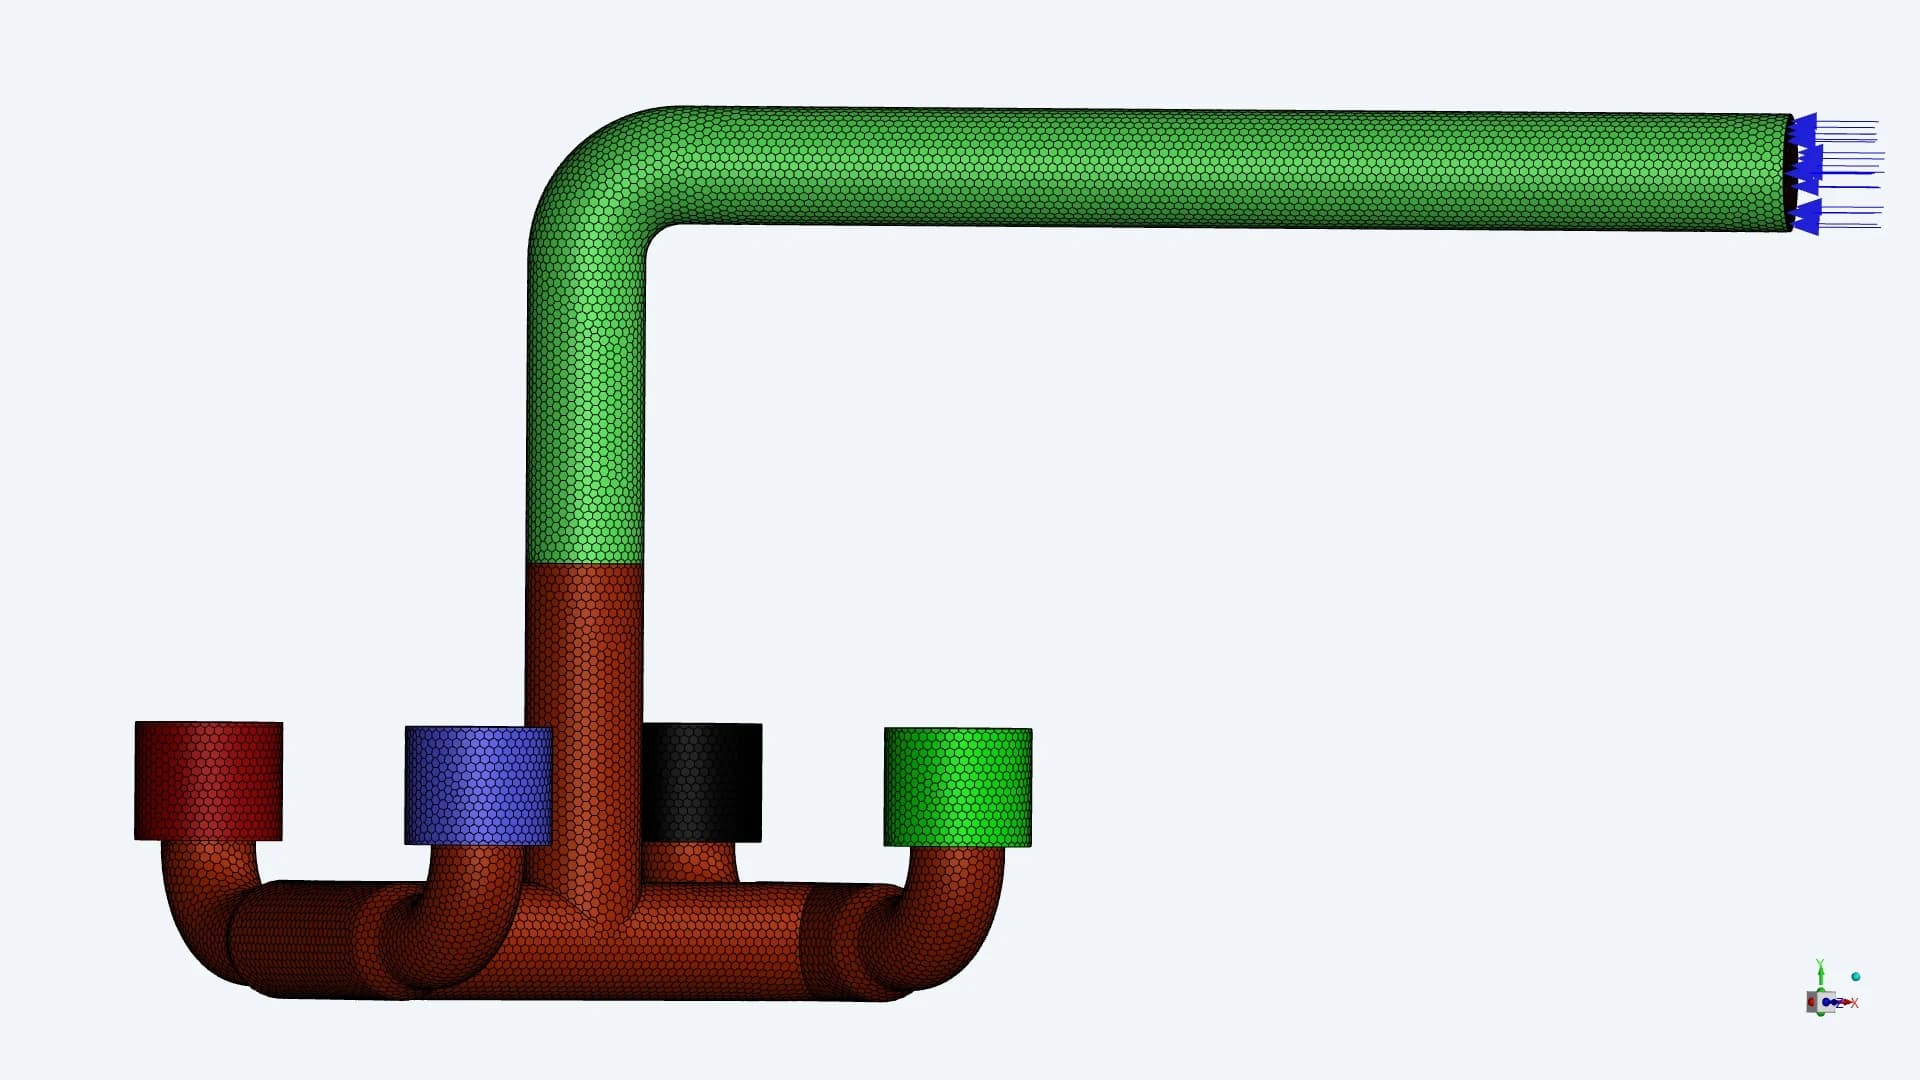
CSI / Inlet surface mesh
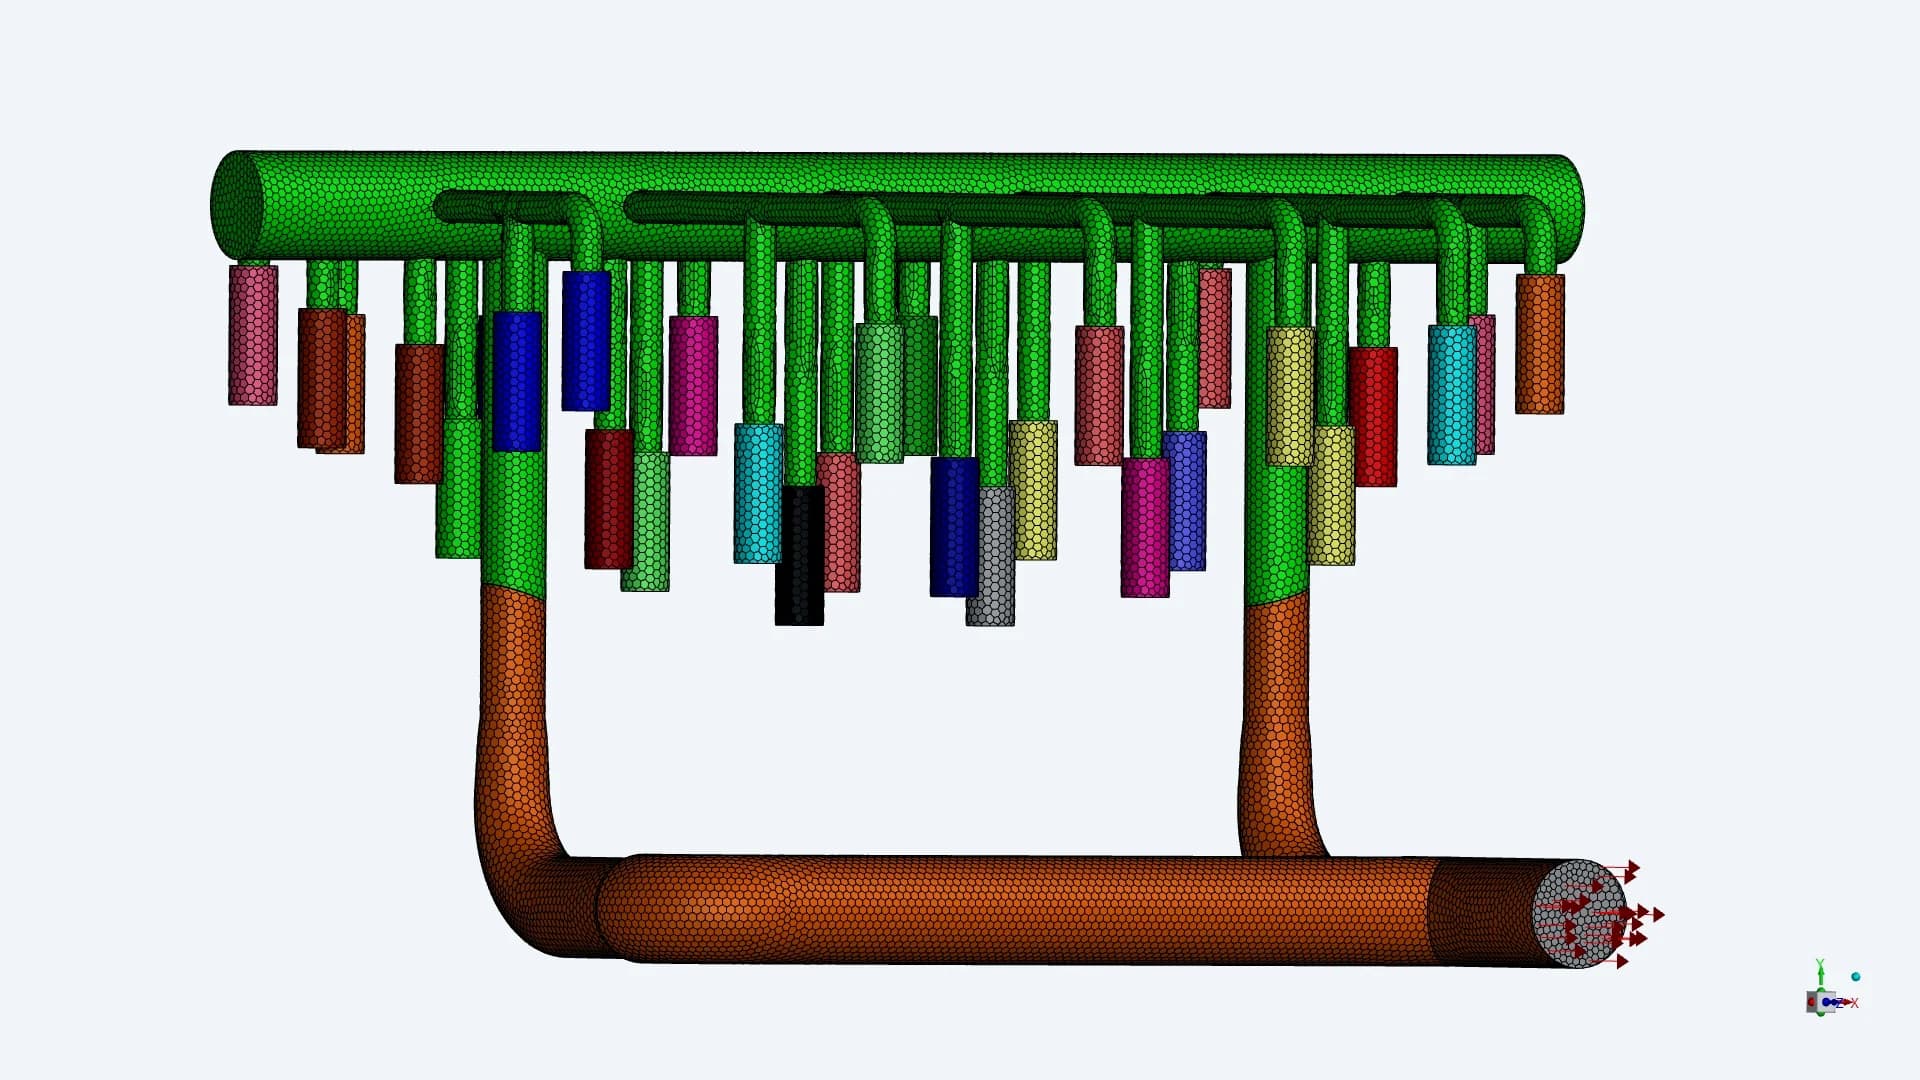
CSI / Collector surface mesh
The team prepared the full fluid-domain mesh and inspected the inlet and collector details. The section views show the volume discretisation through the vessel and media region
05 / SIMULATION CONDITIONS
A common operating flow for both tanks
| STUDY INPUTS | CSI / SC-01 | SEPTA / SC-02 |
|---|---|---|
| Specified flow | 1,000 GPM | 1,000 GPM |
| Inlet arrangement | Top entry with four distributor branches | Side entry turning upward |
| Media region in the model | Carbon bed, shown in blue | Carbon bed, shown in pink |
| Outlet collection | Distributed elements and two discharge branches | Eight connections into the lower header |
| Outlet condition in report | Outlet boundary shown | Pressure outlet: 0 Pa |
The March preparation report identified the flow inputs to confirm. The April case reports then documented the 1,000 GPM operating condition for the two assemblies
06 / FILTER AND BED INPUTS
Resistance data for the screens and carbon bed
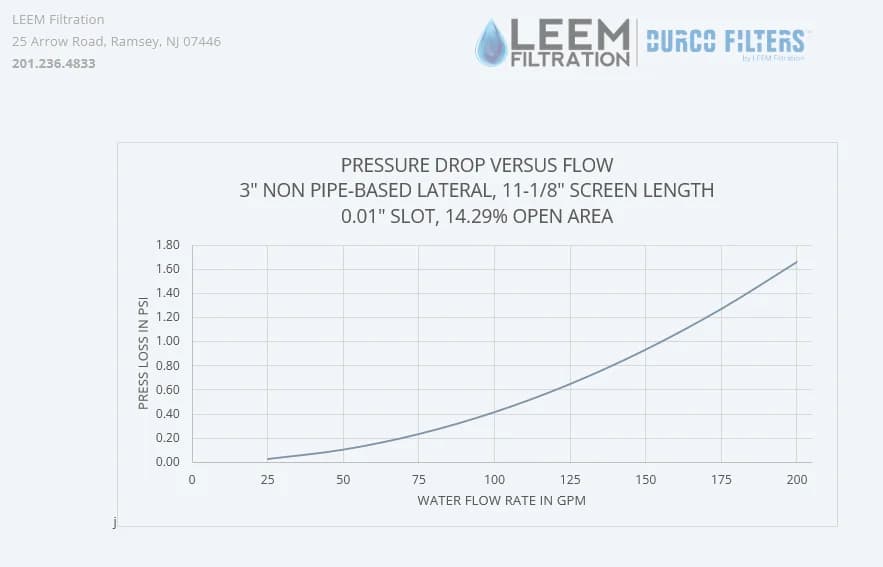
Outlet lateral / 0.01-inch slot
The outlet-screen reference gives pressure loss versus component water flow and identifies 14.29% open area
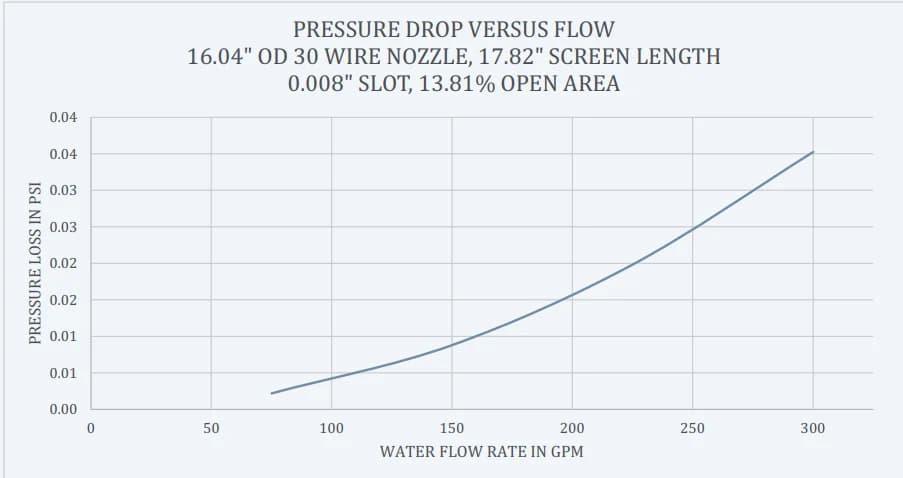
Inlet distributor / 0.008-inch slot
The inlet-screen reference gives a separate resistance curve and identifies 13.81% open area
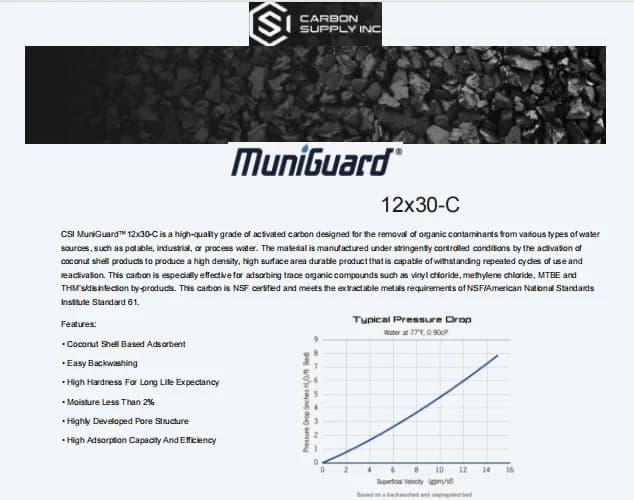
Carbon-bed resistance
The supplied MuniGuard 12x30-C sheet provides the media reference and a typical pressure-drop relationship. This input complements the screen curves when representing resistance through the filtration assembly
07 / RESULT EXTRACTION
Section planes through the vessels and manifolds
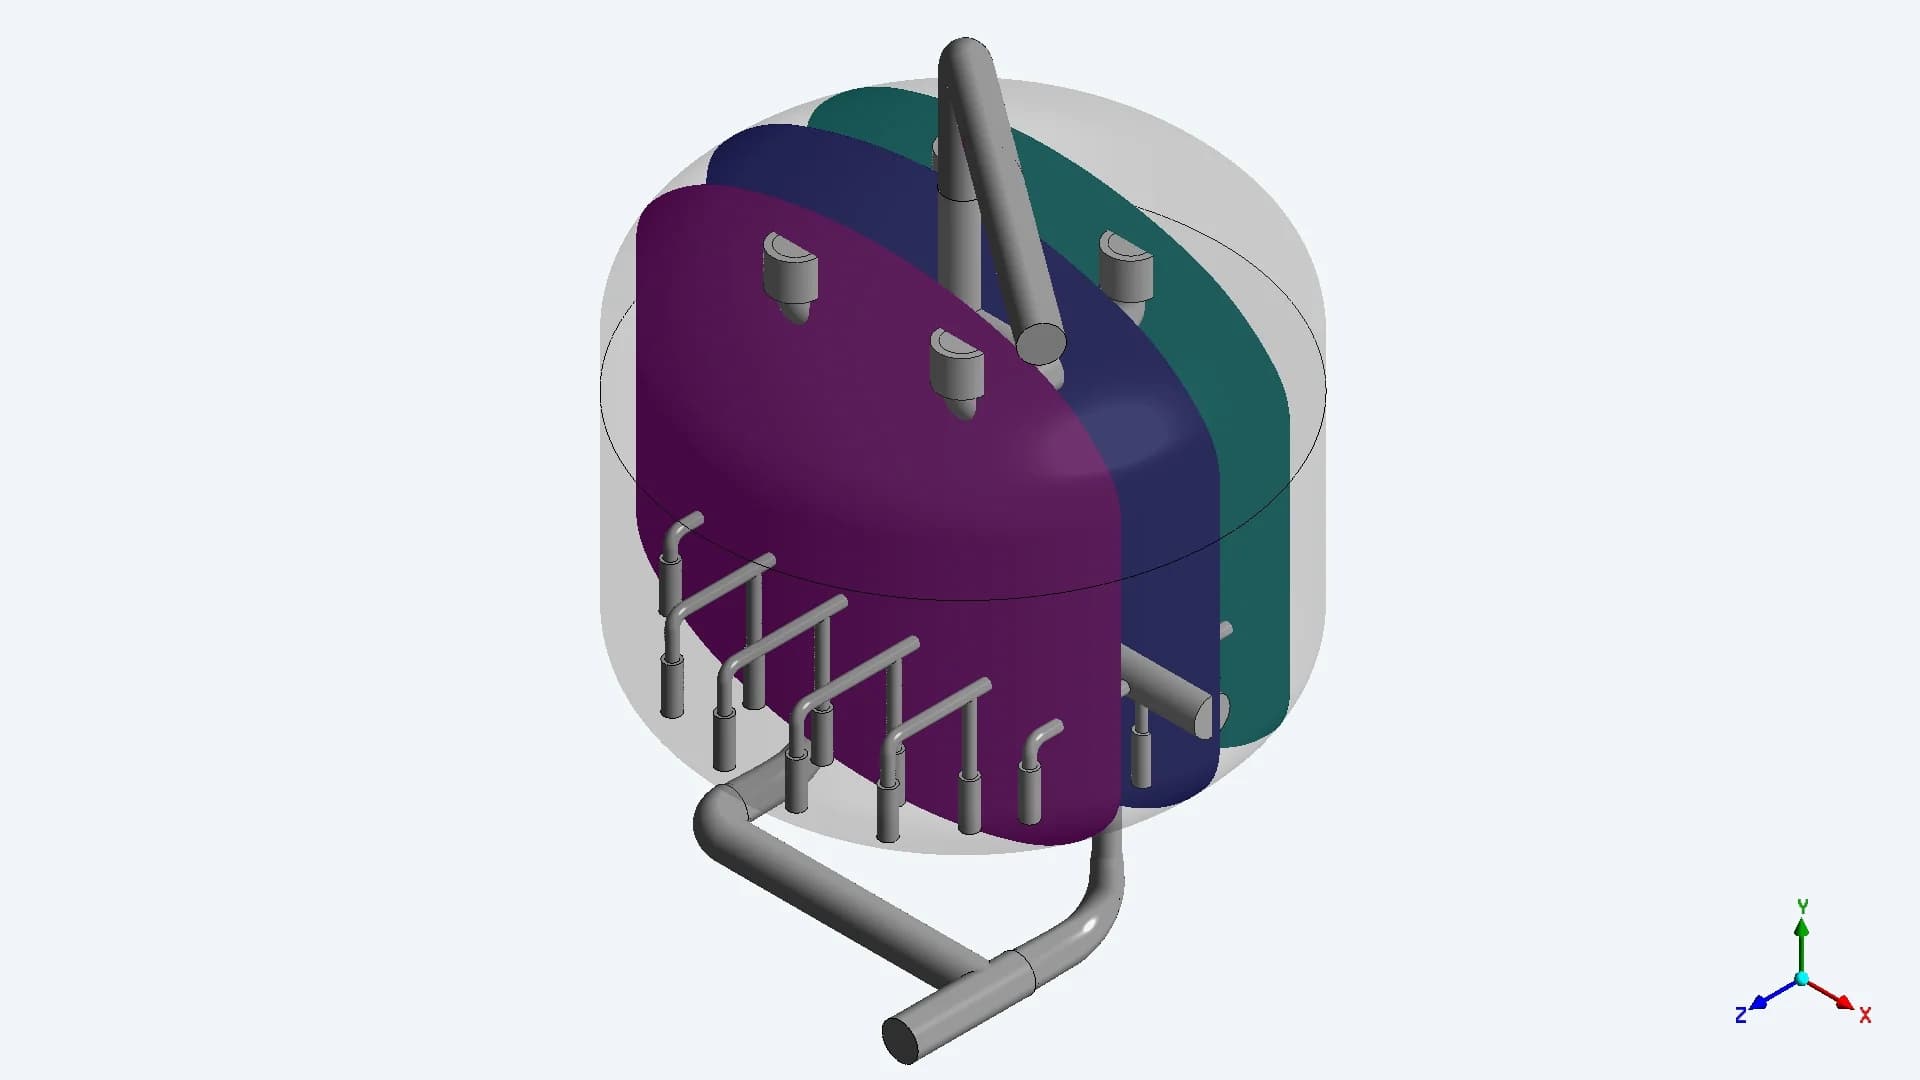
CSI / Five vertical sections
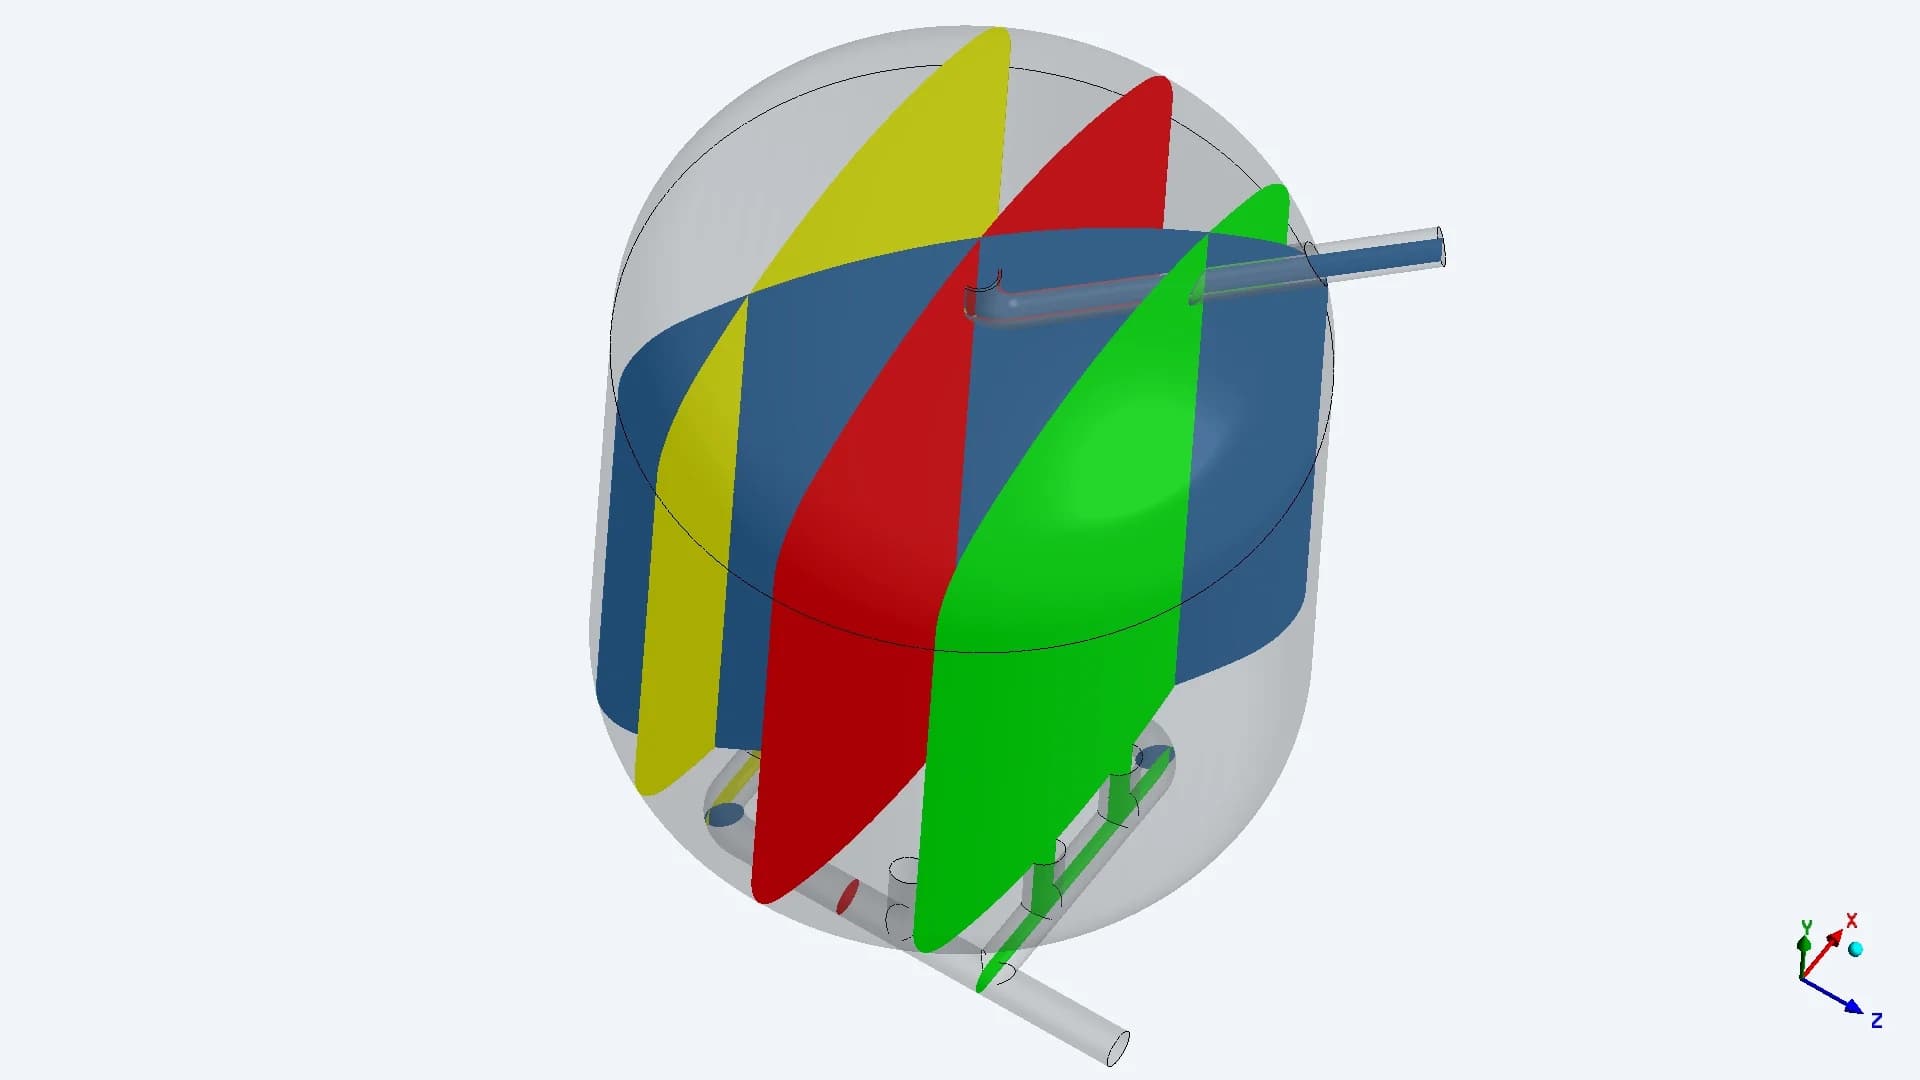
SEPTA / Seven vertical sections
The individual tank studies use several vertical sections to examine the inlet jets, the bed and the lower collection region. The later comparison adds horizontal planes at relative positions through each bed
08 / INLET FLOW RESULTS
The SEPTA entry impinges on the upper head
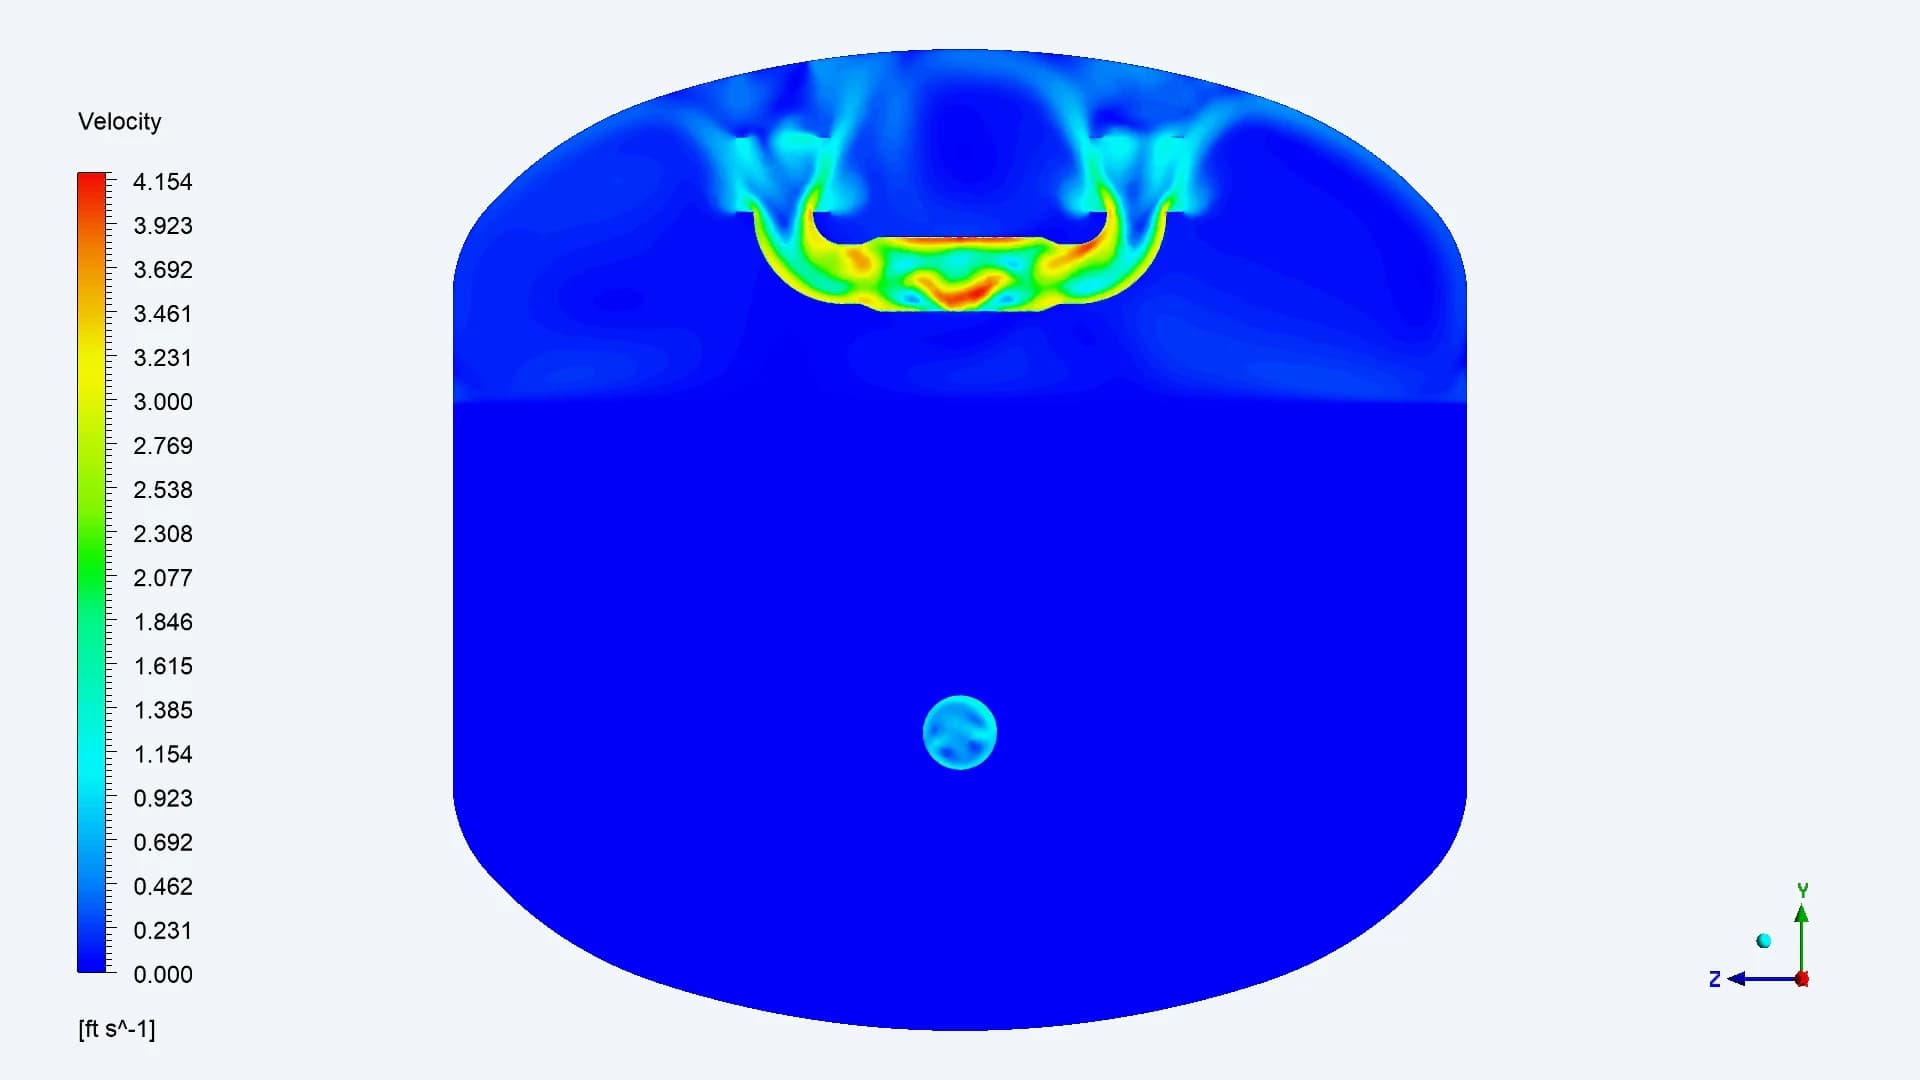
CSI / Flow spreads around the distributor
The four porous distributor openings slow and spread the incoming flow around the upper region
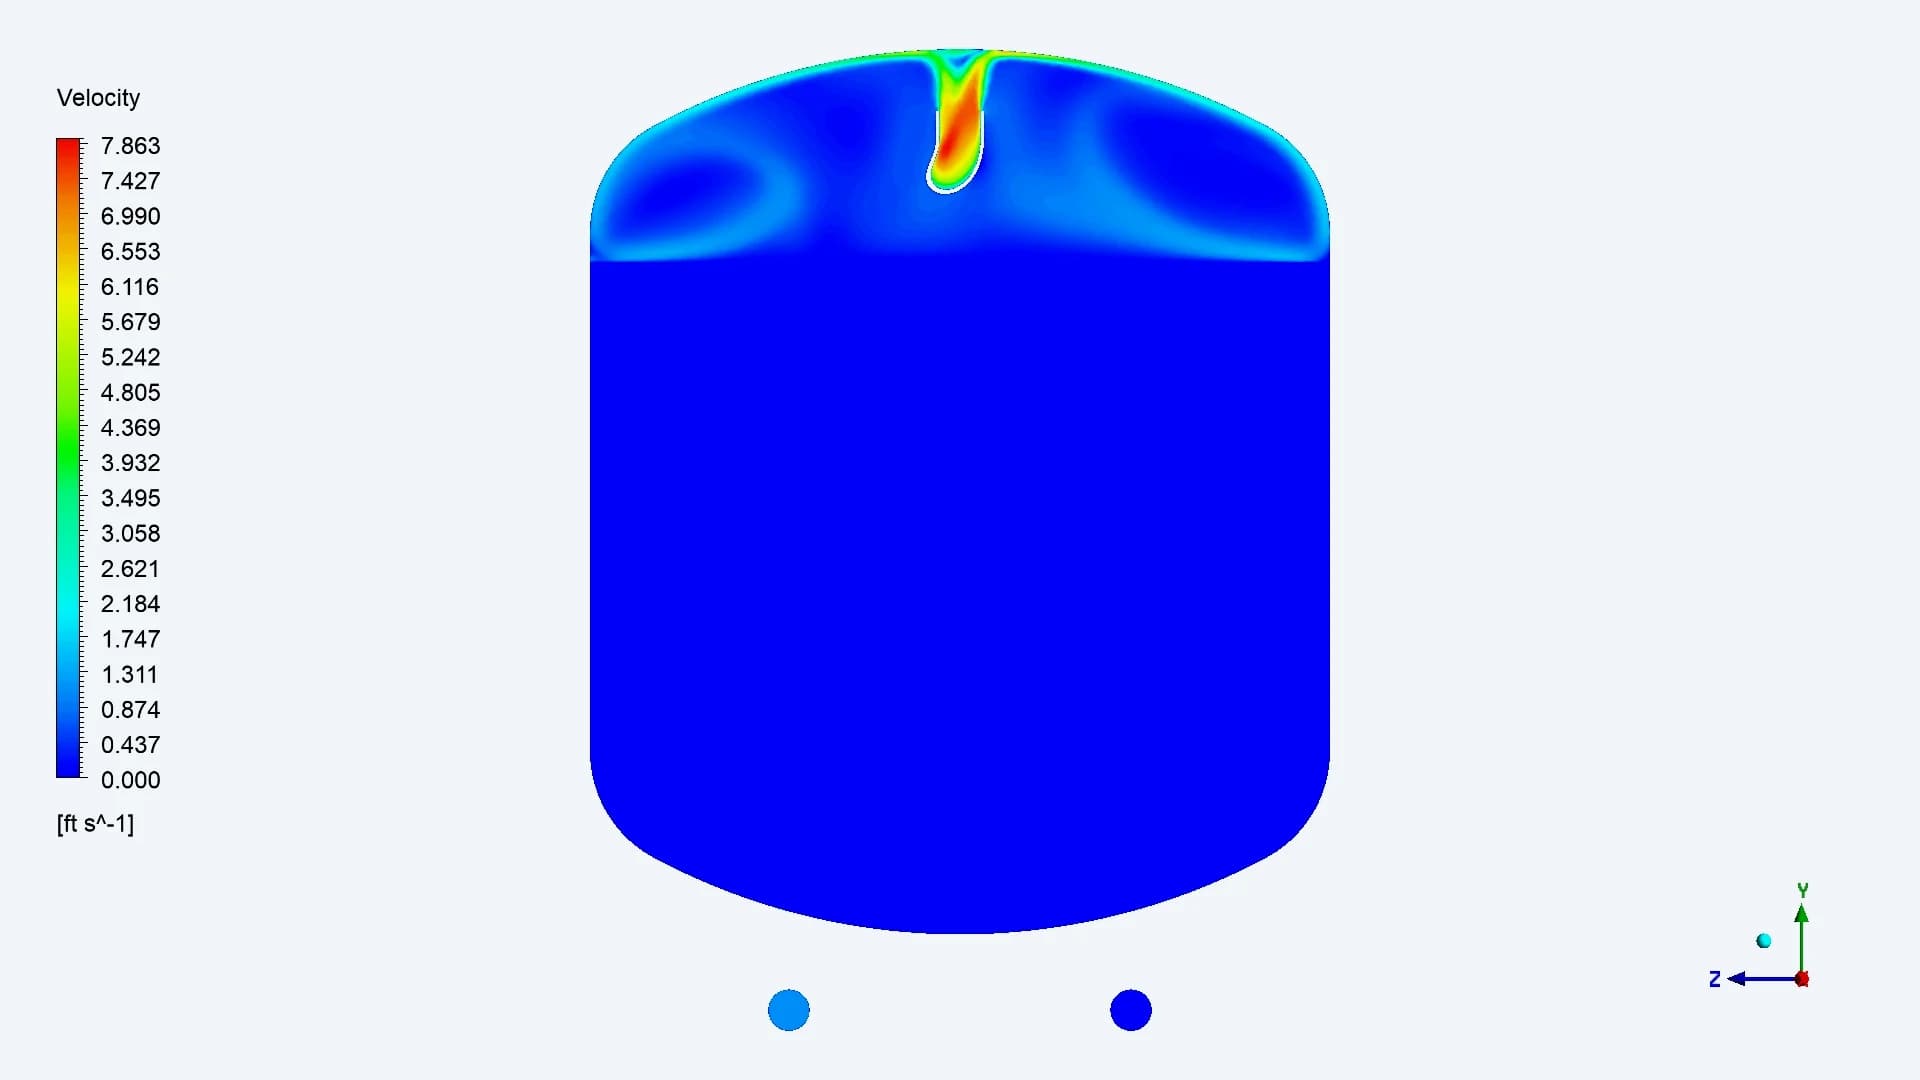
SEPTA / A concentrated entry jet
The upward-facing entry directs the jet at the upper head. The flow then turns and spreads across the vessel
Original velocity legends retained. These views use different section orientations and display ranges
09 / LOW-SPEED FLOW THROUGH THE BED
A restricted display range reveals the bed flow
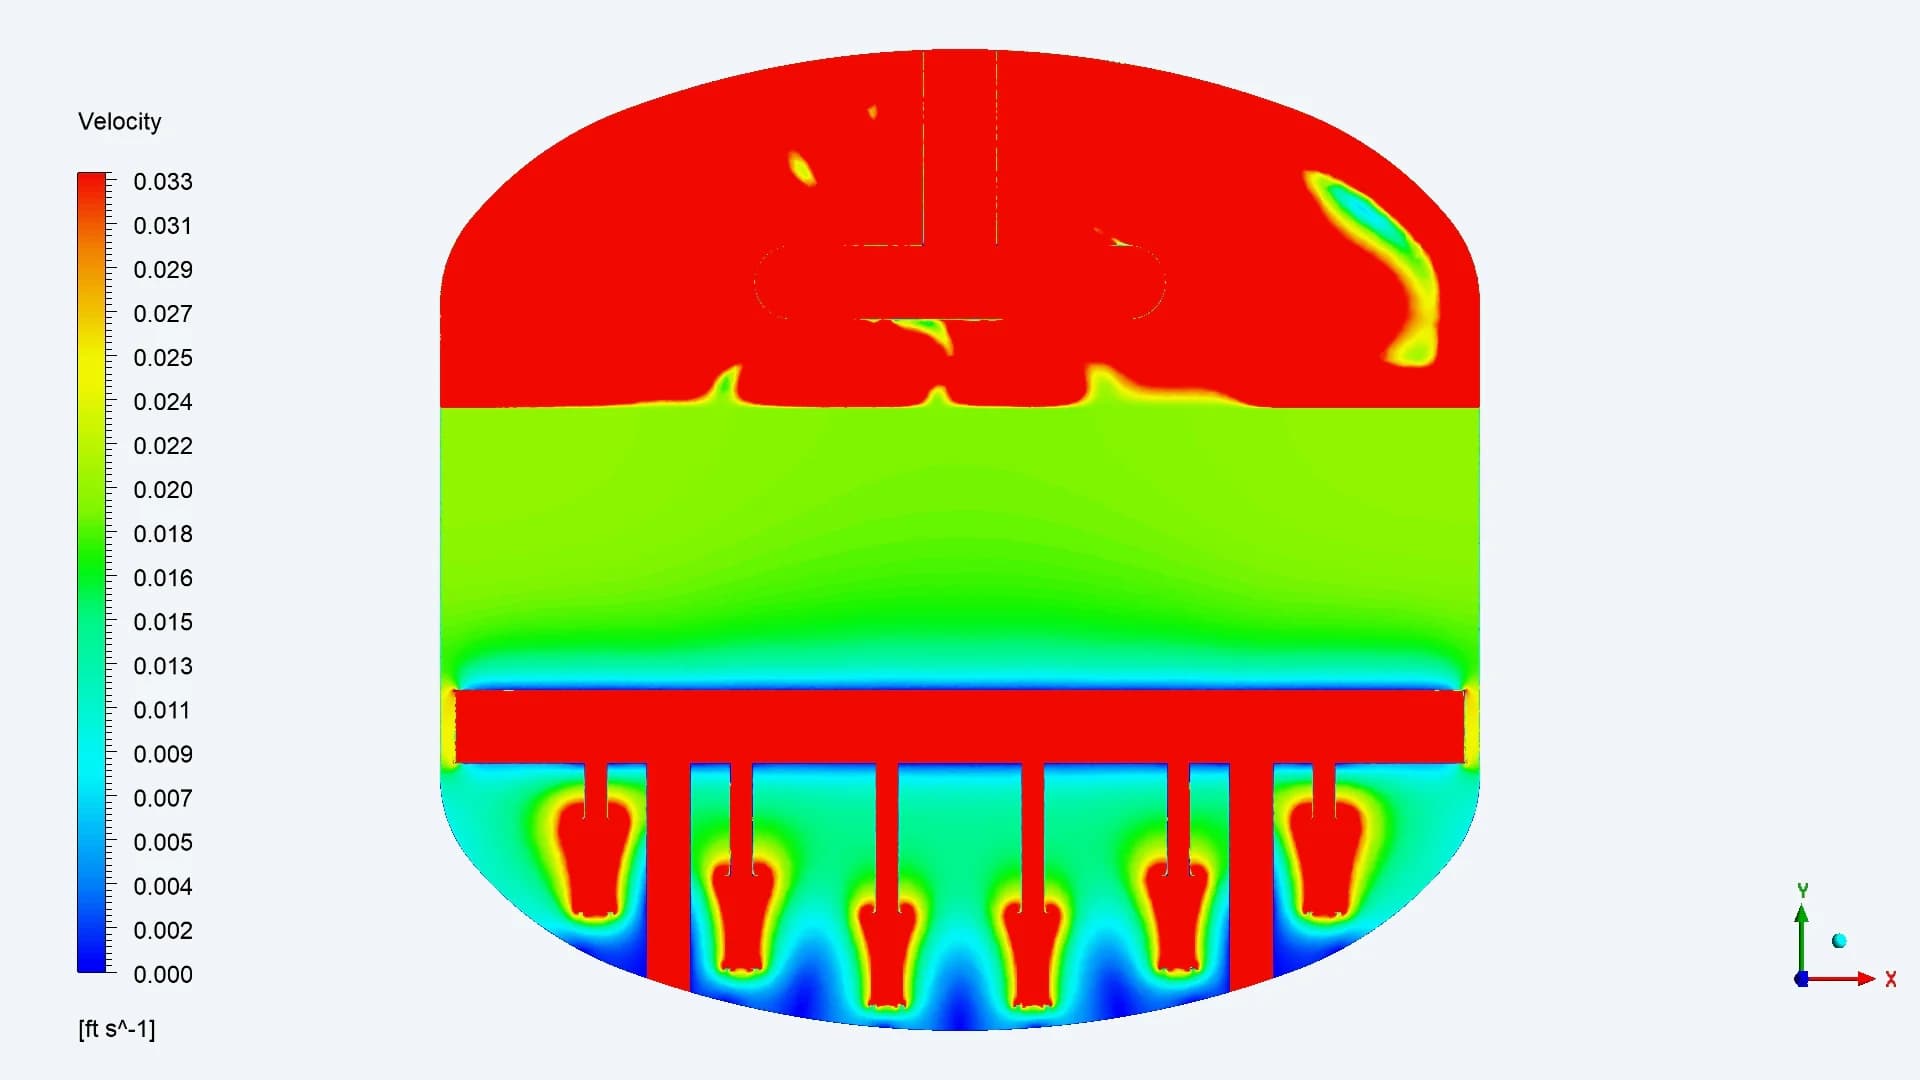
CSI / Lower collector features remain visible
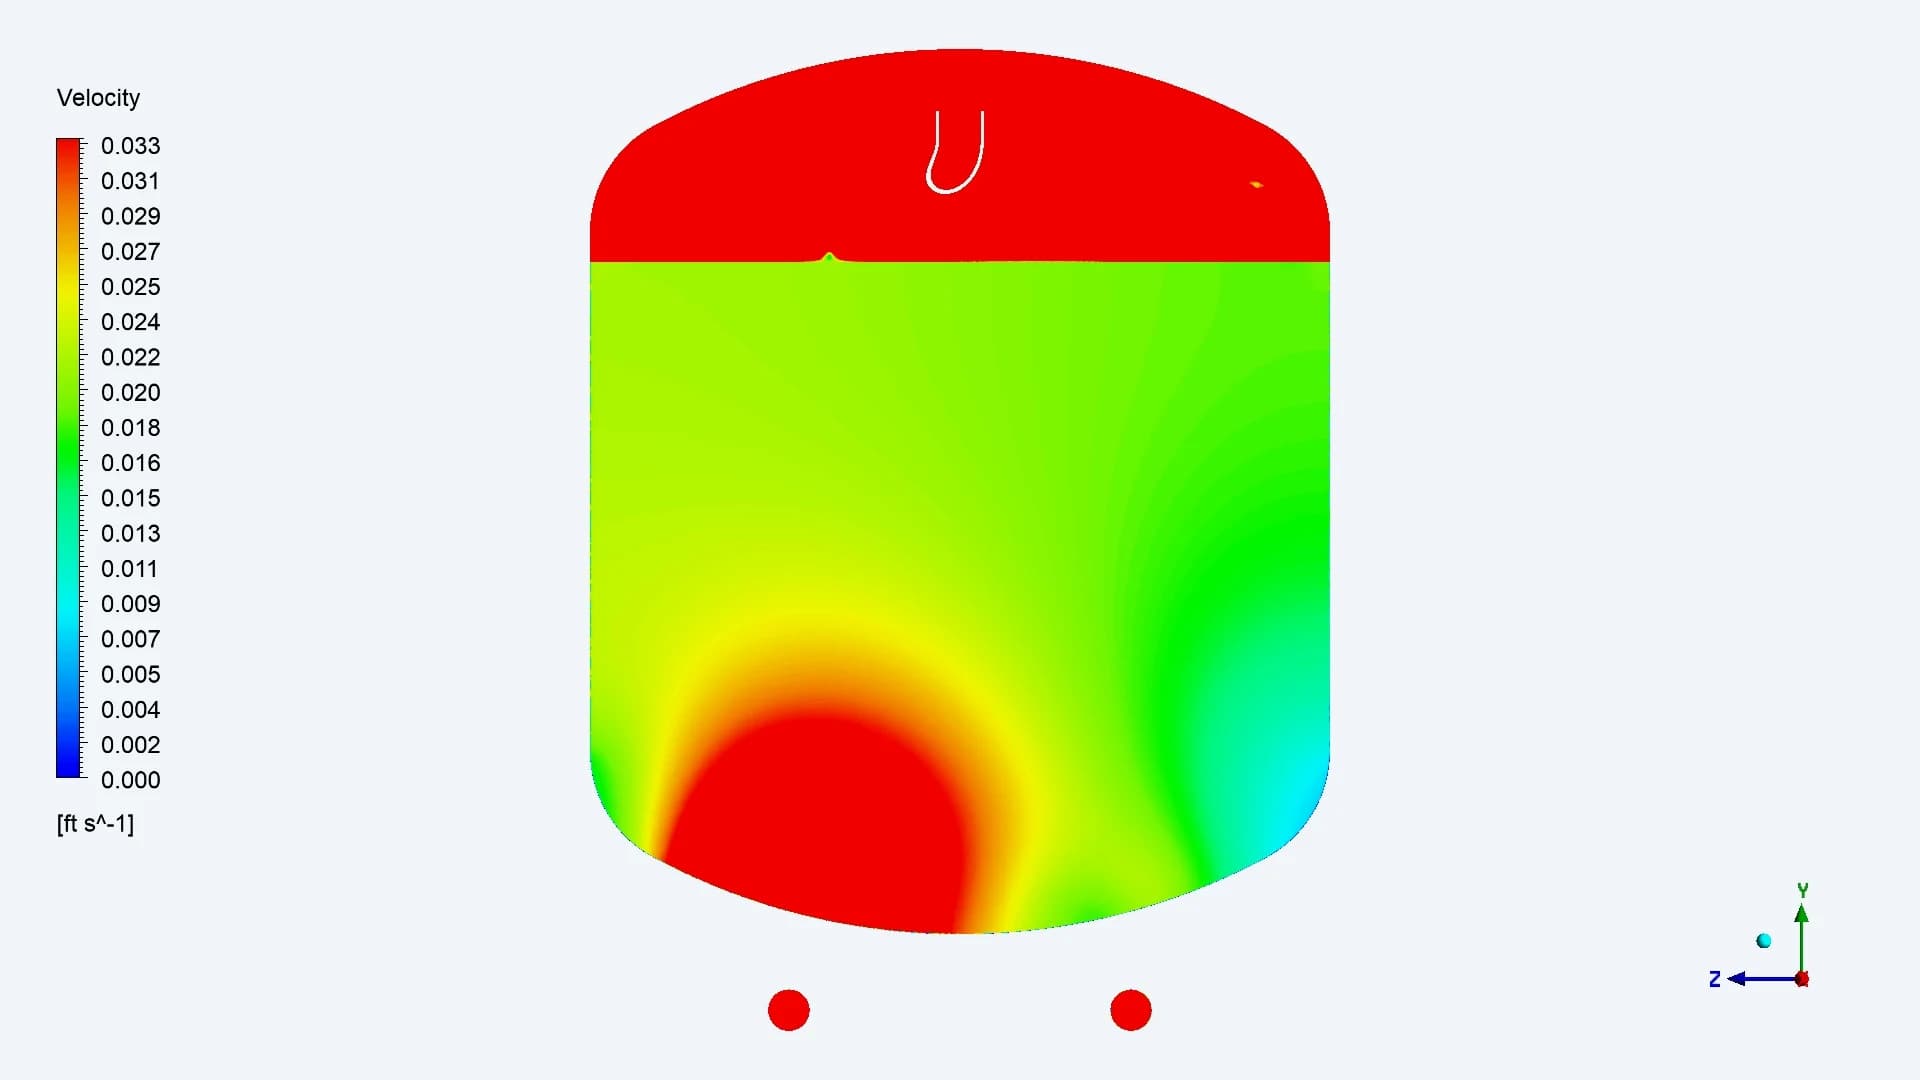
SEPTA / Flow concentrates near one side
The report clips the colour scale at 0.033 ft/s, approximately 2 ft/min, to reveal the much slower motion within the bed. Red regions reach or exceed that display limit. The limit is a viewing choice, not the maximum velocity in the tank
10 / TOTAL-PRESSURE RESULTS
Pressure contours add context to the flow field
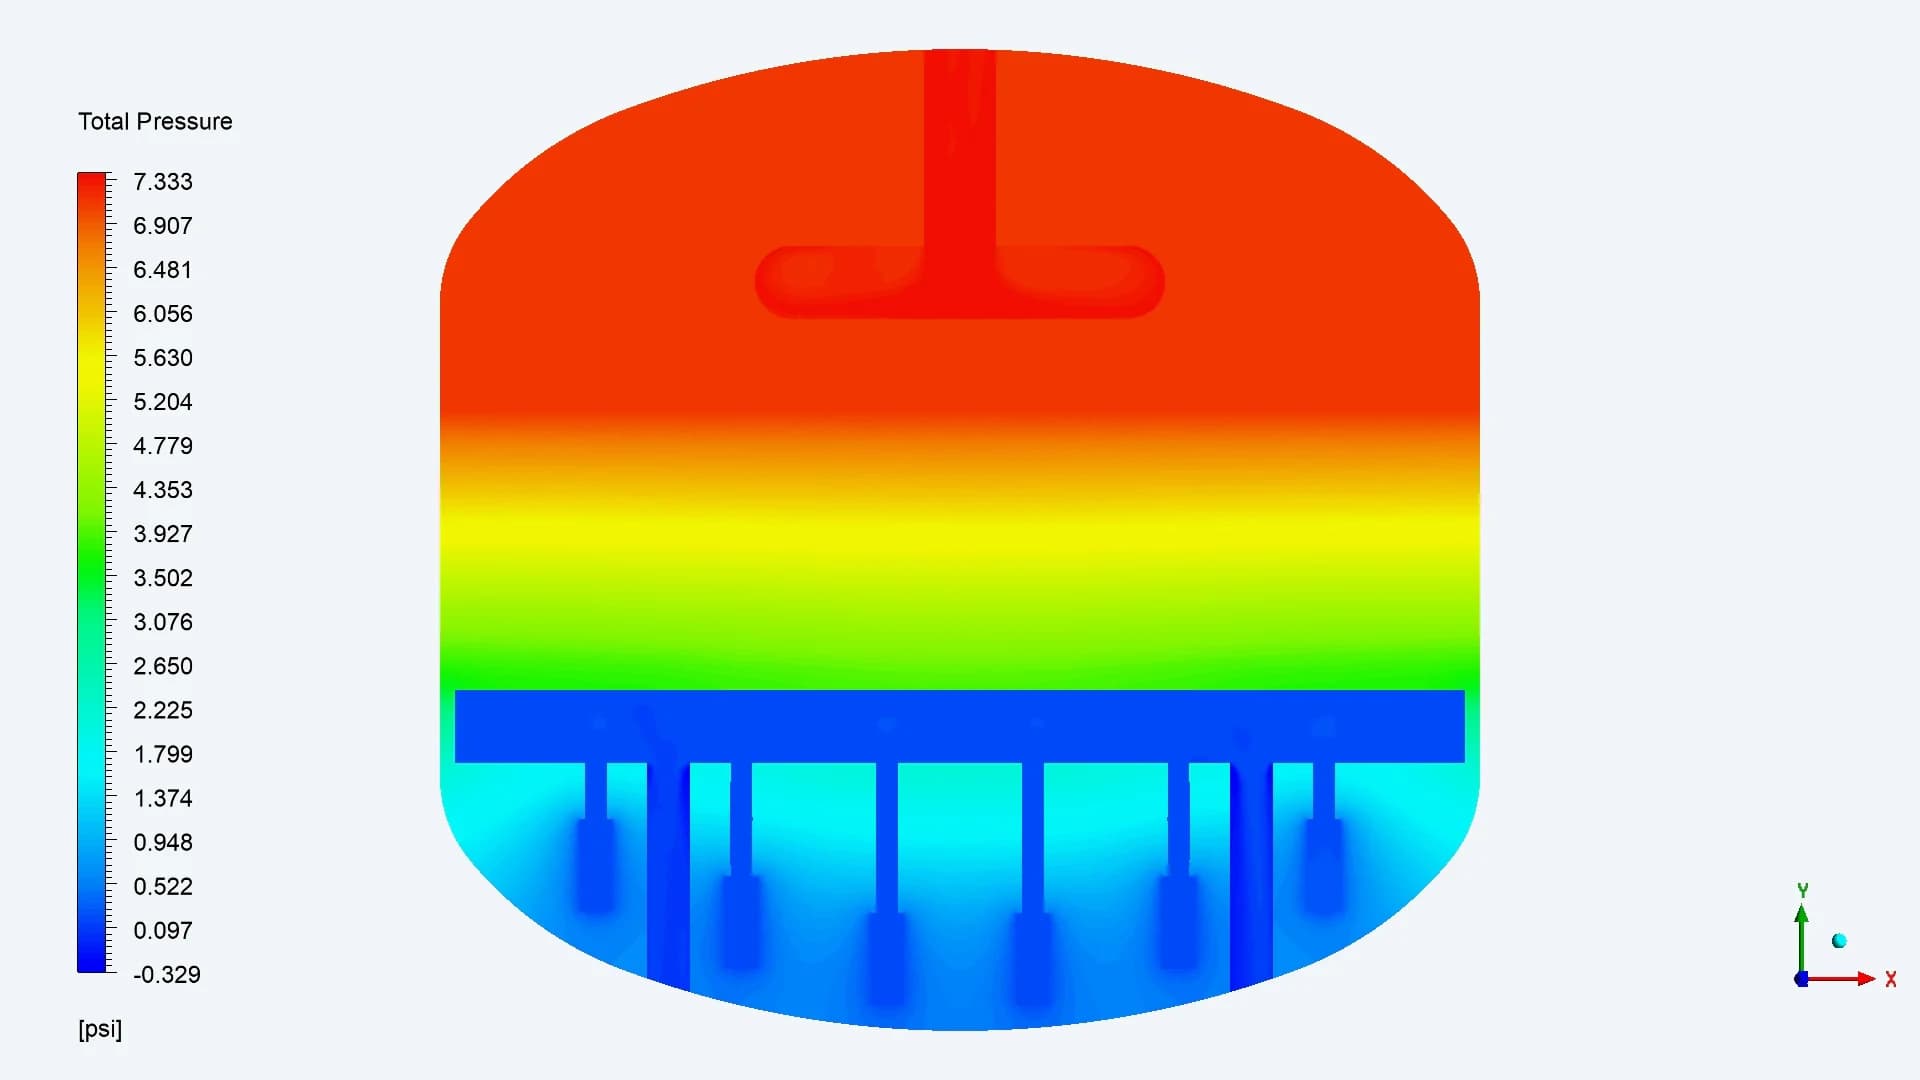
CSI / Bed and collector section
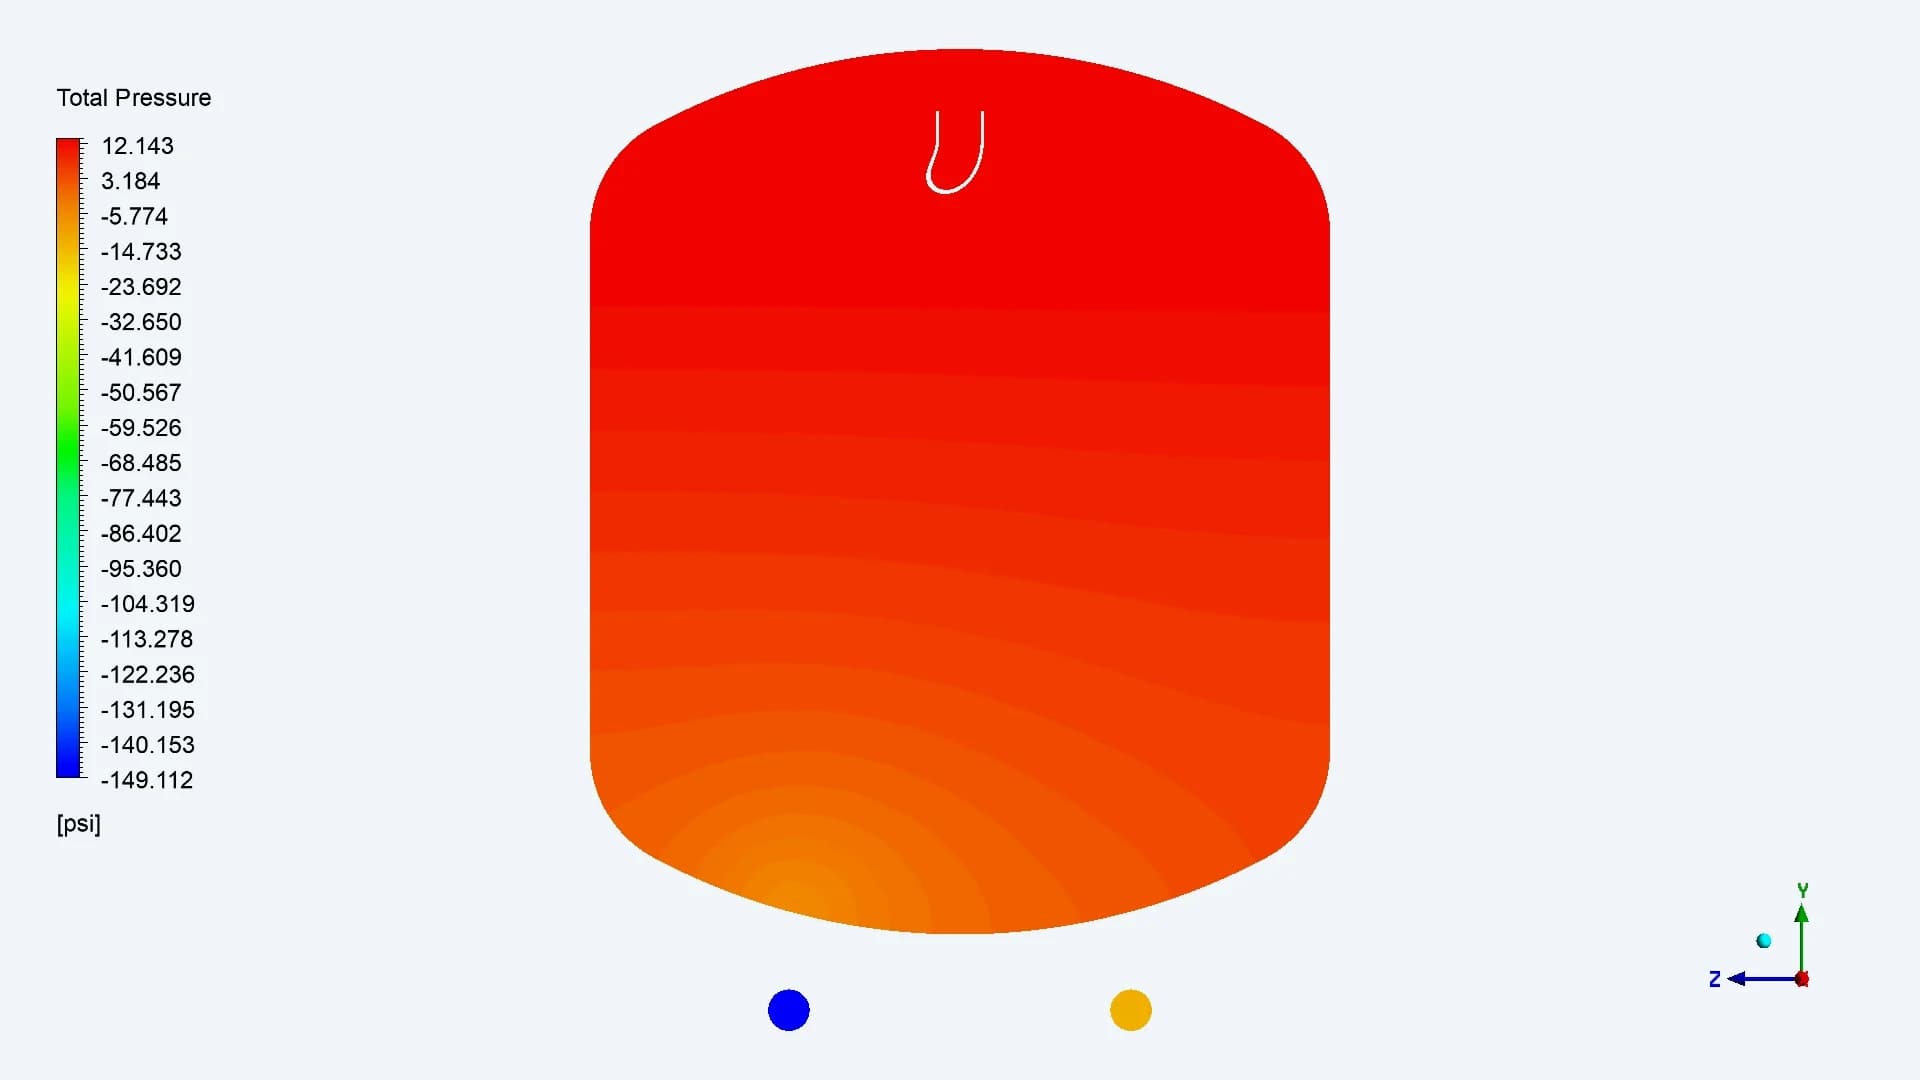
SEPTA / Bed and bottom connections
The total-pressure views show variation through the bed and around the collection regions. Each original plot retains its own pressure legend. The supplied results support inspection of these distributions without a quantified pump-energy comparison
11 / COMPARISON THROUGH THE BED
Five relative bed levels and the outlet sections
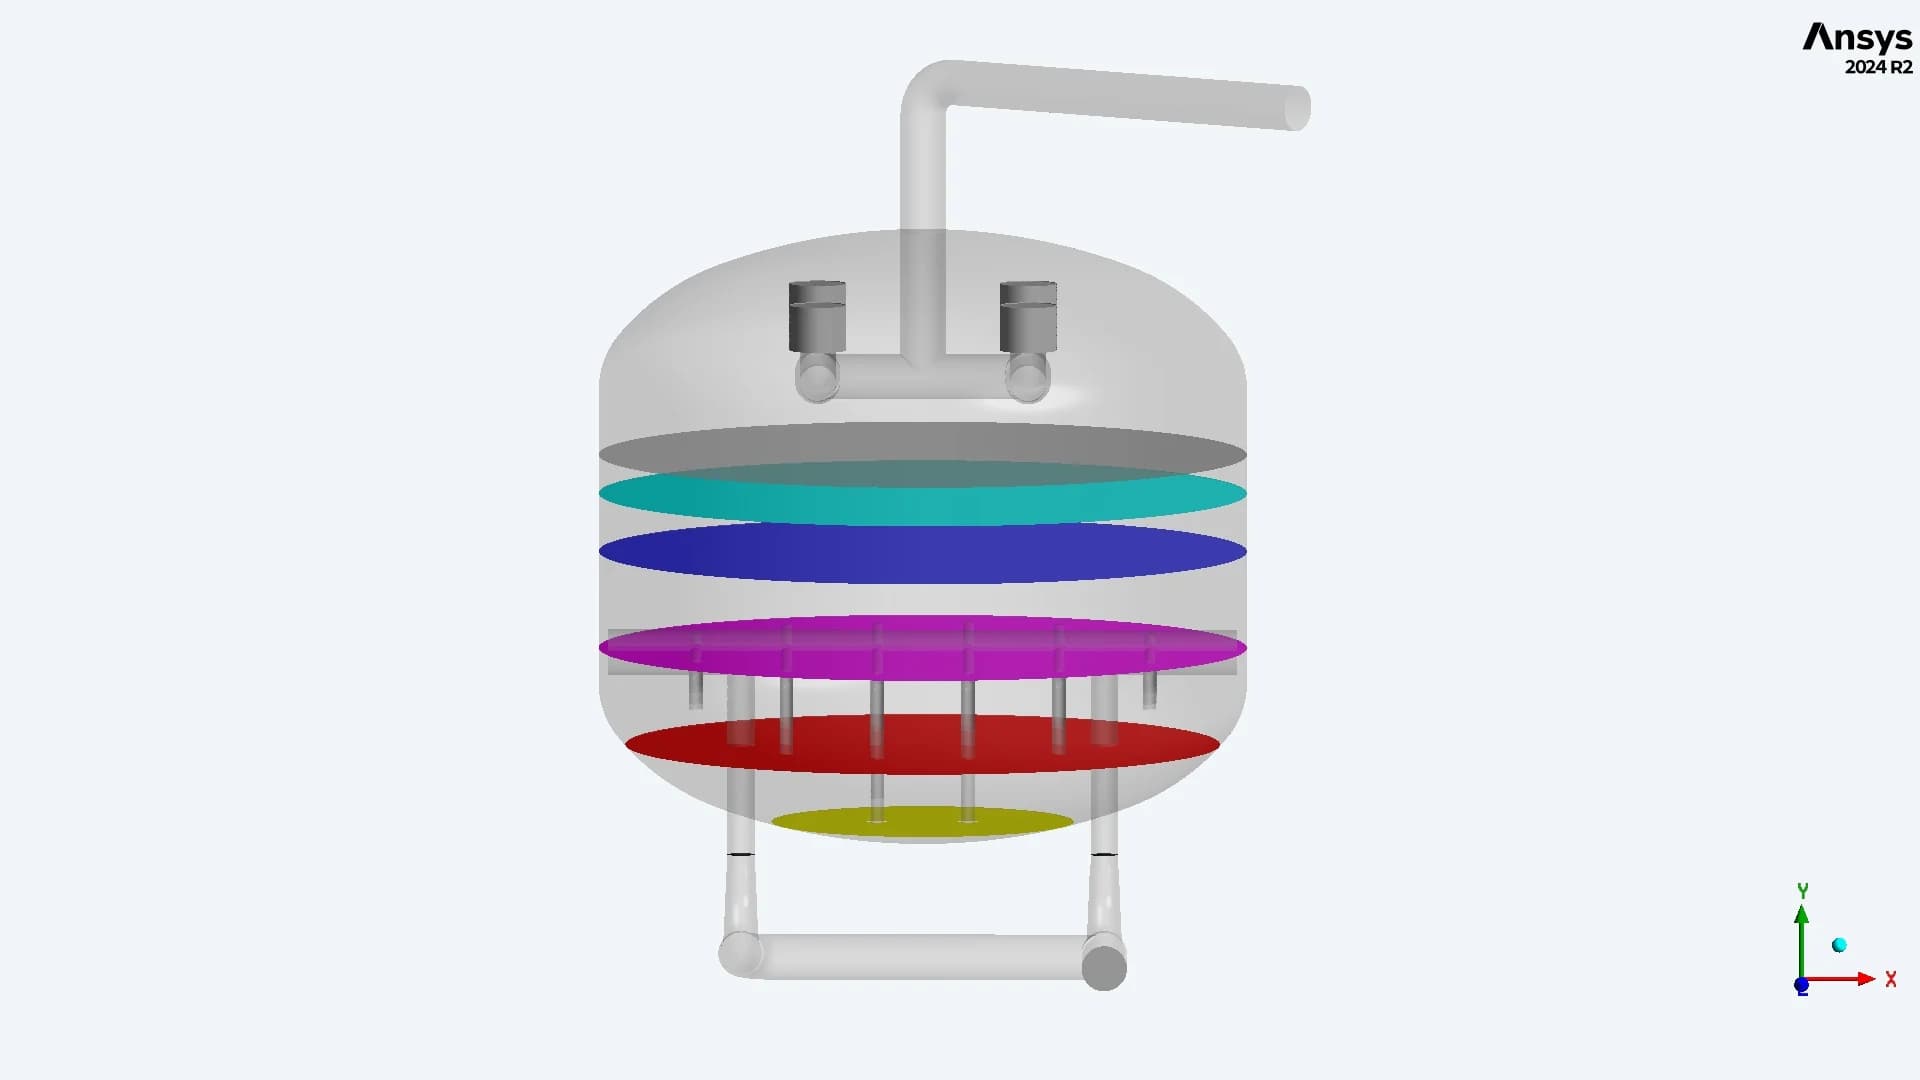
CSI / Relative bed positions
Plane 01: 10% Plane 02: 25% Plane 03: 50% Plane 04: 75% Plane 05: 95% Plane 06: outlets
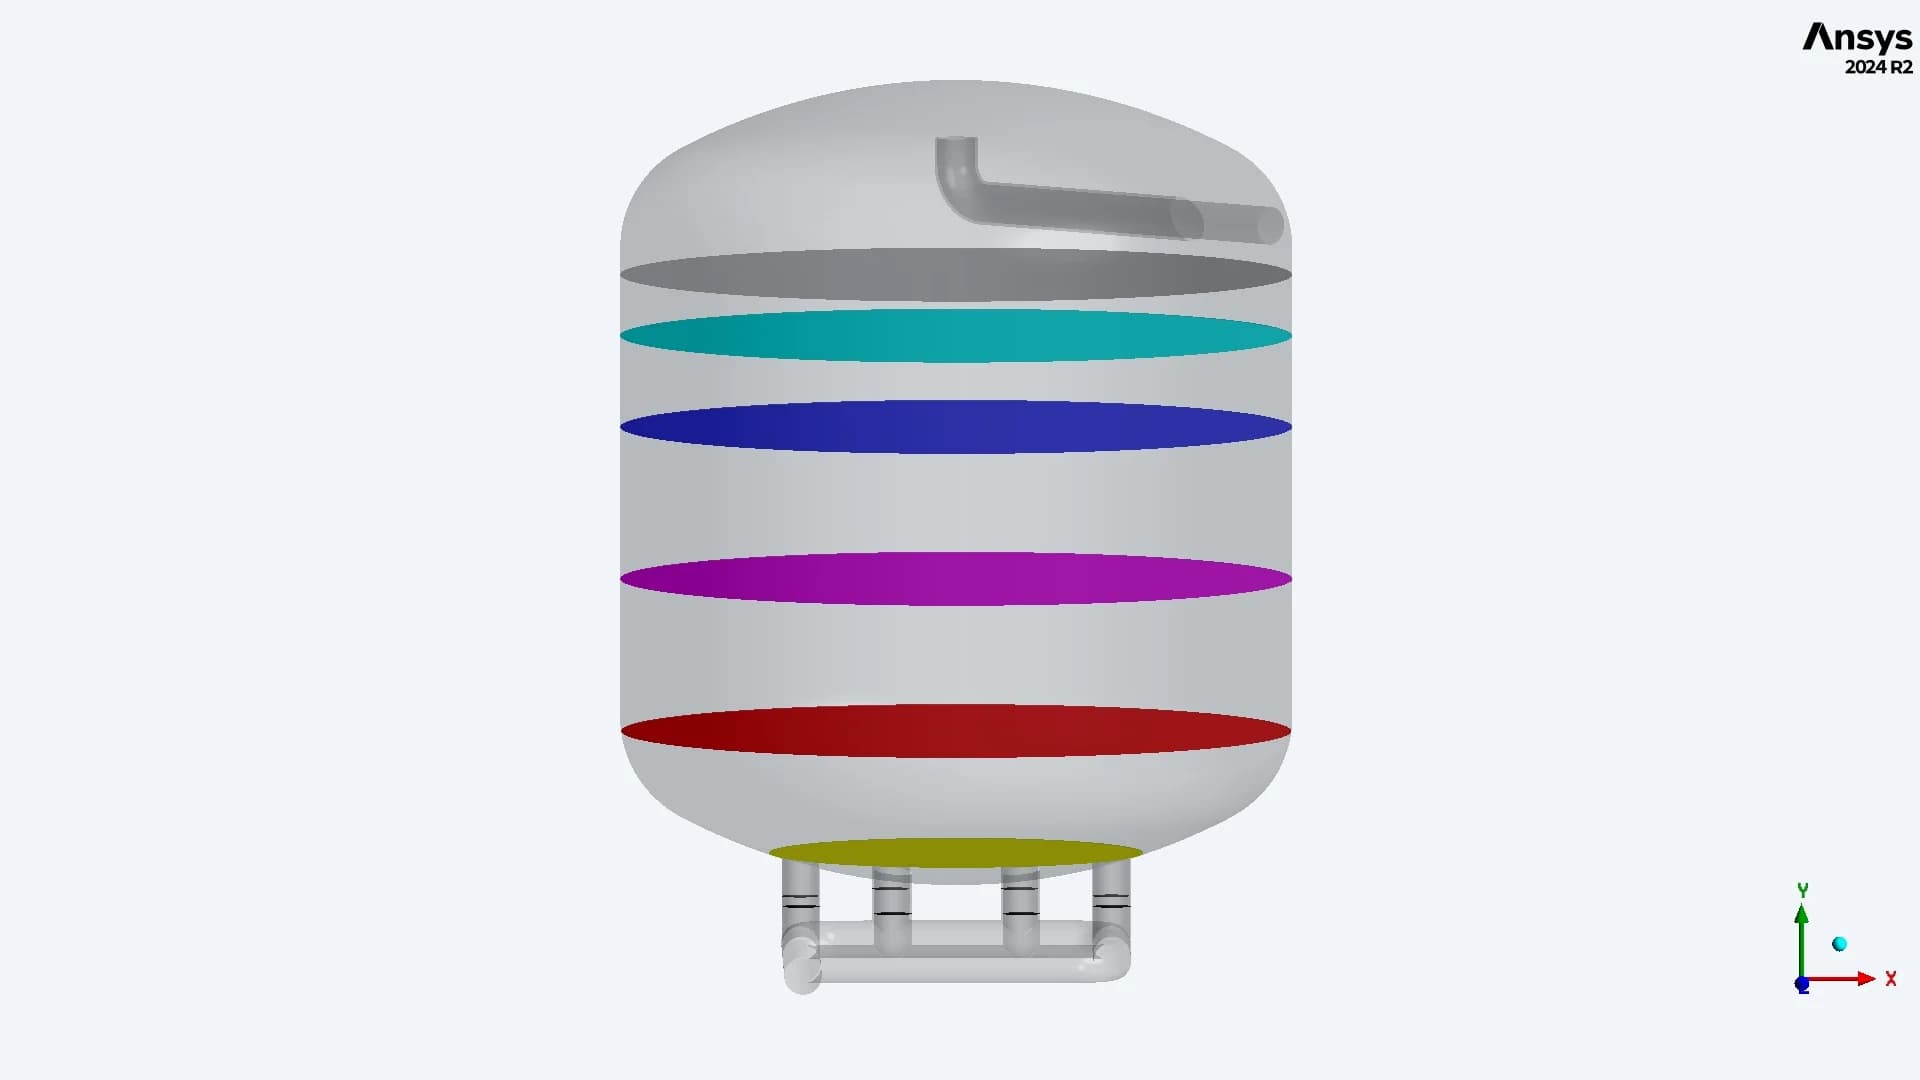
SEPTA / Relative bed positions
Percentages progress from the bed starting zone toward the bottom of each tank. These are relative positions within each bed, not equal physical elevations
12 / BED COMPARISON AT 10%
The first bed section shows the inlet influence
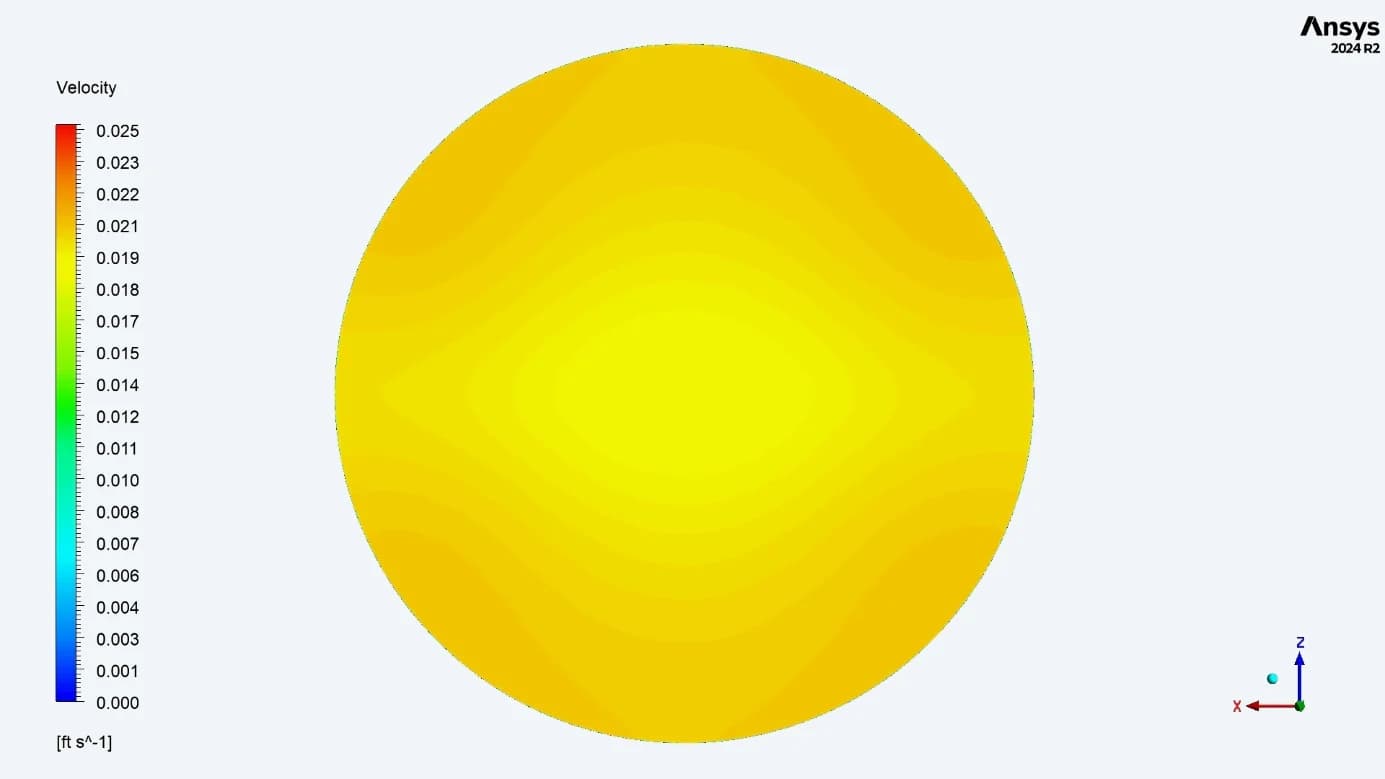
CSI / More even velocity across the section
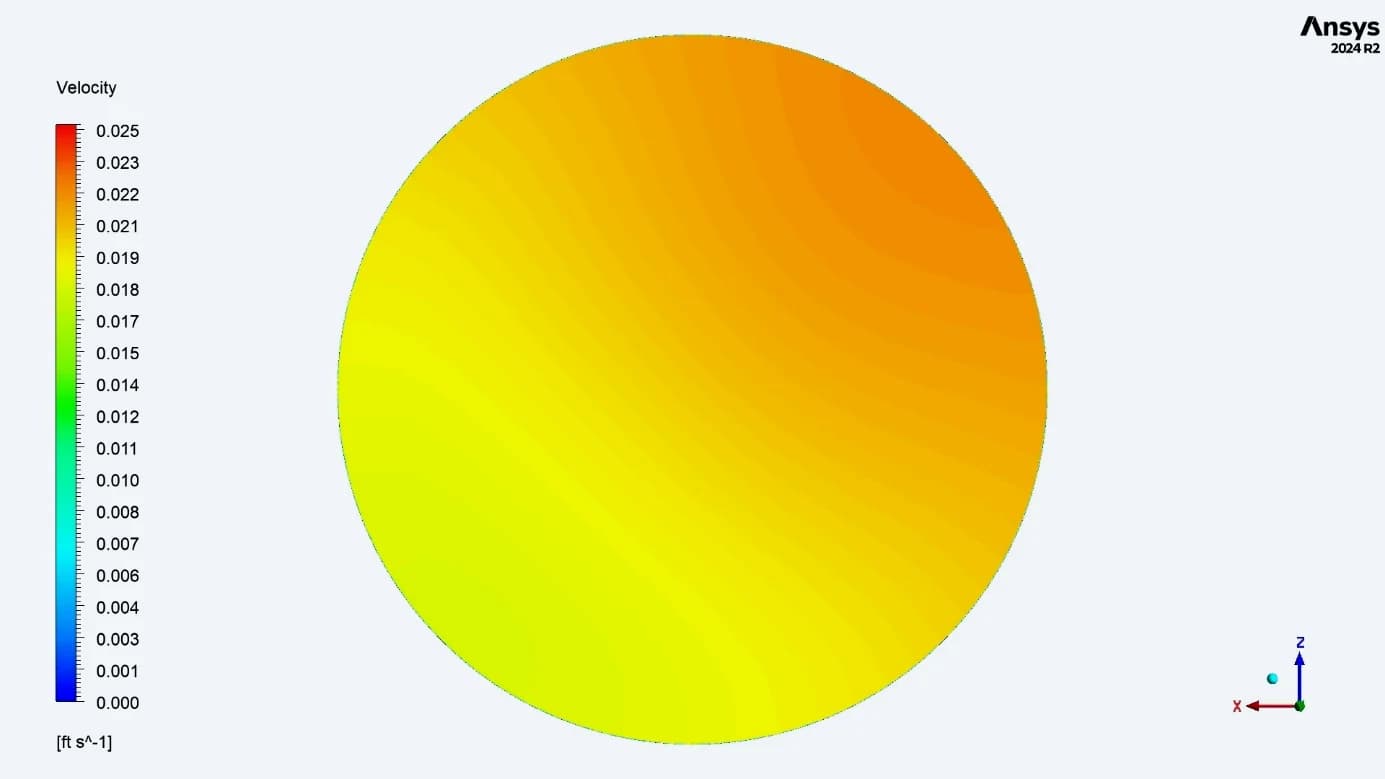
SEPTA / A directional velocity gradient
At 10% of the bed height, the report describes a more uniform velocity distribution in CSI. SEPTA retains a variation across the tank diameter associated with the upward-facing inlet and head impingement Matched display limit: 0.025 ft/s (1.5 ft/min). Values above the limit share the top colour
13 / BED COMPARISON AT 25%
The distribution difference persists deeper in the bed
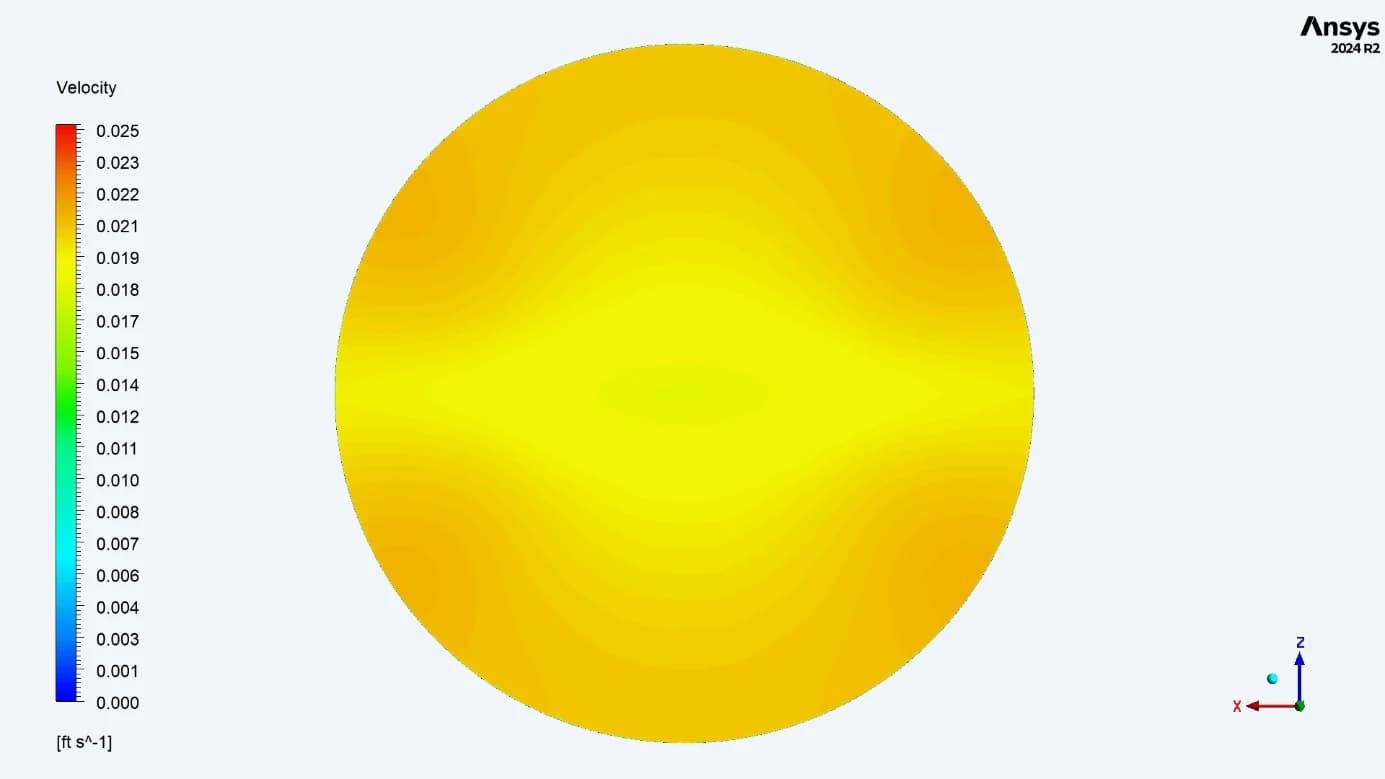
CSI / Broader flow distribution
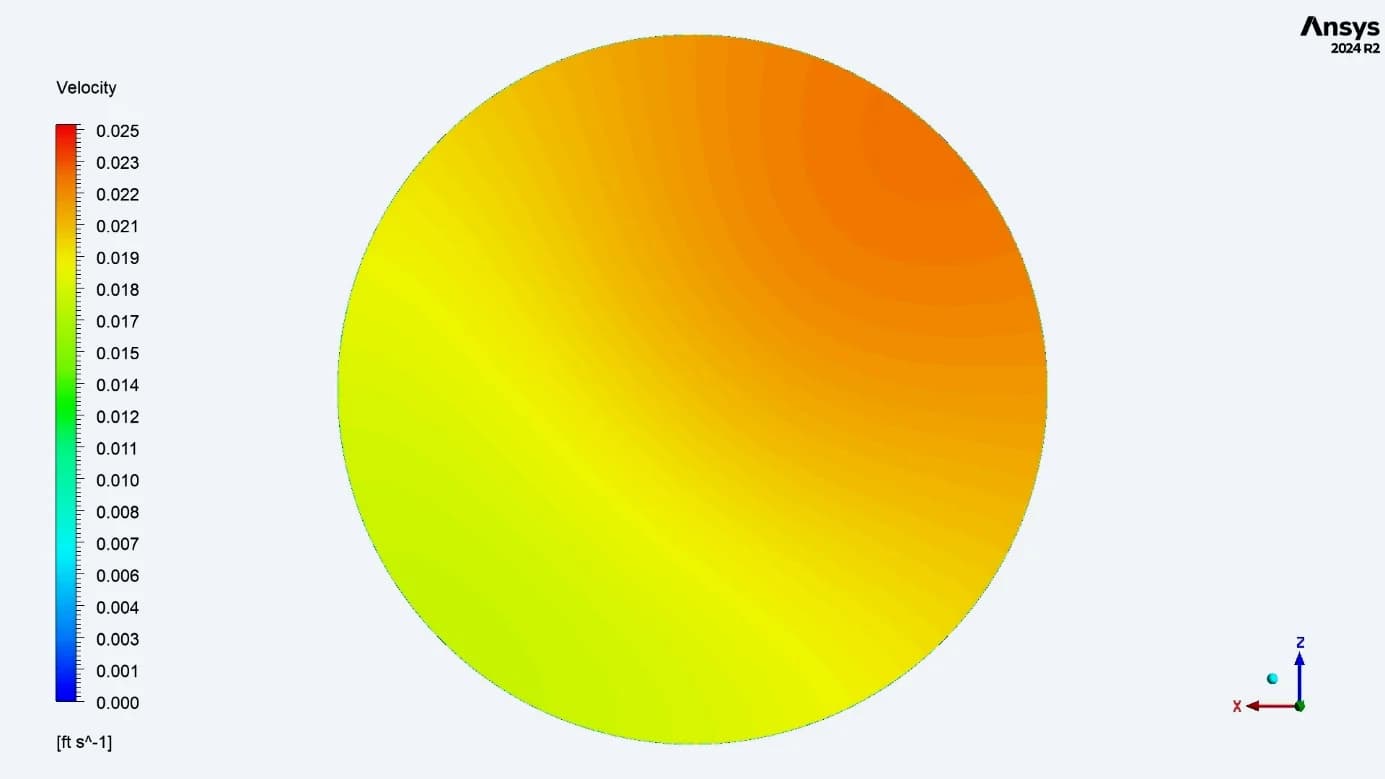
SEPTA / Lower velocity on the opposite side
At 25%, the CSI contour shows more even coverage across the section. In SEPTA, stronger flow remains toward the inlet-side region, while the opposite side carries less flow Matched display limit: 0.025 ft/s (1.5 ft/min). Values above the limit share the top colour
14 / BED COMPARISON AT 50%
The mid-bed section quantifies the difference
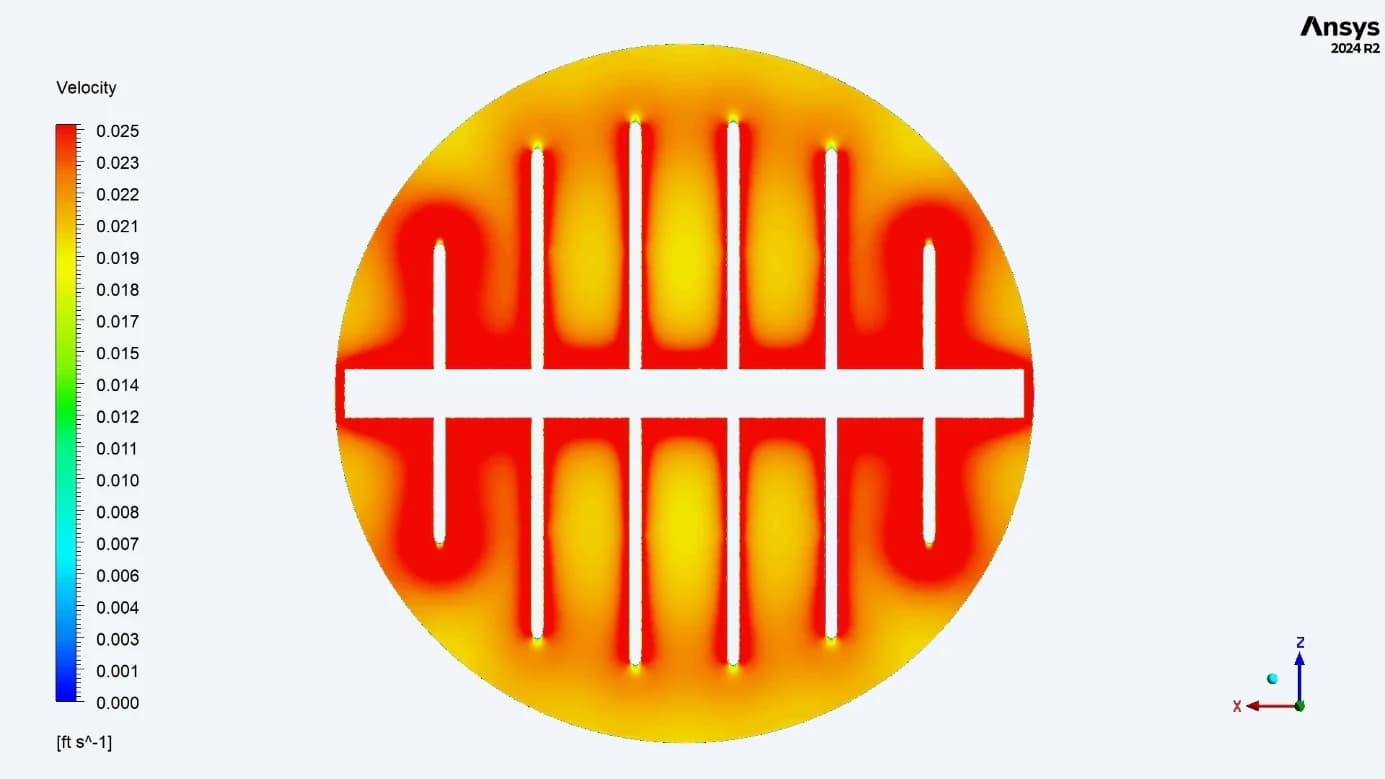
CSI / Reported range: 0.022–0.025 ft/s
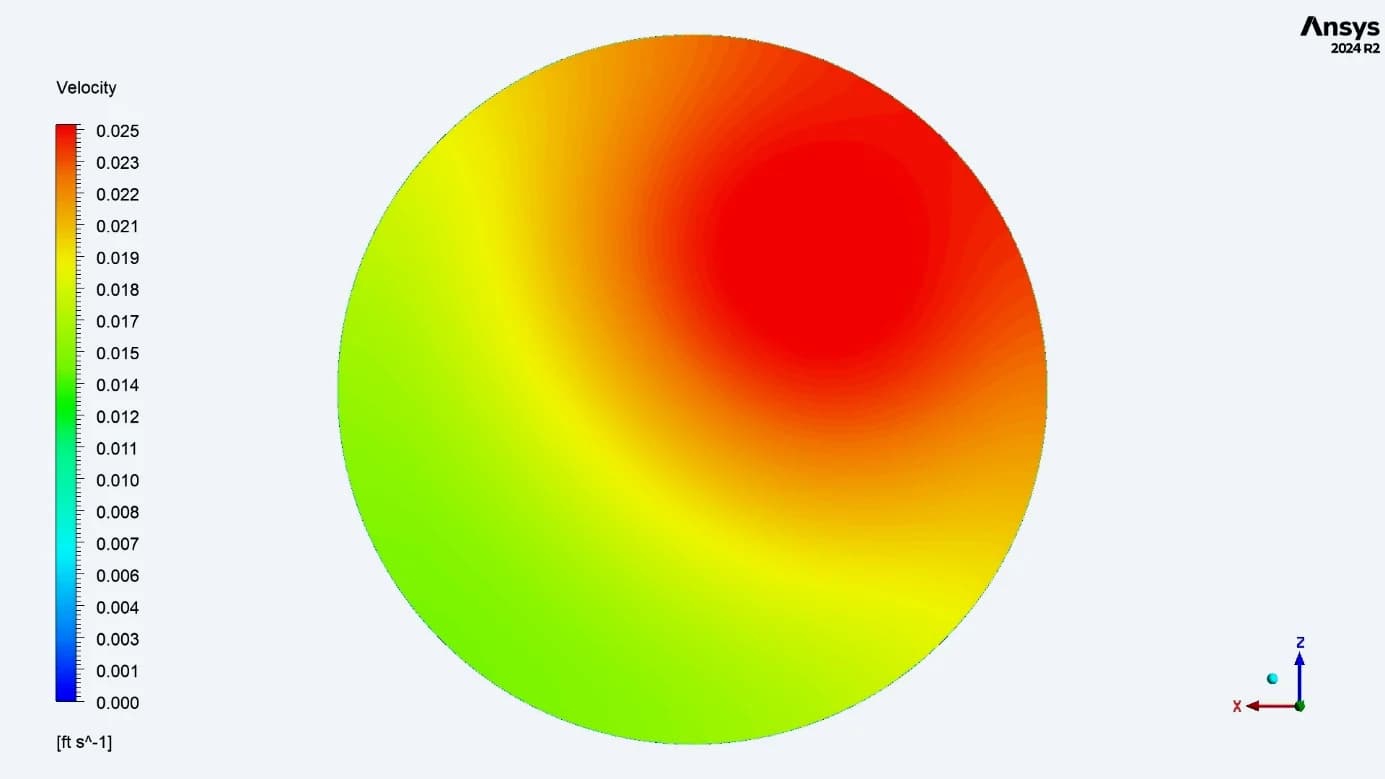
SEPTA / Reported range: 0.011–0.025 ft/s
At 50%, CSI shows higher velocities around the collector tubes and lower values toward the sides. SEPTA shows a wider reported range, with the highest-velocity region concentrated at one end. These ranges are the report’s observations on the clipped contour display Matched display limit: 0.025 ft/s (1.5 ft/min). Values above the limit share the top colour
15 / BED COMPARISON AT 75%
Collector geometry becomes more visible at 75%
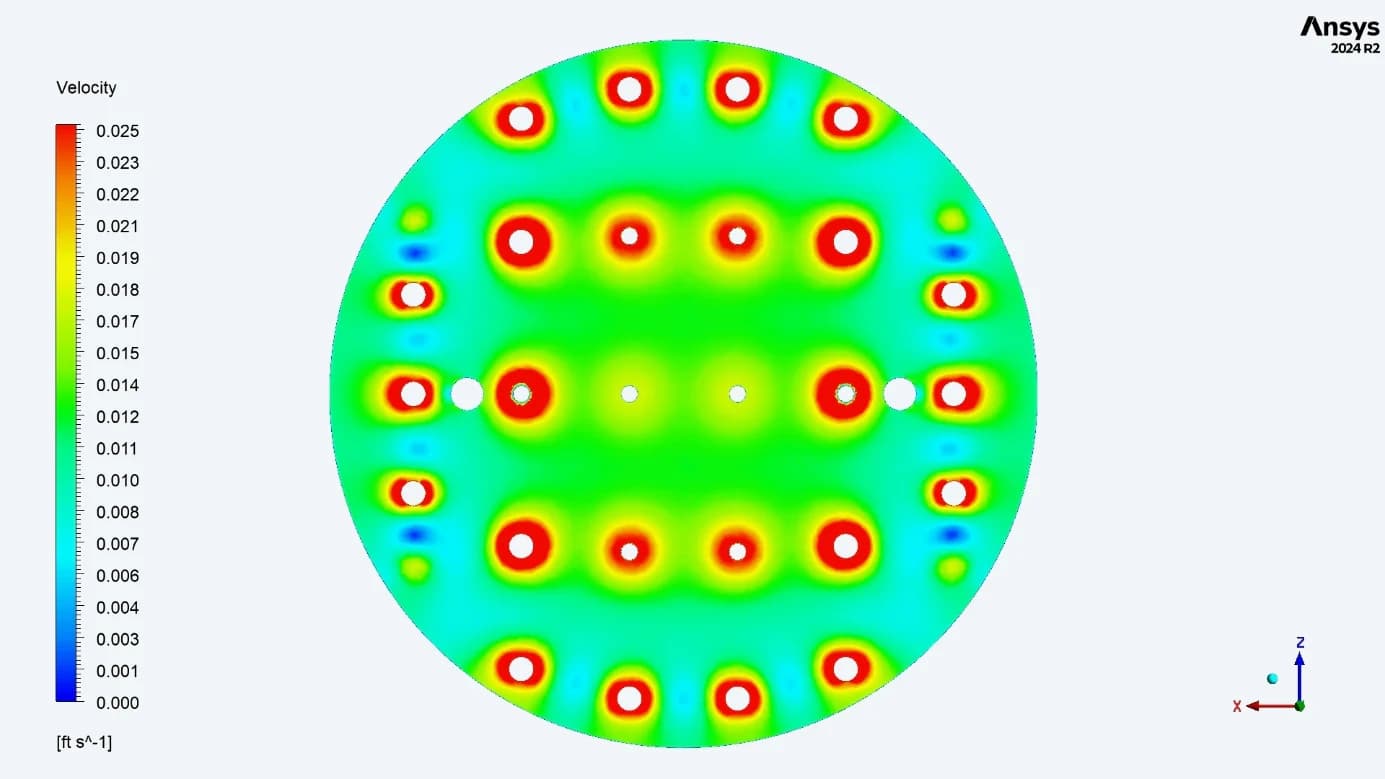
CSI / Local peaks around the filters
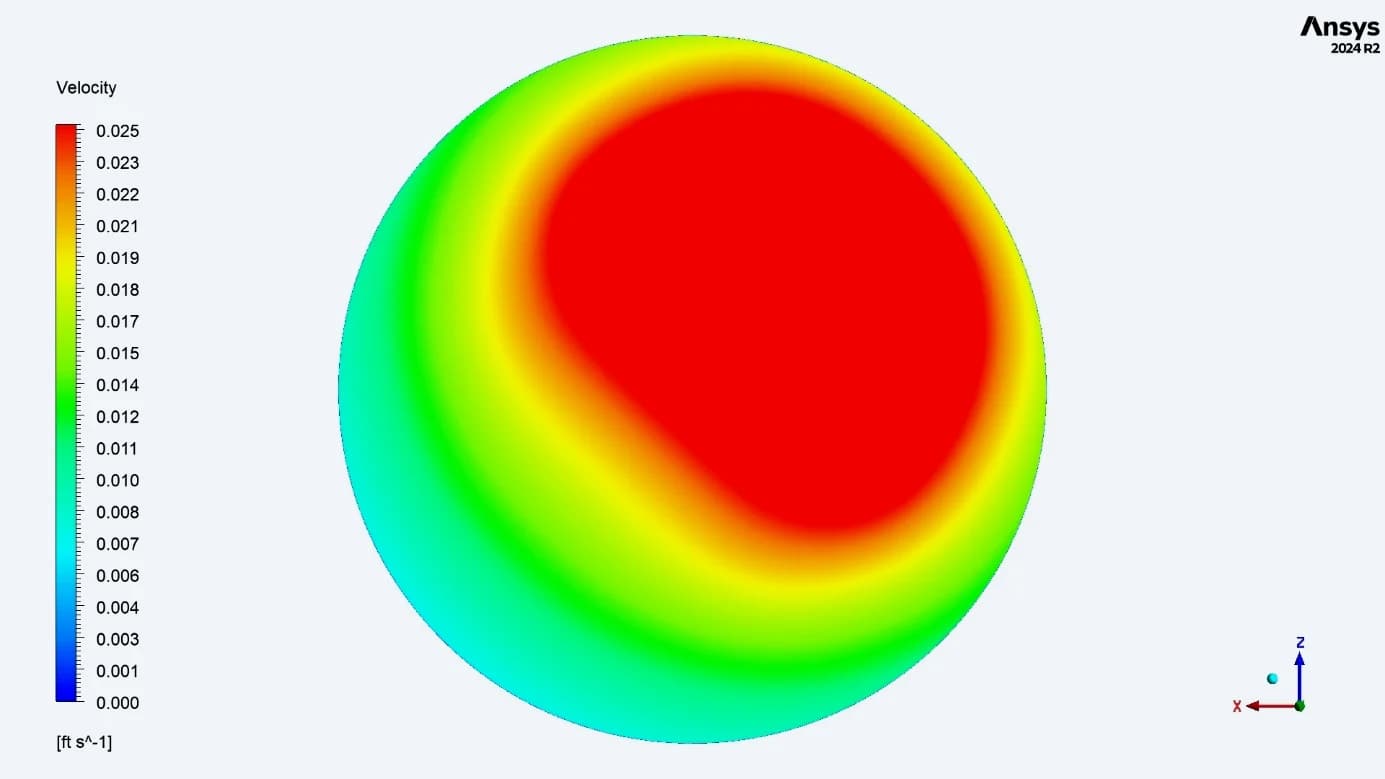
SEPTA / One-sided high-velocity region
The CSI section shows higher velocities near the outlet filters and local low-speed regions between them. The SEPTA section continues to show a stronger velocity region on one side. CSI’s distribution advantage still includes local stagnation regions Matched display limit: 0.025 ft/s (1.5 ft/min). Values above the limit share the top colour
16 / BED COMPARISON AT 95%
The lower geometry shapes the final bed section
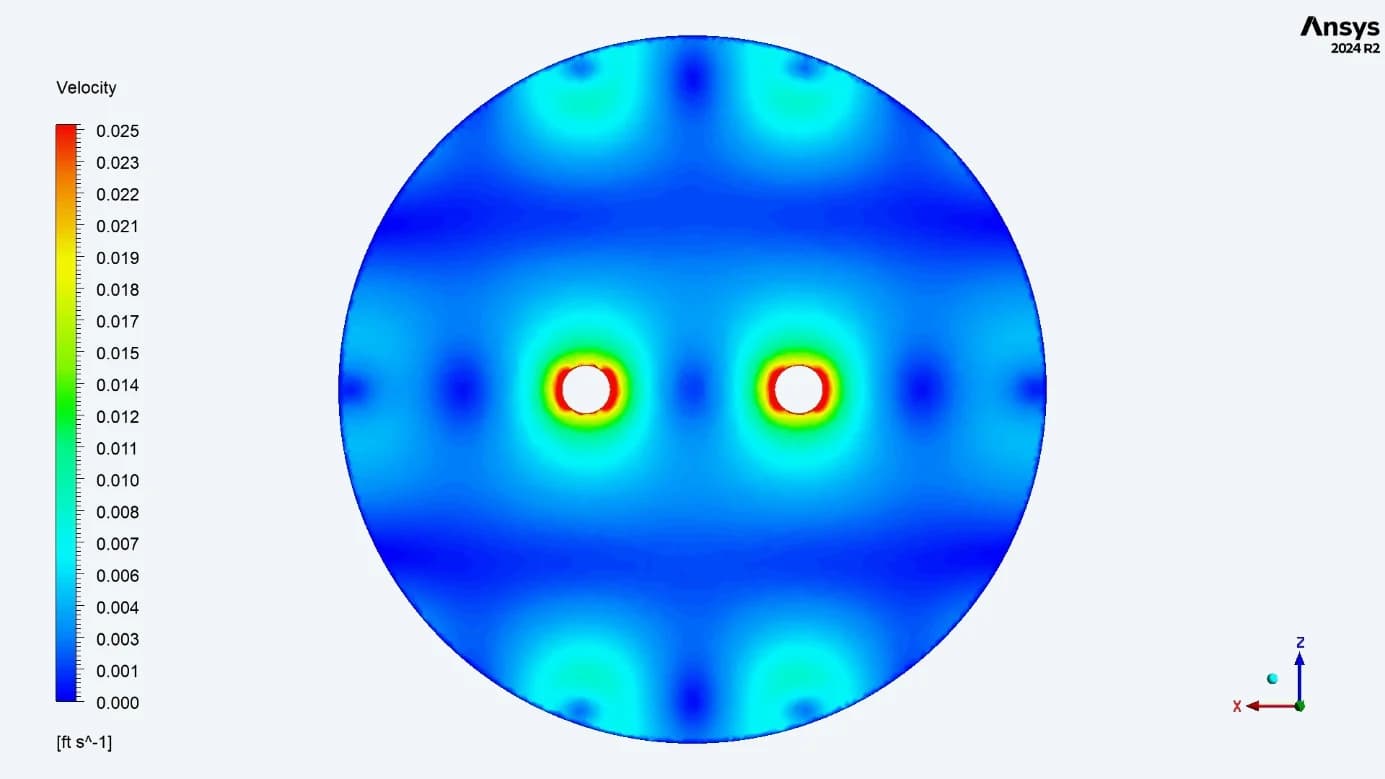
CSI / Flow converges toward the discharge paths
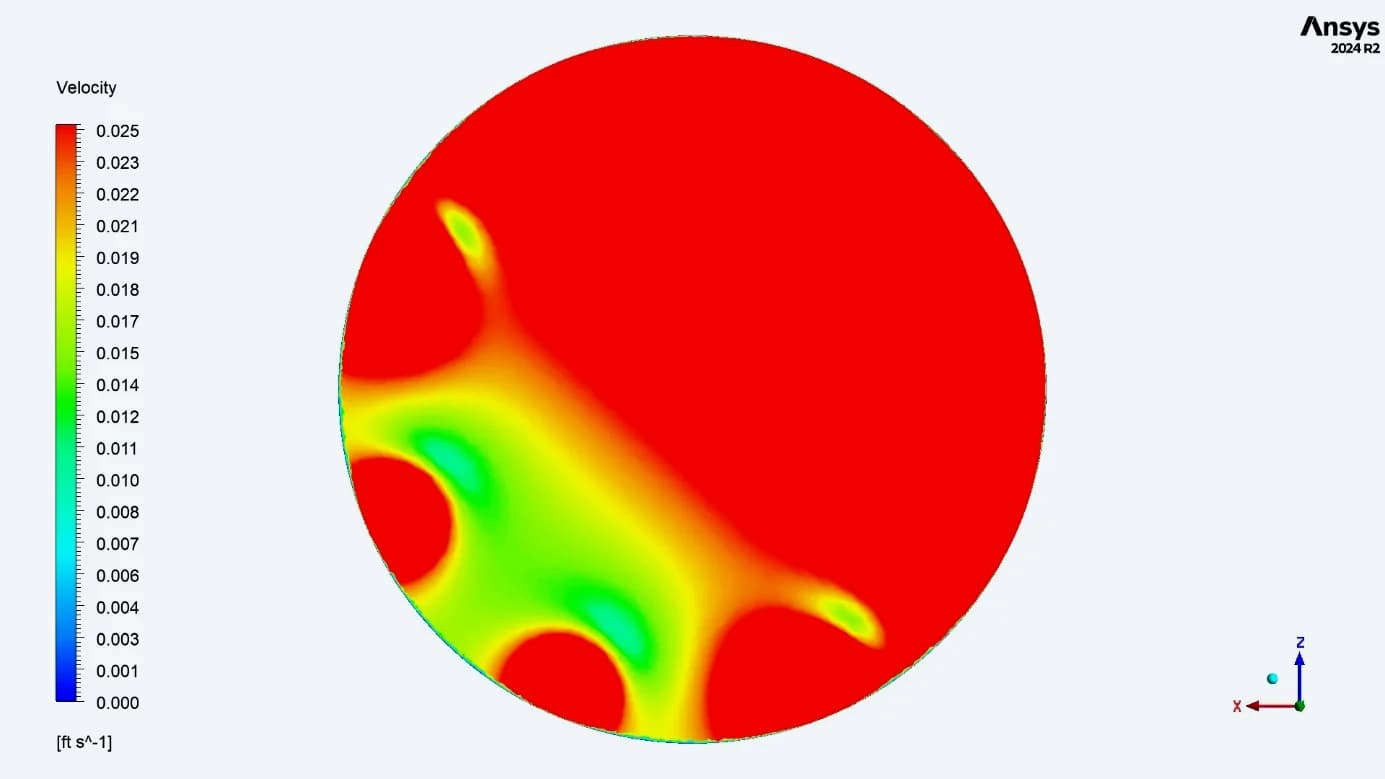
SEPTA / Uneven approach to the bottom ports
Near 95%, flow in CSI converges toward its lower discharge paths. In SEPTA, the reduced local area and bottom-header geometry influence the velocity distribution as water approaches the different outlet connections Matched display limit: 0.025 ft/s (1.5 ft/min). Values above the limit share the top colour
17 / OUTLET DISTRIBUTION
Two similar CSI outlet patterns, eight uneven SEPTA ports
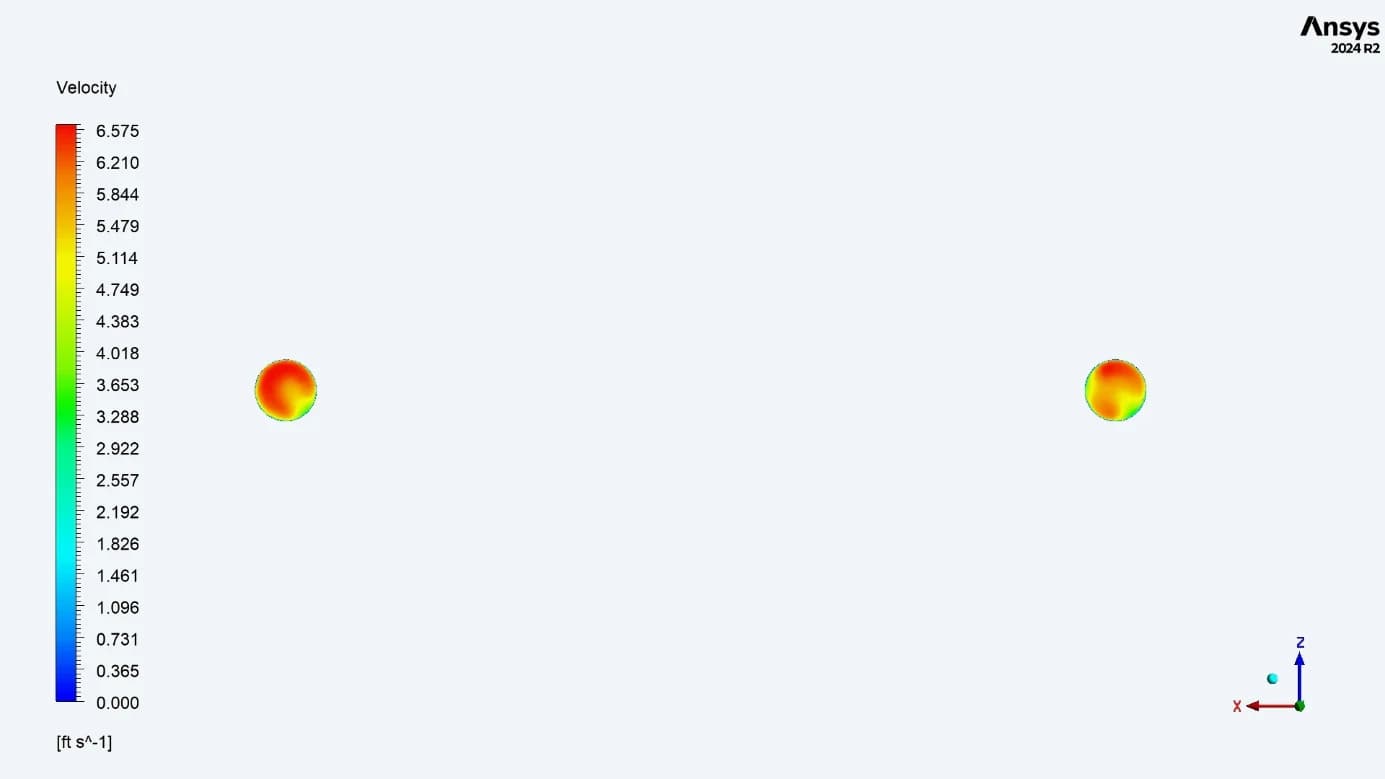
CSI / Similar patterns at both outlets
The final report identifies a consistent velocity pattern across the two outlet sections
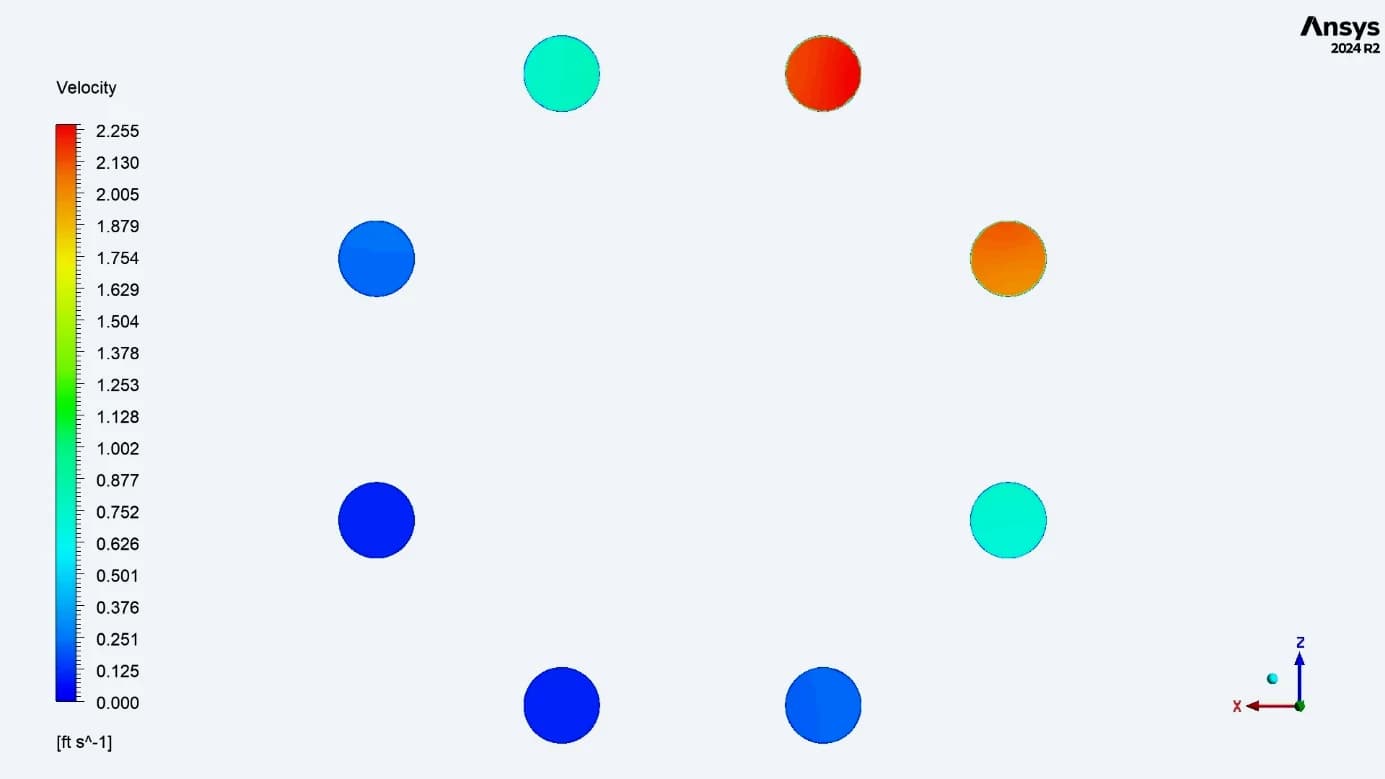
SEPTA / Unequal velocities between ports
The reported port annotations range from 0.13 to 2.25 ft/s. Four of the eight ports carry the lower annotated values of 0.13 or 0.25 ft/s
| SEPTA ANNOTATED VELOCITY | 2.25 ft/s | 2.00 ft/s | 0.85 ft/s | 0.25 ft/s | 0.13 ft/s |
|---|---|---|---|---|---|
| Number of ports with this label | 1 | 1 | 2 | 2 | 2 |
The two original plots use different colour scales. Port annotations are local velocity readings, not integrated flow-rate measurements.
18 / COMPARATIVE FINDINGS
The hydraulic differences across the complete flow path
| LOCATION | CSI OBSERVATION | SEPTA OBSERVATION |
|---|---|---|
| Inlet region | Four porous openings spread the flow | Upward jet impinges on the upper head |
| Upper bed: 10% and 25% | More even distribution across the section | Flow remains biased toward one side |
| Mid-bed: 50% | Reported range 0.022–0.025 ft/s | Reported range 0.011–0.025 ft/s |
| Lower bed: 75% and 95% | Collector-related peaks and local low-speed zones | Persistent asymmetry near the bottom connections |
| Outlet sections | Similar pattern at two outlets | Uneven velocities across eight ports |
The two original plots use different colour scales. Port annotations are local velocity readings, not integrated flow-rate measurements.
PROJECT OUTCOME
A documented basis for filtration-tank design review
Engineering model
Geometry and mesh views document the flow domain, inlet and collector arrangements
Results package
Velocity and total-pressure contours connect the local flow behaviour to the tank geometry
Design comparison
Matched bed-level views and outlet results identify uneven flow and the regions needing attention
Clear evidence of how the internal layout distributes flow
The work showed where the two tank designs distribute flow evenly and where they leave lower-velocity regions. The client received a detailed hydraulic comparison to guide review of the distributor and collection arrangements
The findings describe the simulated hydraulic behaviour at 1,000 GPM. The reports do not quantify contaminant removal, media service life or energy savings