Structural FEA of an Elevated Container
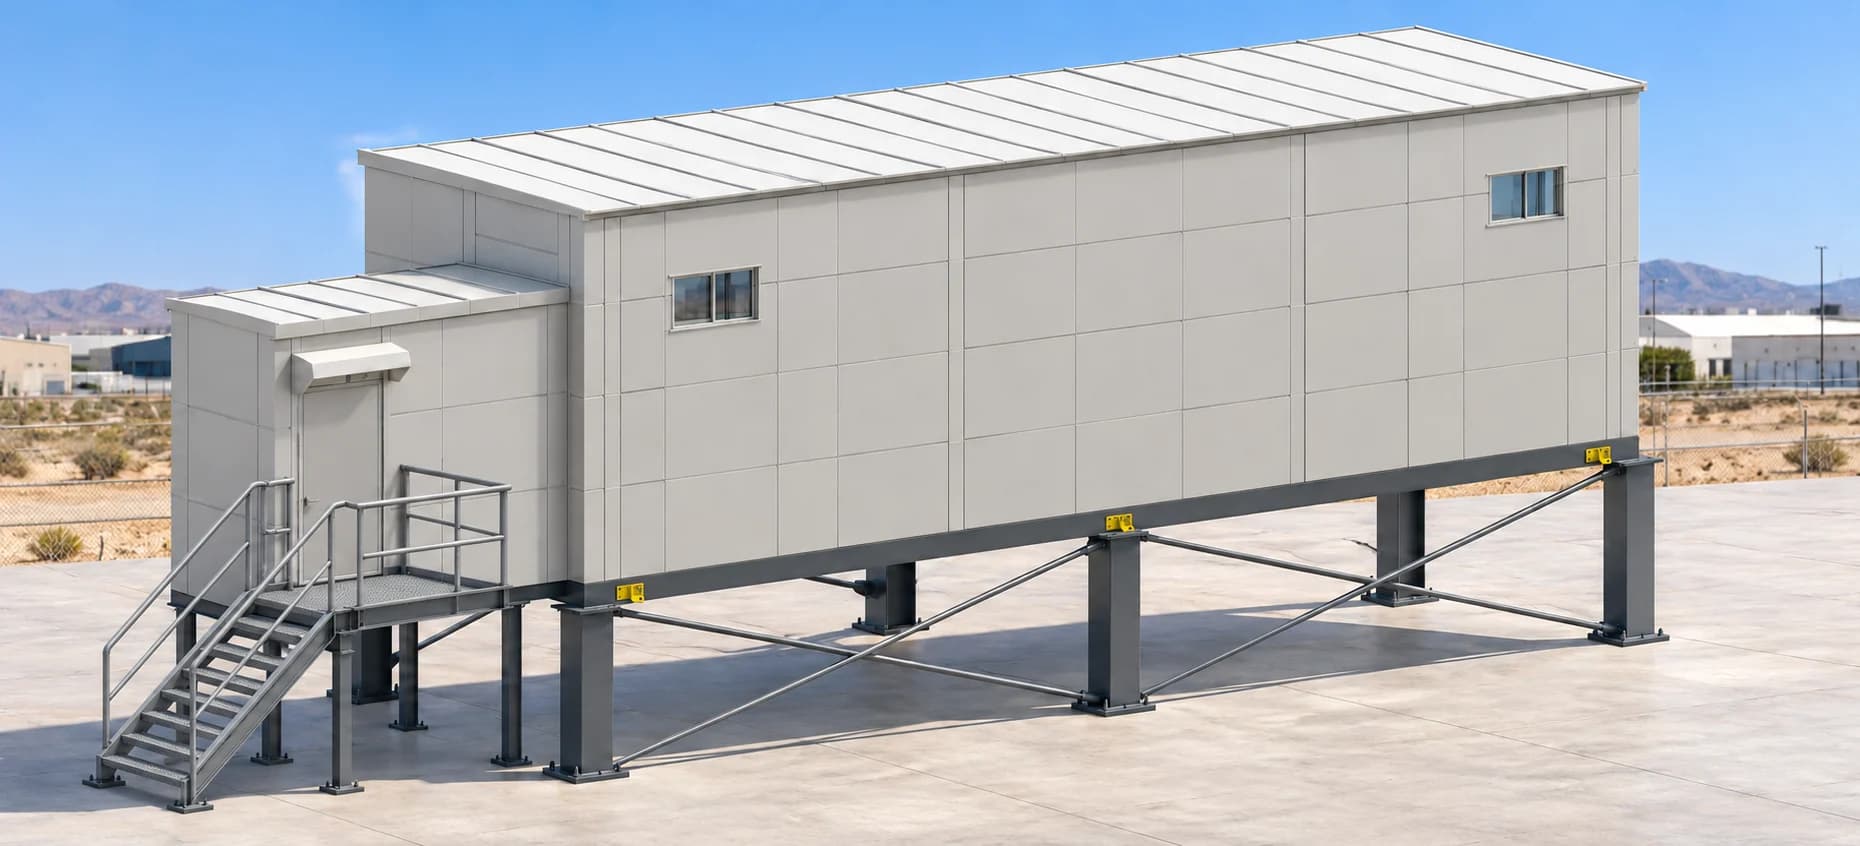
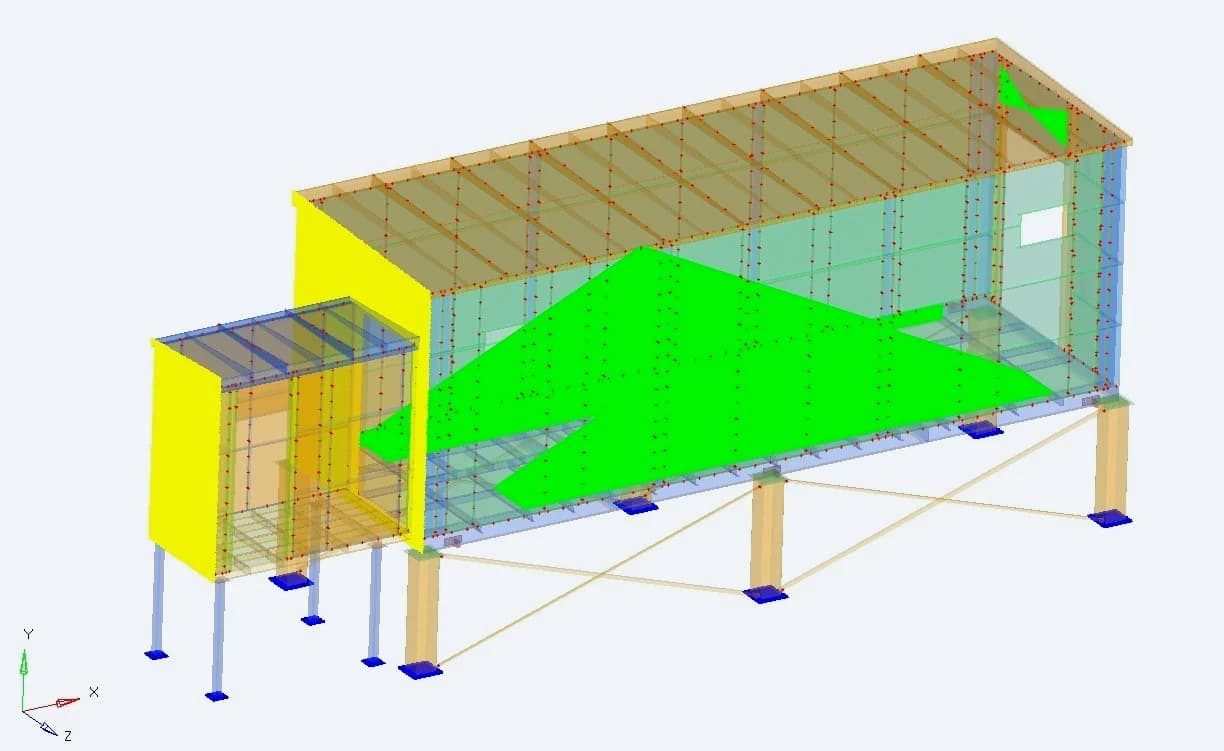
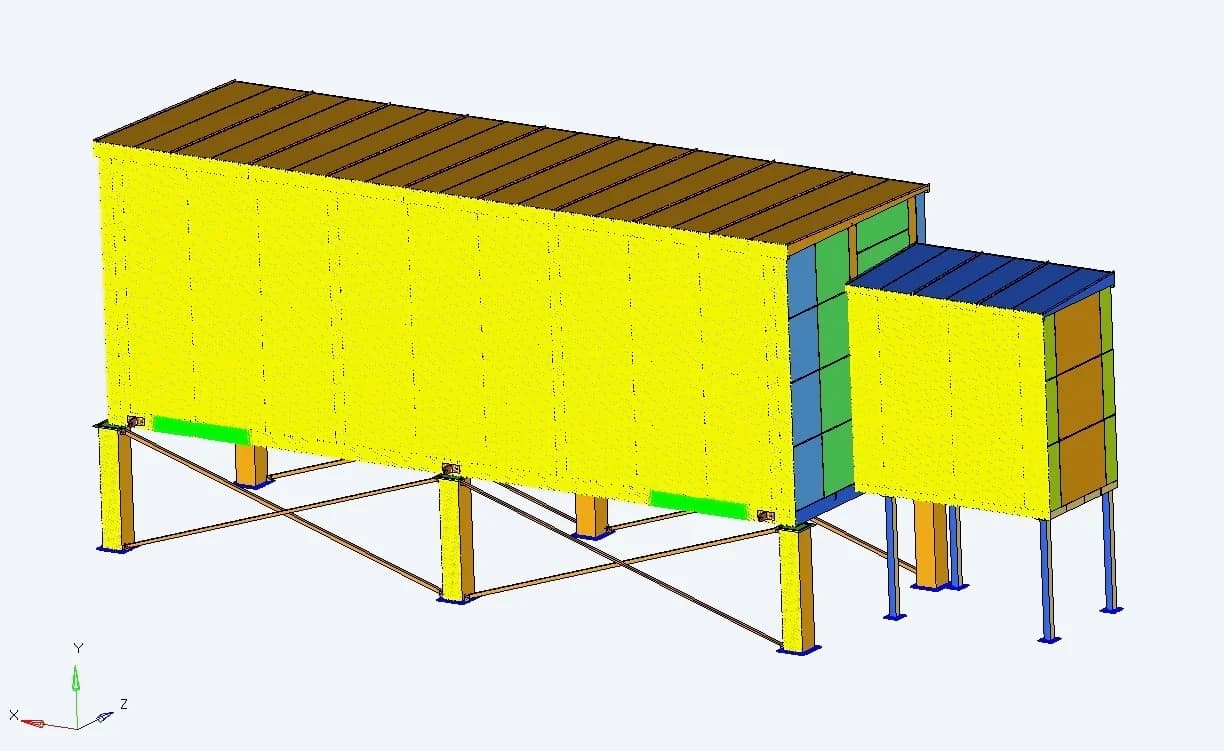
NEOM container, supports and access platforms
FINITE ELEMENT ANALYSIS
Structural FEA of an Elevated Container
- Requirement
Assess the complete load path
Evaluate the enclosure, equipment floor, roof, front cabin and supporting steelwork under the loading conditions defined for the electrical substation
- Challenge
Different loads, different responses
Account for equipment mass, occupancy, wind in two directions, seismic actions and a lifting condition that changes how the container is supported
- Deliverables
Results for the engineering team
An FE model, component stress and deformation assessments, a separate platform study and reaction-force schedules for foundation coordination
01 / THE STRUCTURE
An elevated enclosure with a separate front cabin
The model combines a long electrical enclosure with a smaller projecting cabin. The container floor carries the installed equipment, while columns and diagonal bracing transfer loads to the ground connections. The cabin has its own support arrangement, making it important to assess both parts of the assembly
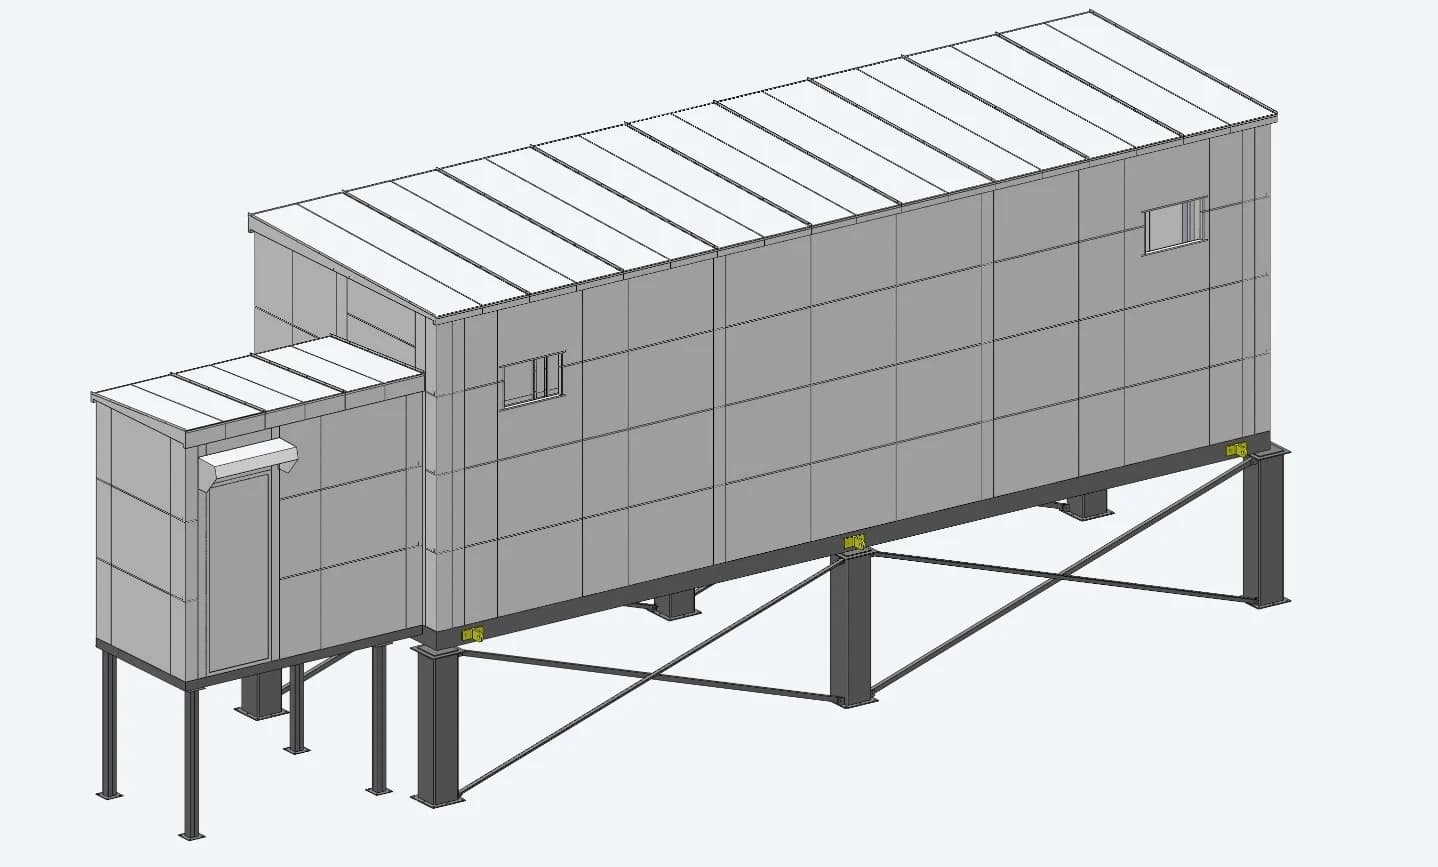
The assessed system
Container base frame Wall panels and roof Front cabin and floor Columns and bracing Welds and bolt connections Lifting attachment regions
Original project geometry, with the elevated support frame visible beneath the enclosure
02 / ANALYSIS DEVELOPMENT
Preparing the assembly for structural analysis
The supplied 3D model was developed into an FE assembly in HyperMesh and solved in ANSYS Mechanical APDL. Thin sections were represented using midsurfaces and shell elements. Thick parts used solid elements, and the model connected the structural parts at their intended interfaces
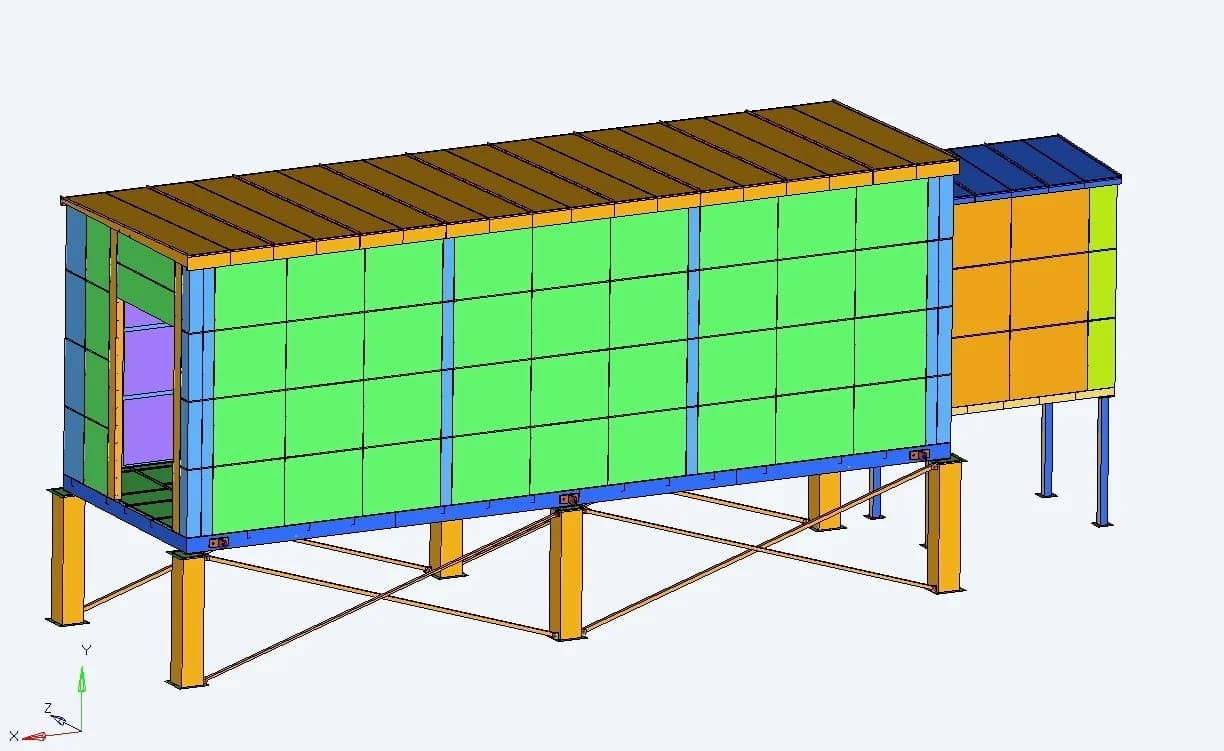
Component representation
The assembly view separates the walls, roof, base and supporting structure so their contribution can be traced through the analysis
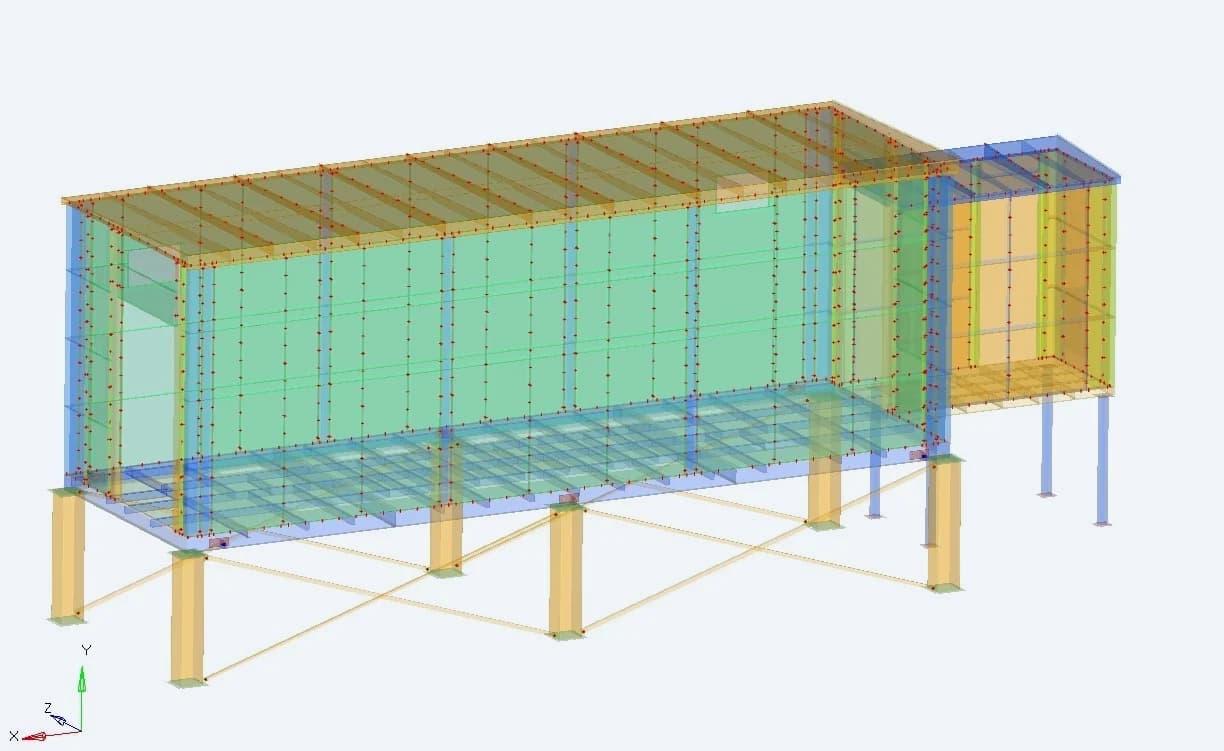
Internal connectivity
The transparent view reveals internal members and payload connections that are hidden by the exterior panels
03 / MESH & CONNECTIONS
Resolving the floor, panels and load-carrying joints
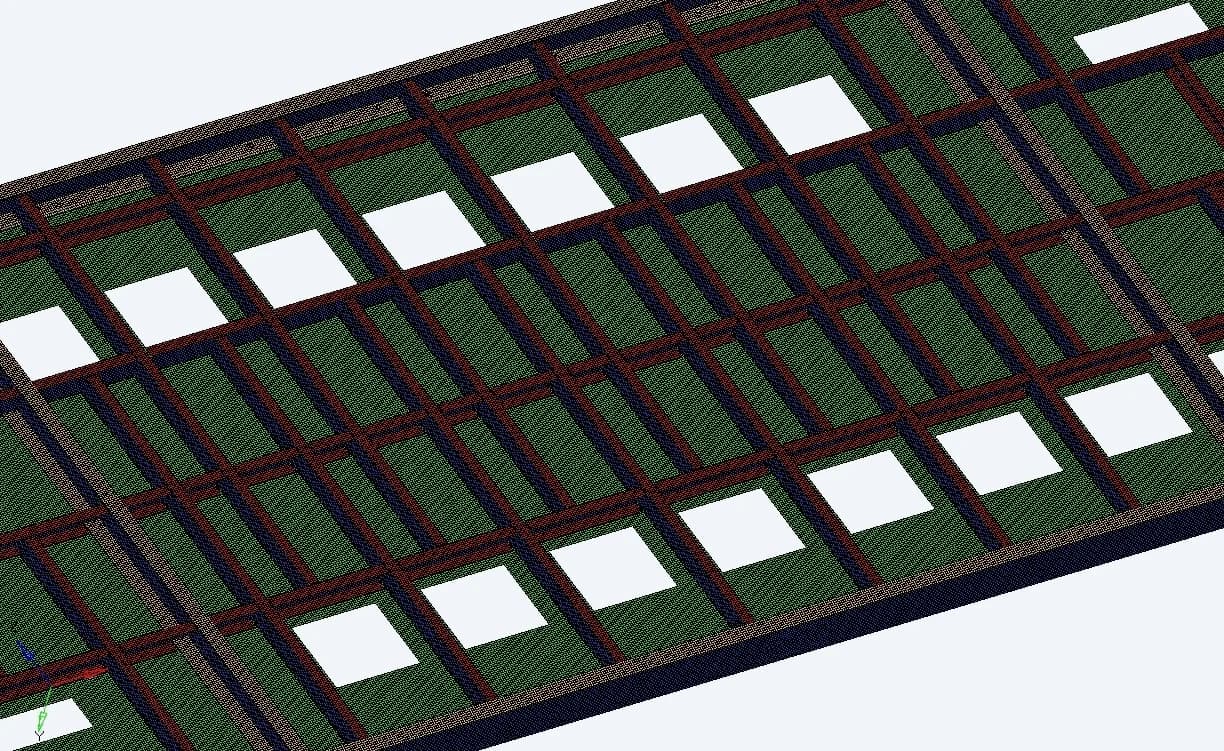
Base-frame mesh
The floor and equipment-supporting members form a primary load path. Their mesh represents the spans and intersections beneath the enclosure
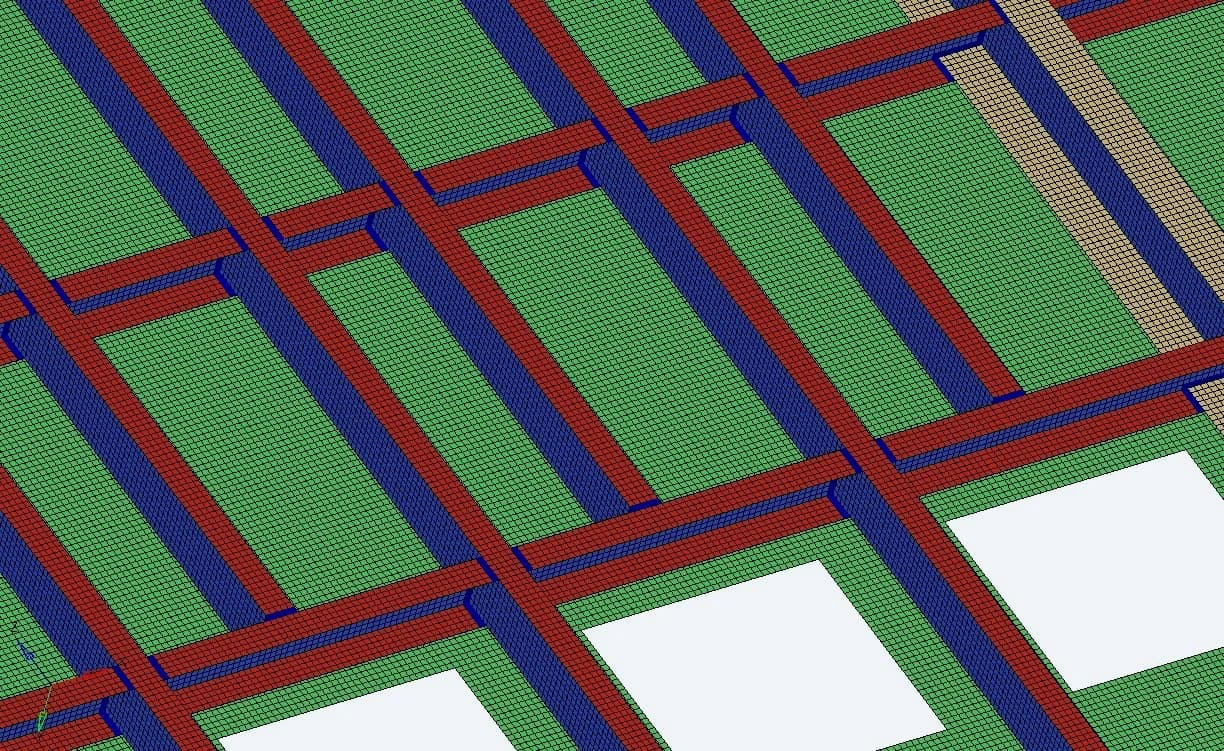
Welded interfaces
Connectivity at welded locations transfers load between intersecting members. The report models these joints as continuous connections
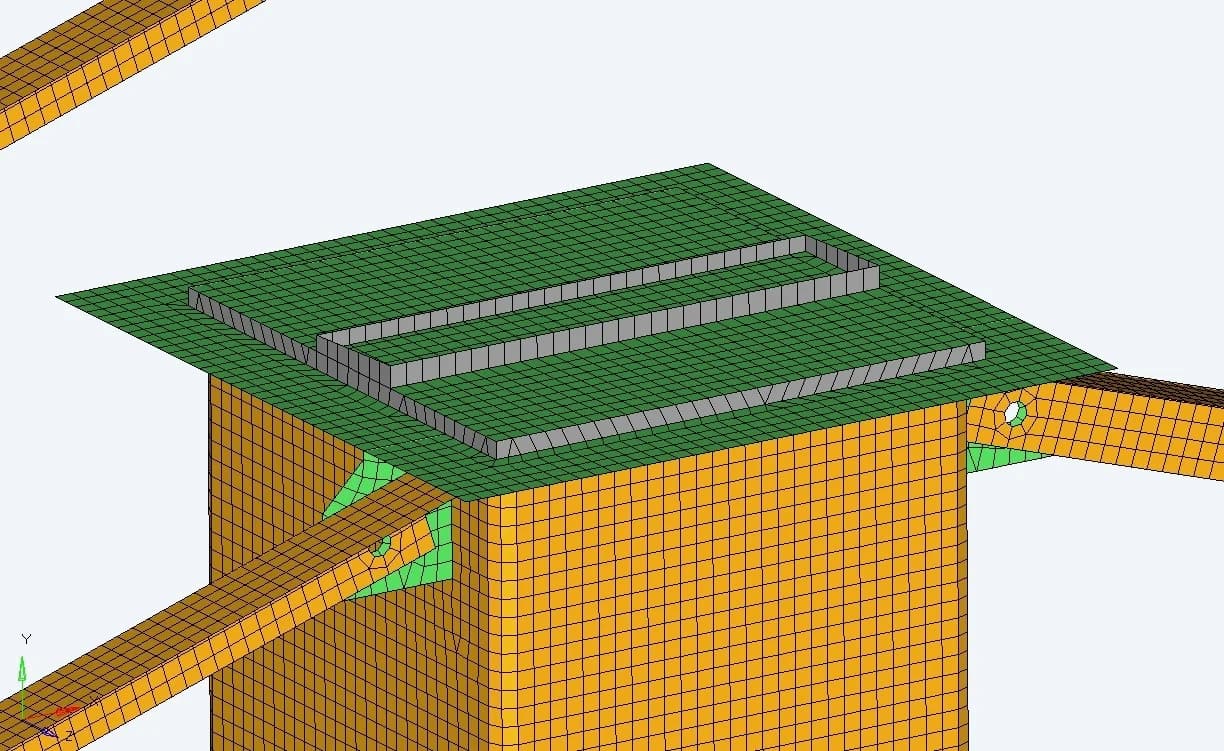
Column-head connection
The mesh follows the support-to-base interface, where loads enter the elevated steelwork
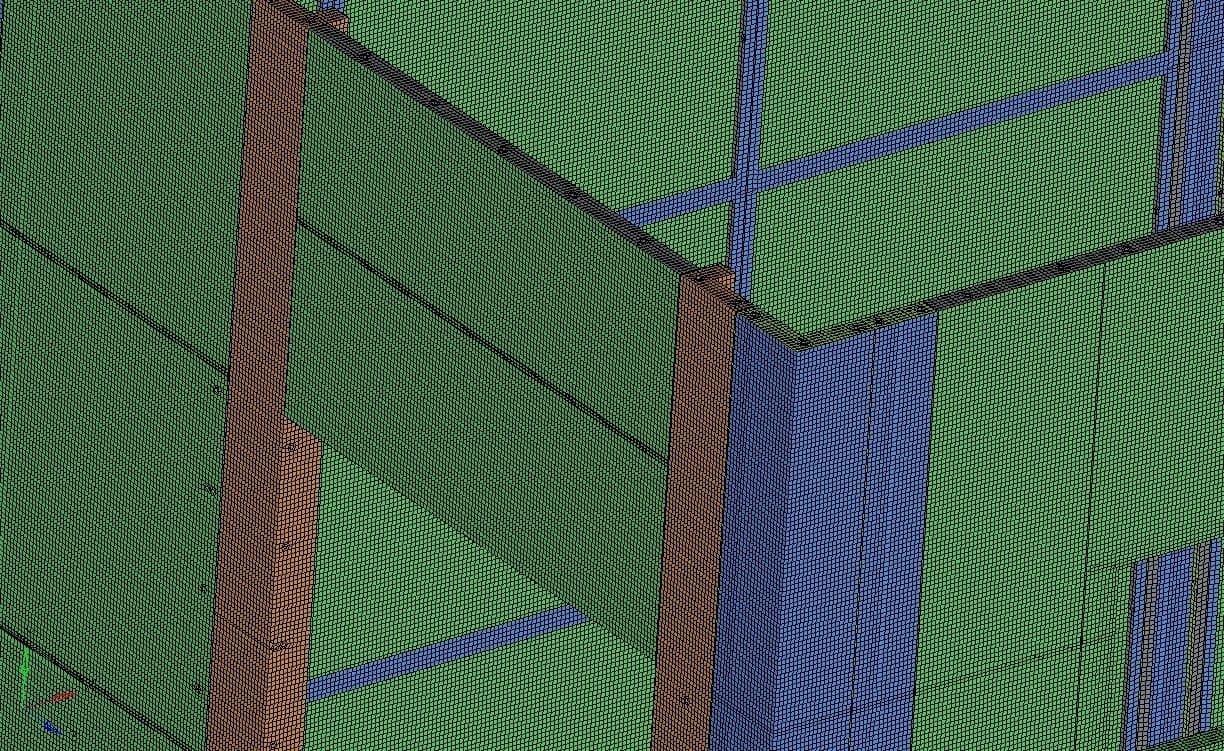
Wall-panel connections
Panel edges, framing and corner interfaces are represented to examine the enclosure response
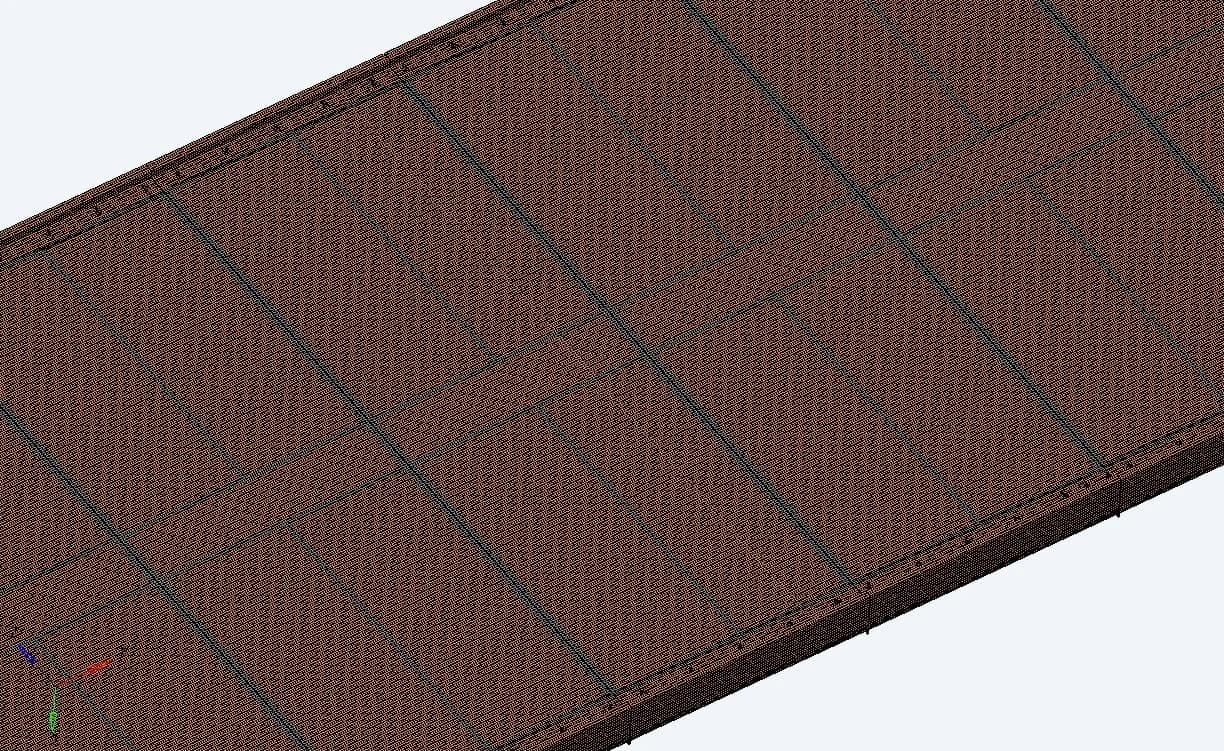
Roof and supporting members
Shell modelling captures the thin roof sections and the members that support them
Bolts were represented by one-dimensional beam elements. Equipment masses were represented by point masses coupled to their mounting locations. The assessment assumes homogeneous material and ideal joints, and excludes ageing and corrosion effects
04 / PAYLOAD & BOUNDARY CONDITIONS
Applying mass and support conditions to the model
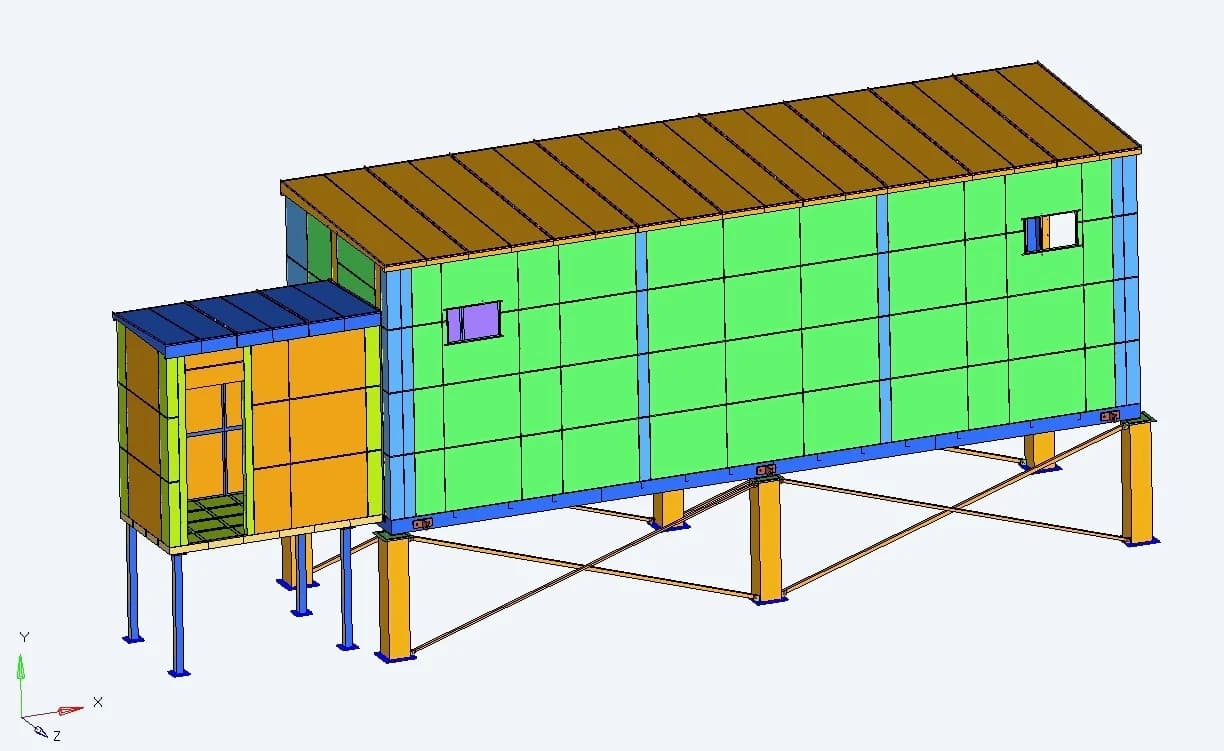
Installed support arrangement
The service cases use six main-container supports and four cabin supports. The illustrated restraints establish how reactions develop at the base
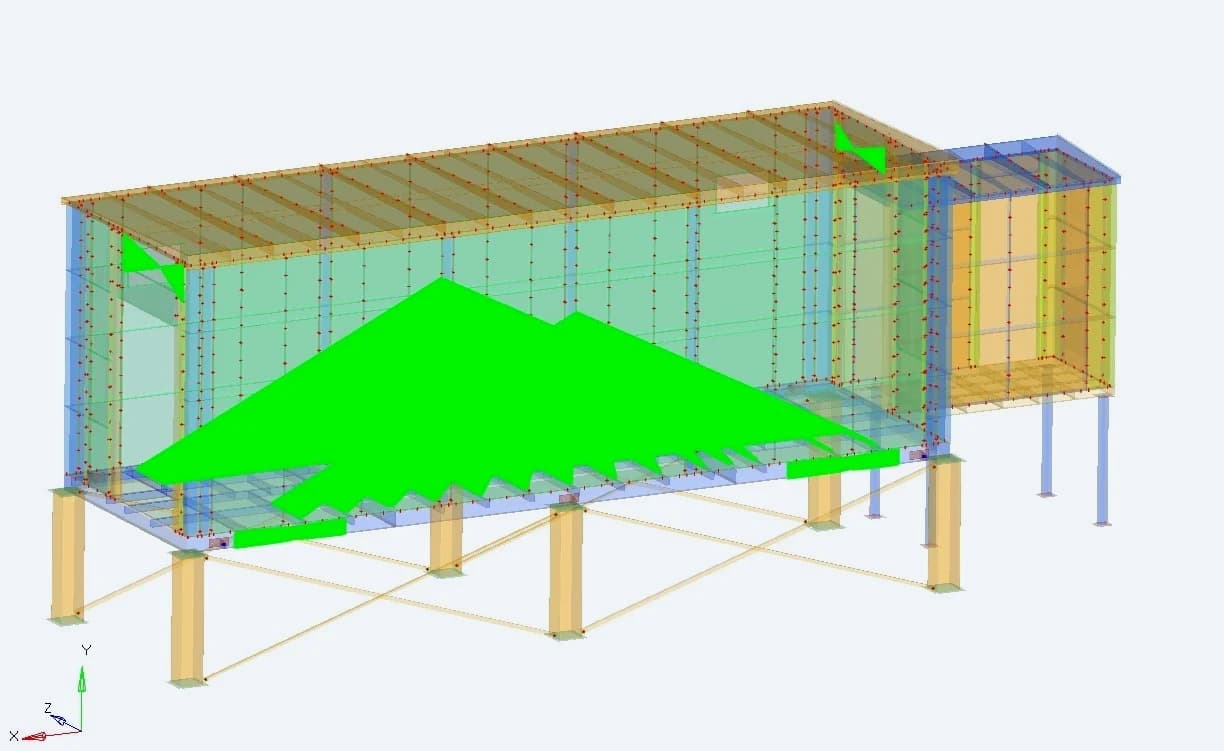
Equipment mass at its mountings
The model includes two 2,200 kg control panels, air-conditioning units and distribution boards, in addition to the structural mass
- Recorded dead-load mass
- 13,813 kg
- Specified wind speed
- 46 m/s
- Model material yield strength
- 350 MPa
05 / LOADING PROGRAMME
Seven structural loading conditions
| CONDITION | APPLIED LOADING | SUPPORT BASIS |
|---|---|---|
| Dead load | Structural self-weight and equipment payloads | 6 + 4 base supports |
| Dead + live load | 5 kN/m² on walkway and 1 kN/m² on roof | 6 + 4 base supports |
| Wind, two directions | Dead load and wind corresponding to 46 m/s | 6 + 4 base supports |
| Seismic, two directions | Dead load and equivalent seismic action at 0.1125 g | 6 + 4 base supports |
| Lifting | Self-weight and the specified 2.54 kPa walkway load | Four lifting-lug restraints |
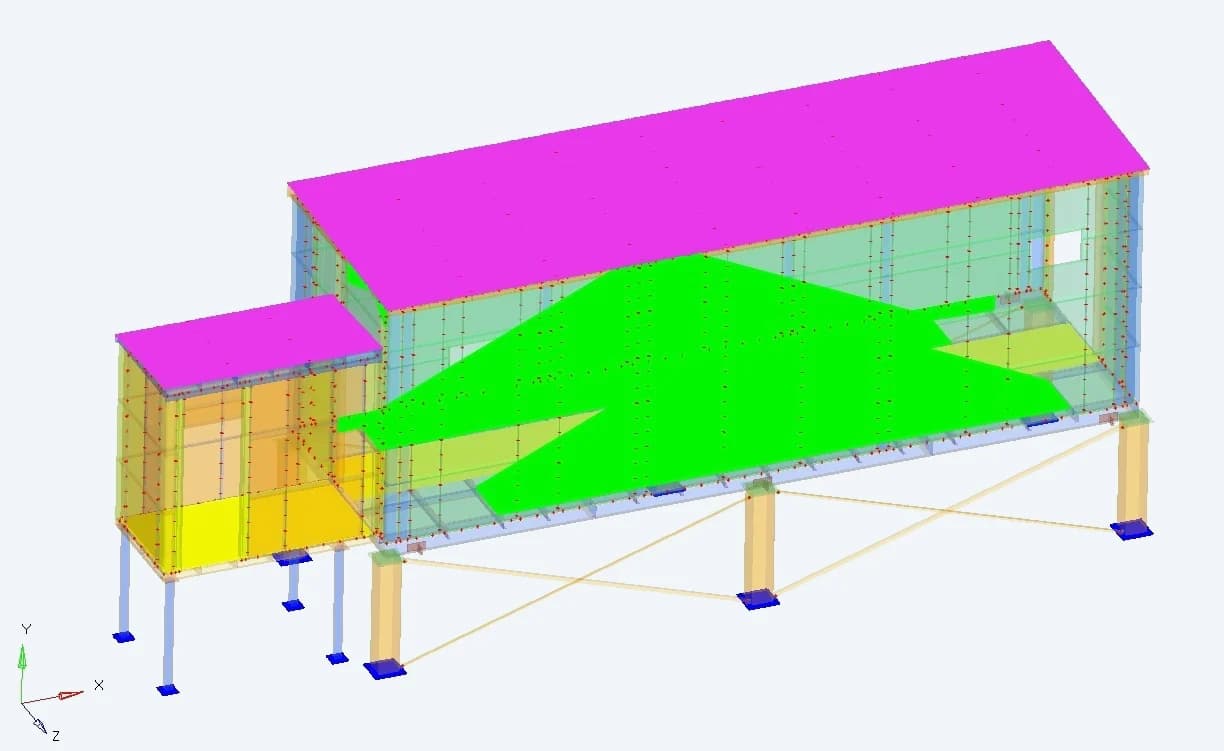
Walkway and roof loading
The live-load model applies distributed loads to the occupied floor and roof regions
Wind in one direction
Pressure acts on the exposed surfaces of the enclosure in the illustrated orientation
Wind in the other direction
The second orientation changes the loaded face and the response of the walls and supports
06 / DEAD & LIVE LOAD RESULTS
Checking the equipment-supporting base frame
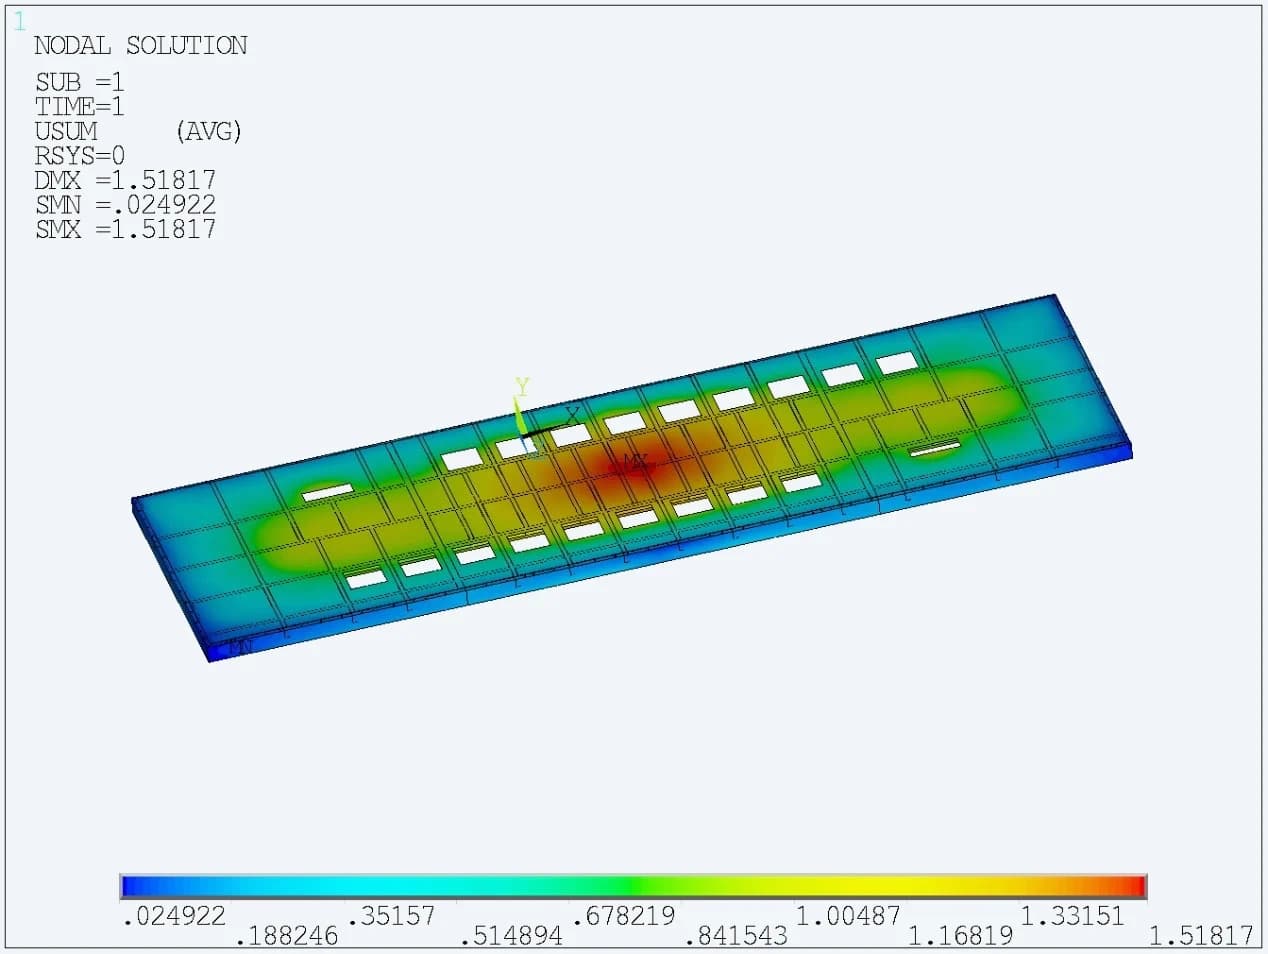
1.52 mm under dead load
The original contour reports 1.518 mm maximum base-frame deformation. The assessment uses an 8.88 mm beam-deflection limit
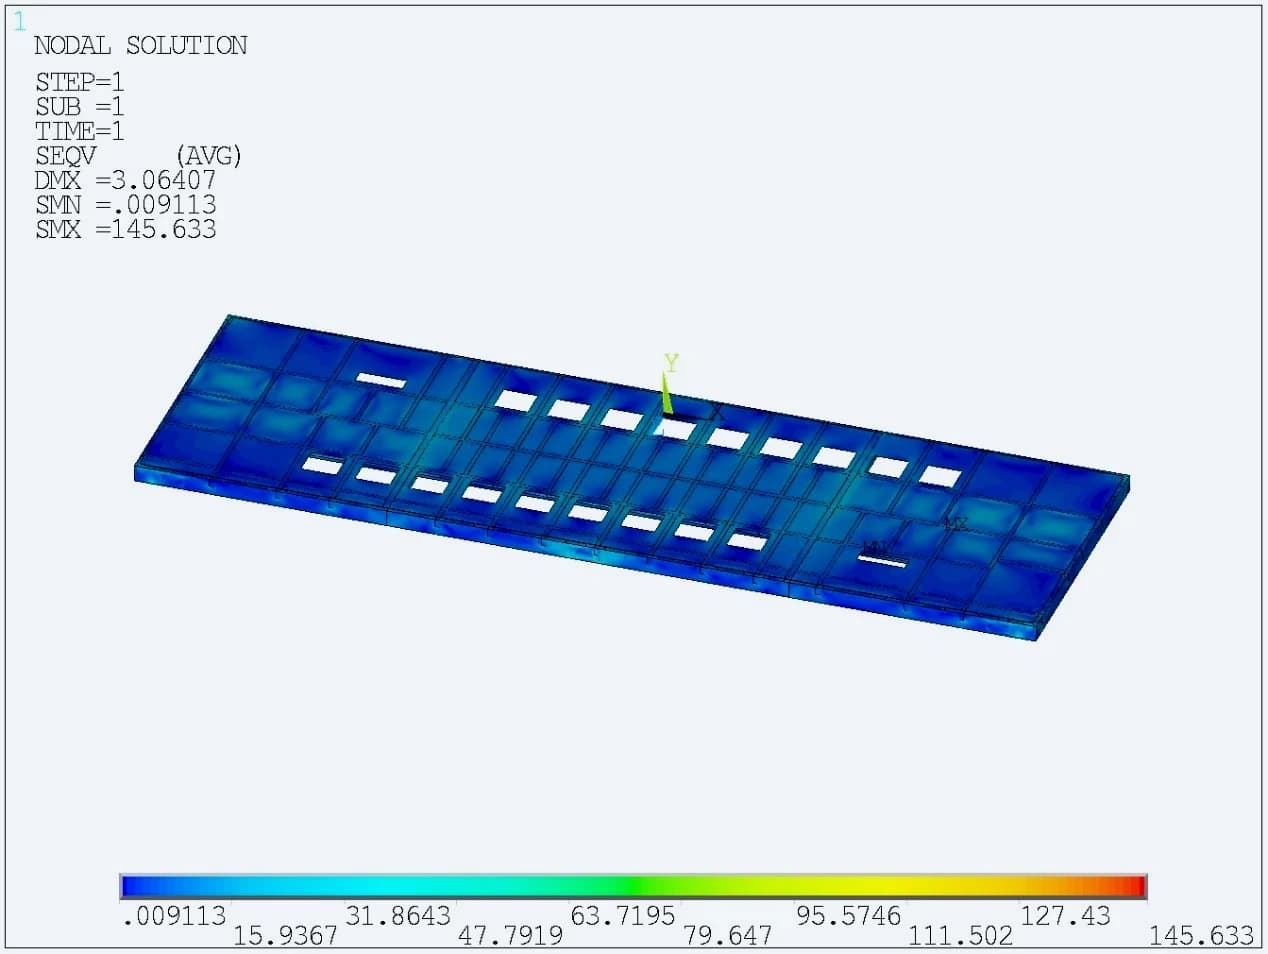
145.63 MPa with live load
Adding the specified walkway and roof loading raises the reported base-frame stress from 80.90 MPa to 145.63 MPa
The combined dead- and live-load case produces 3.06 mm base-frame deformation. Reviewing displacement alongside stress shows both the movement of the supporting members and the regions carrying the higher demand Result interpretation: the report excludes singularities and local peaks when stating some assessment stresses. Original contour legends are retained so the displayed solver values remain visible
07 / WIND RESPONSE
Comparing movement in the two wind cases
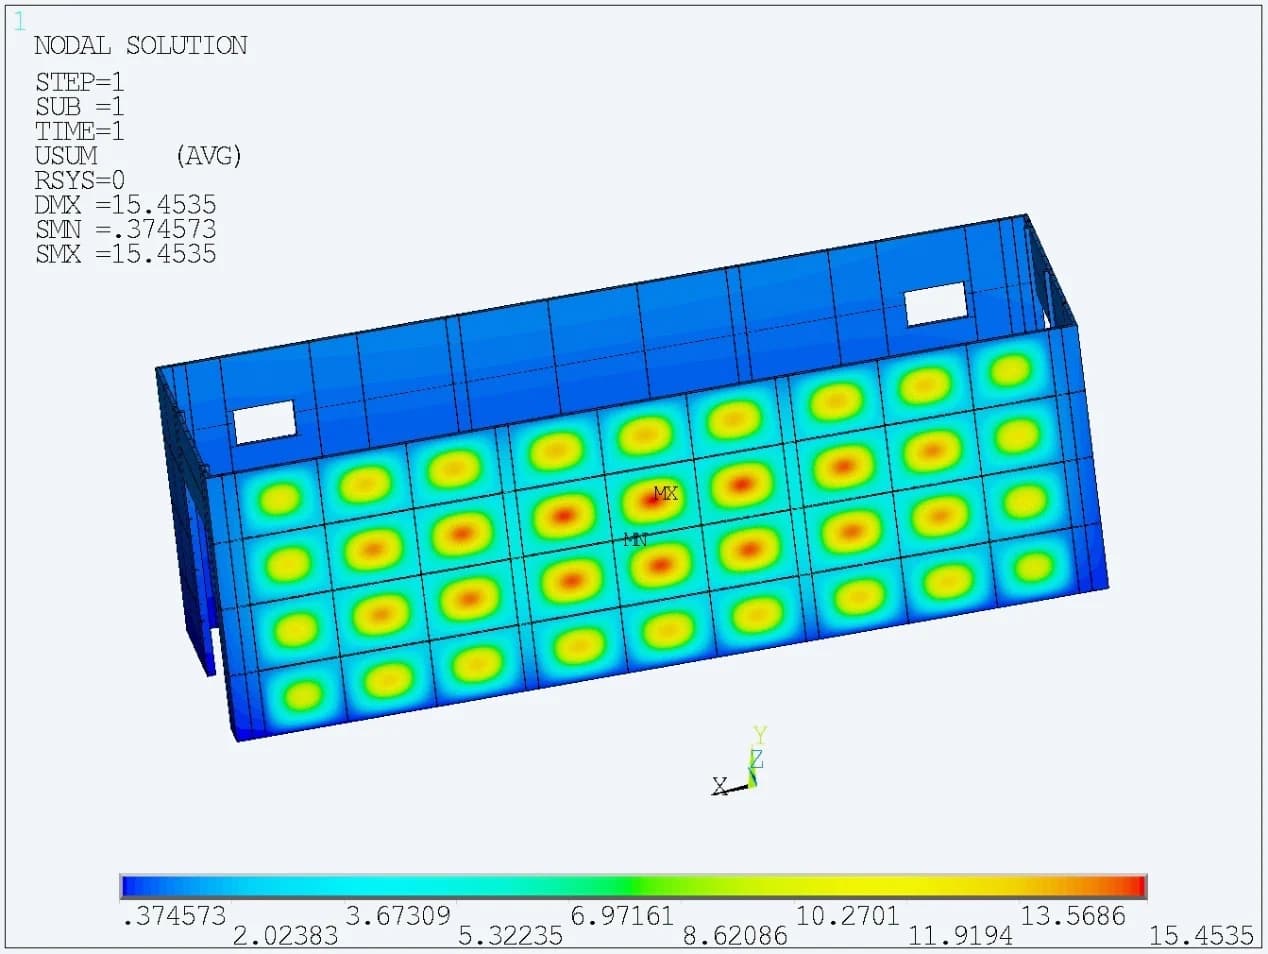
15.45 mm in wind case WL1
The deformation pattern shows the wall and frame response for the first wind case. The report compares this movement with a 25.5 mm horizontal limit
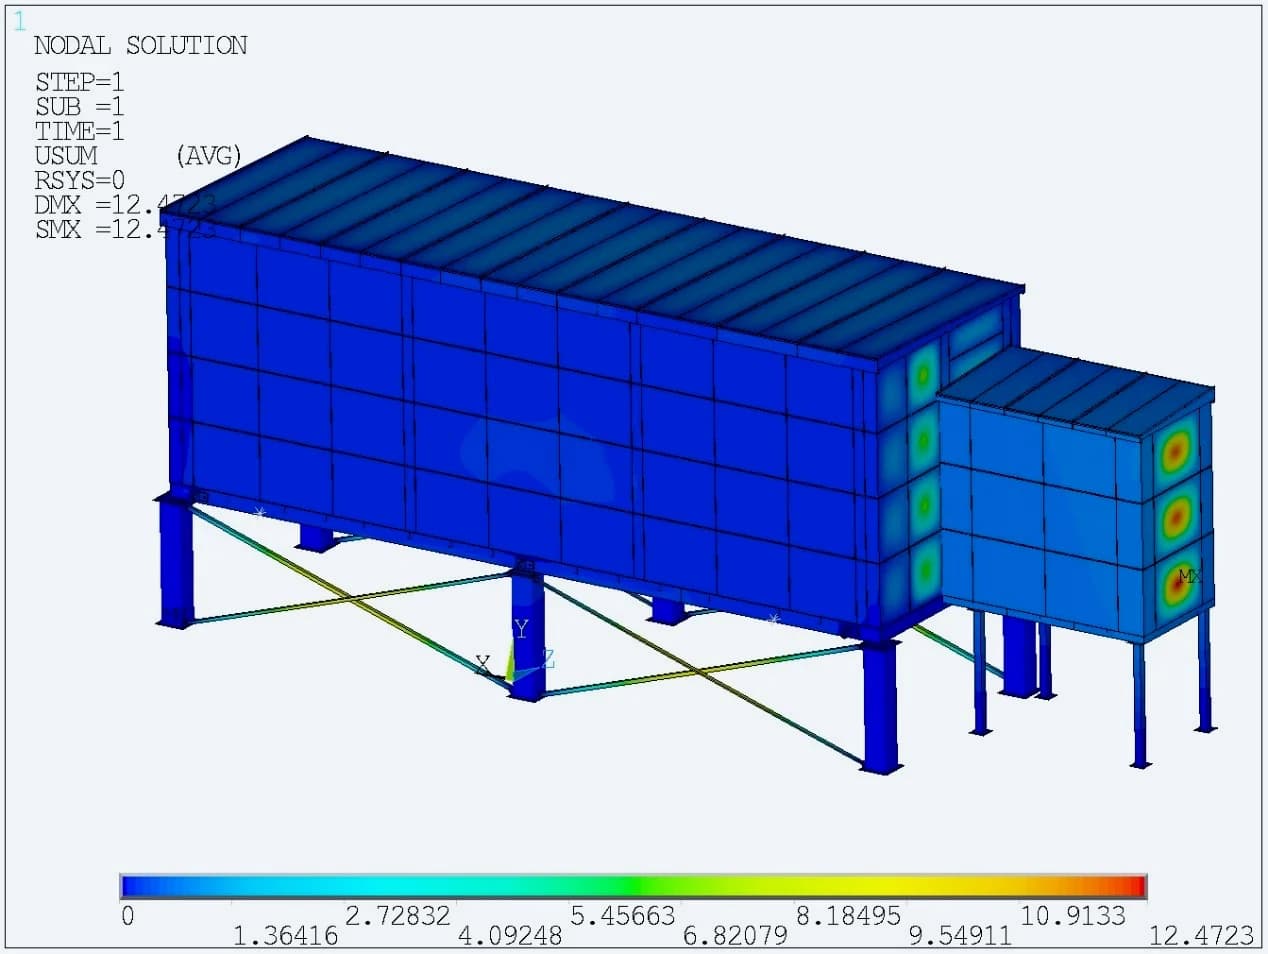
12.47 mm in wind case WL2
Changing the wind direction changes the displacement pattern. This case is assessed against the same reported horizontal limit
The analysis follows the load beyond the external wall: through the base frame, columns and bracing. Separate support results identify the demand on the main-container and cabin steelwork.
08 / LIFTING ASSESSMENT
A separate support condition for handling
The model combines a long electrical enclosure with a smaller projecting cabin. The container floor carries the installed equipment, while columns and diagonal bracing transfer loads to the ground connections. The cabin has its own support arrangement, making it important to assess both parts of the assembly
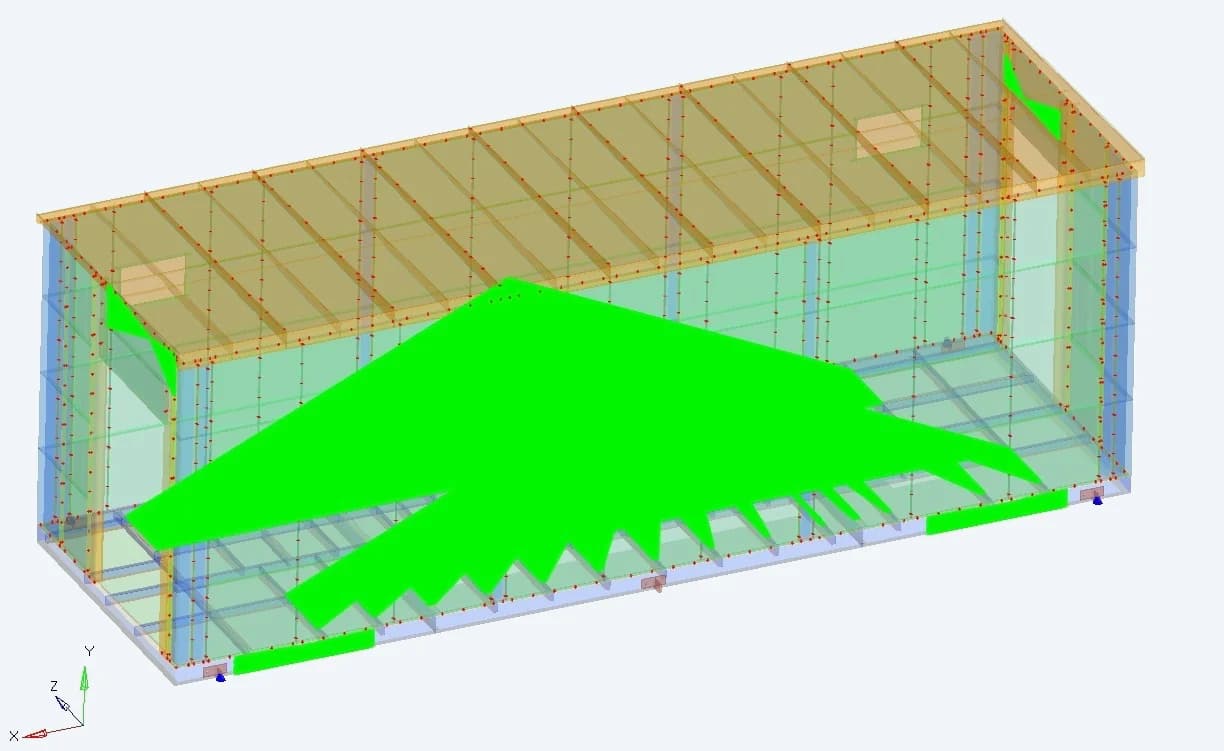
Four lifting restraints
The lifting case replaces the installed support condition with restraints at the lifting lugs. This changes how the load is carried through the enclosure and its base frame The model evaluates the defined analysis condition and its associated payload
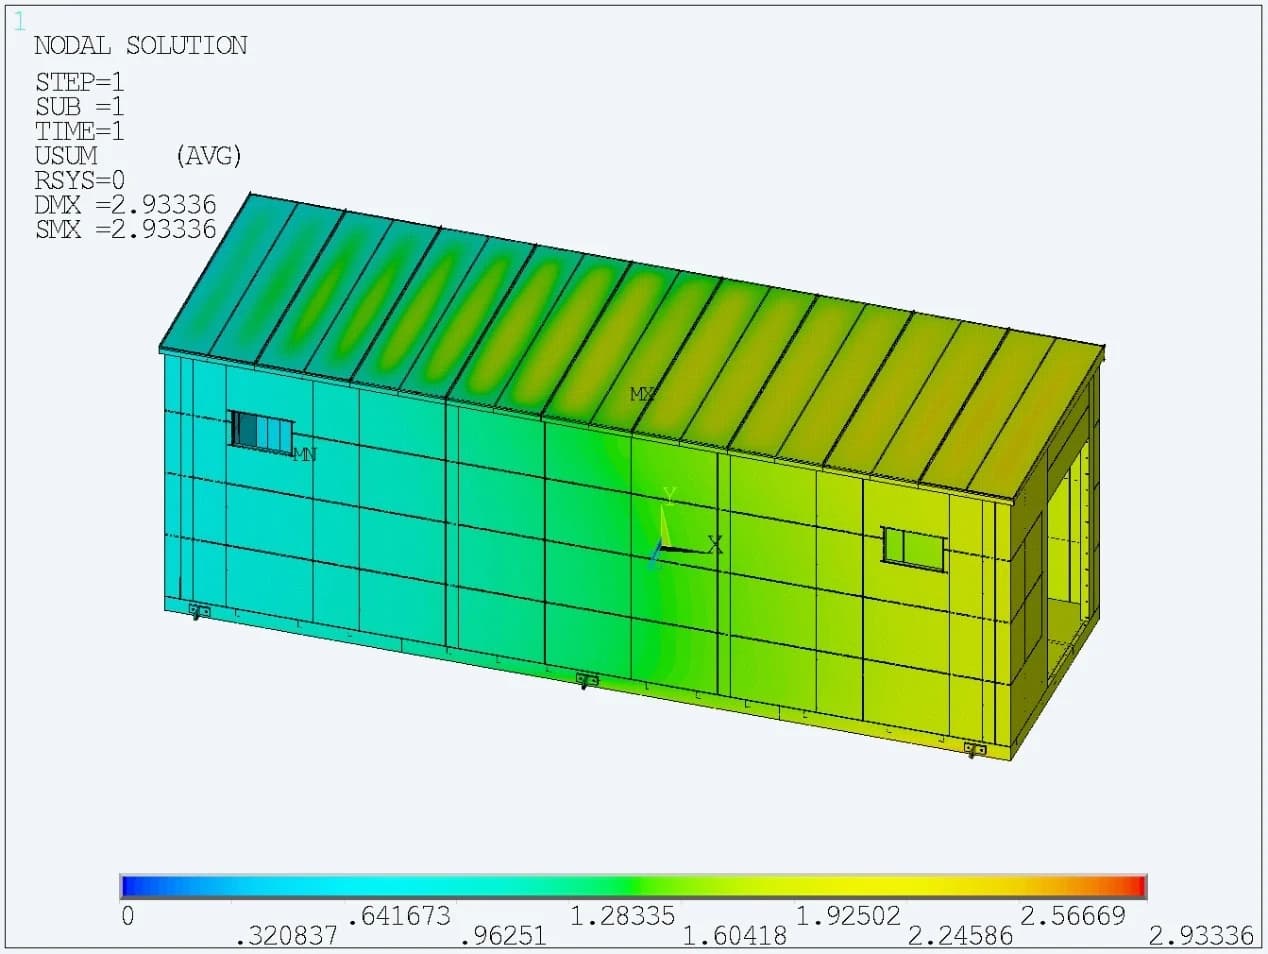
2.93 mm reported deformation
The lifting contour shows the response of the container under the defined lifting condition. The report compares it with an 8.88 mm limit
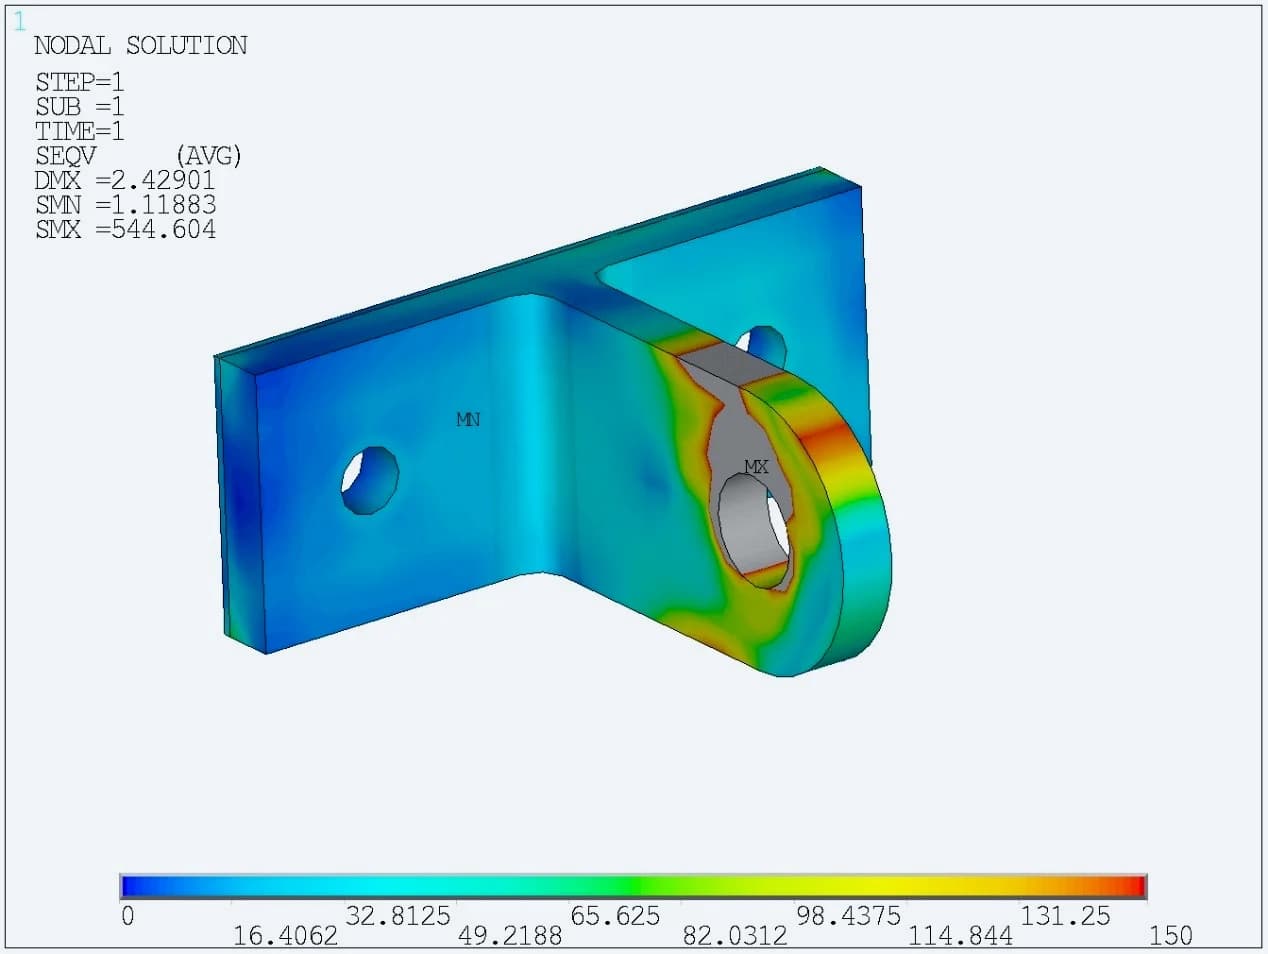
Local response at the lifting lug
The lug plot shows a 544.6 MPa local solver maximum. The report states 150 MPa after excluding peaks, so the local maximum must be distinguished from its assessment value
The base-frame stress for lifting is 206.28 MPa. Local attachment behaviour remains an important part of the review because the handling load enters the structure through a small number of connection regions
09 / SEISMIC ASSESSMENT
Examining the enclosure in two horizontal directions
Equivalent seismic actions were applied longitudinally and transversely using the reported 0.1125 g acceleration component. Component plots allow the wall response to be examined separately from the base frame, roof and supporting columns
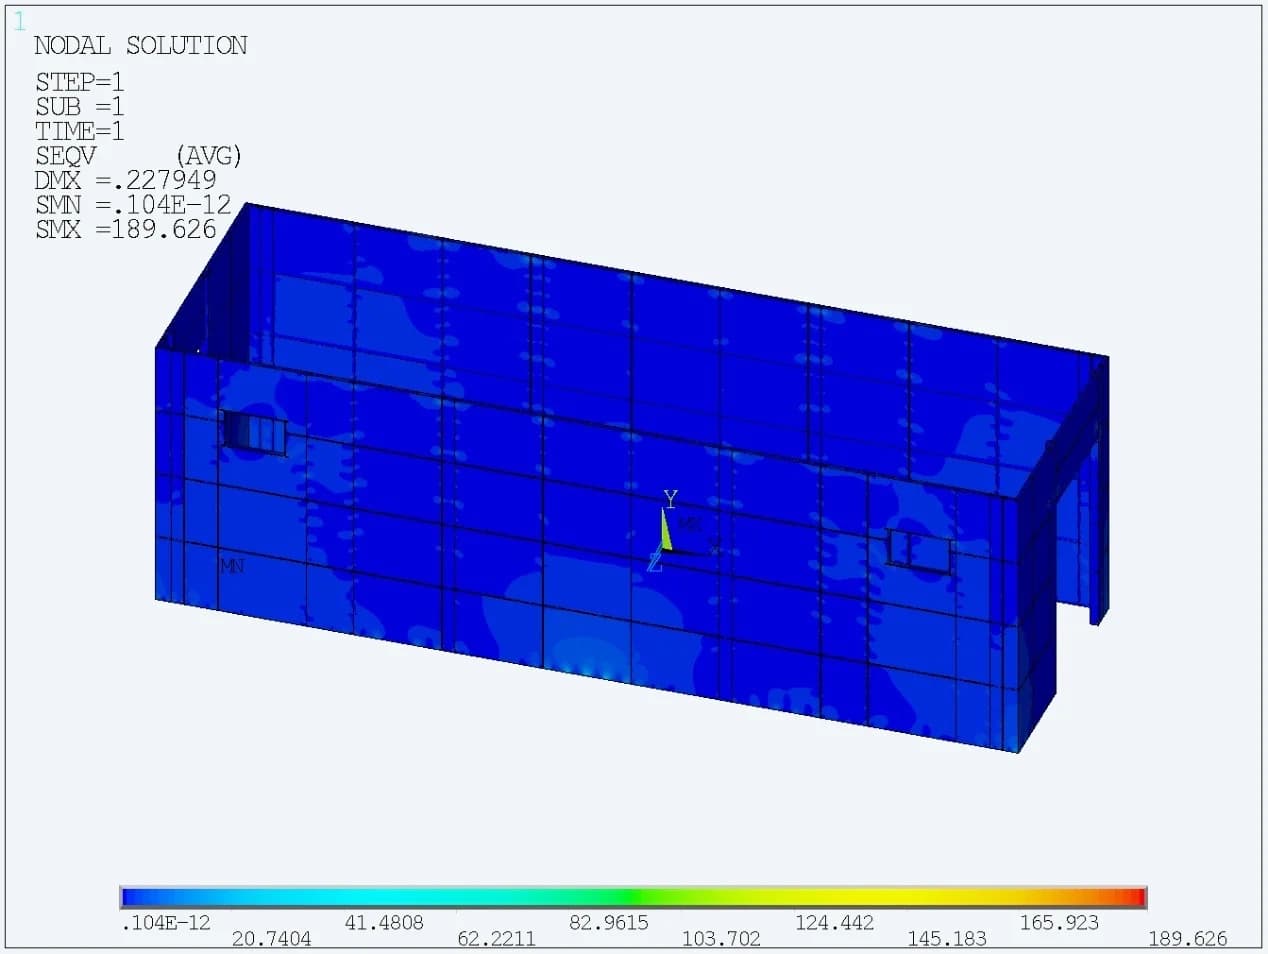
189.63 MPa, longitudinal case
The wall contour identifies the stress distribution for longitudinal seismic loading. This is the maximum shown by the original component plot
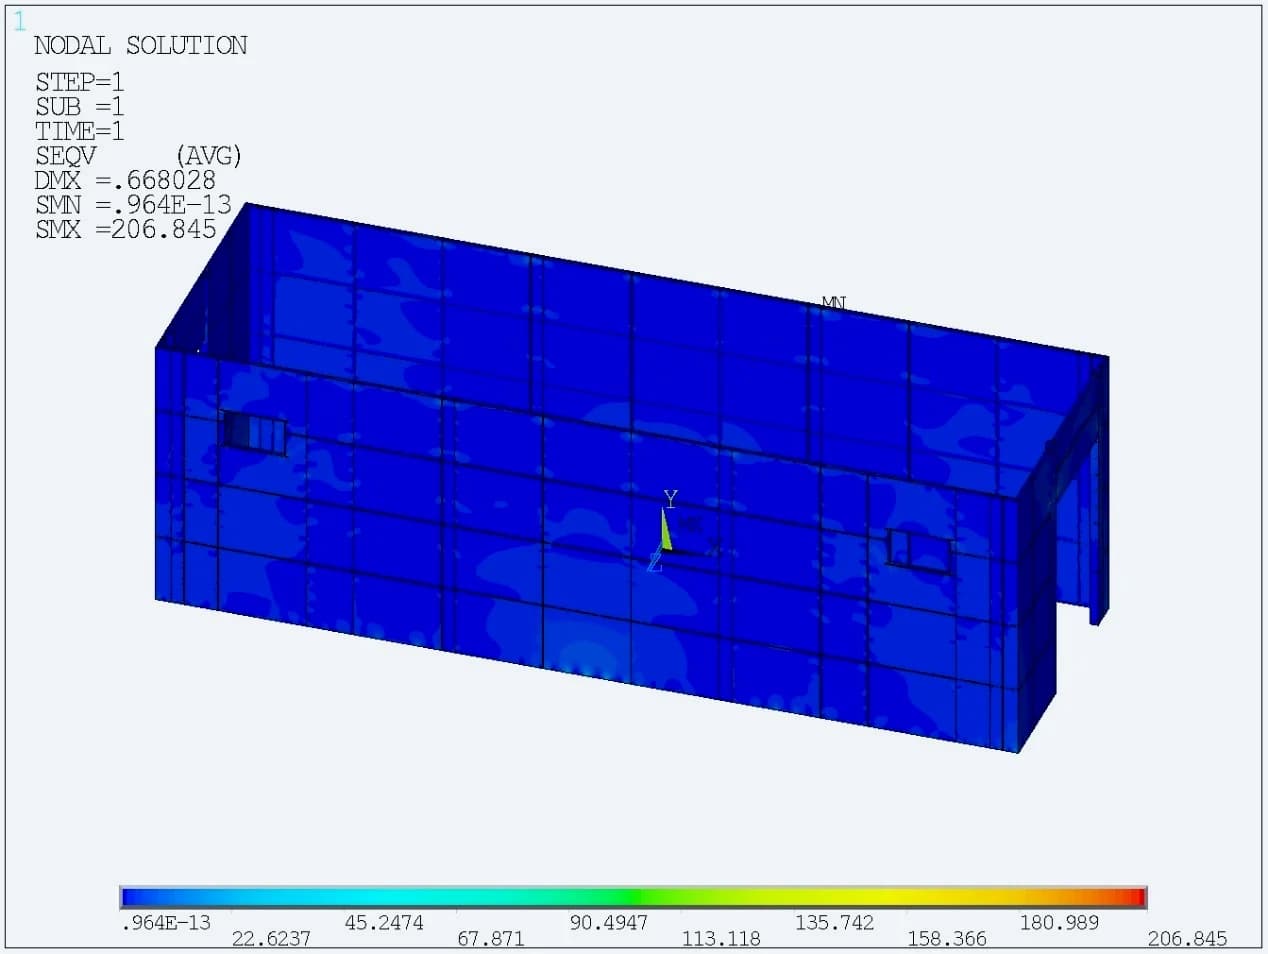
206.85 MPa, transverse case
The transverse case produces a higher maximum in the displayed wall result. This comparison helps identify which loading direction governs this component
10 / SUPPORTS & FOUNDATION INTERFACE
Assessing the columns and bracing
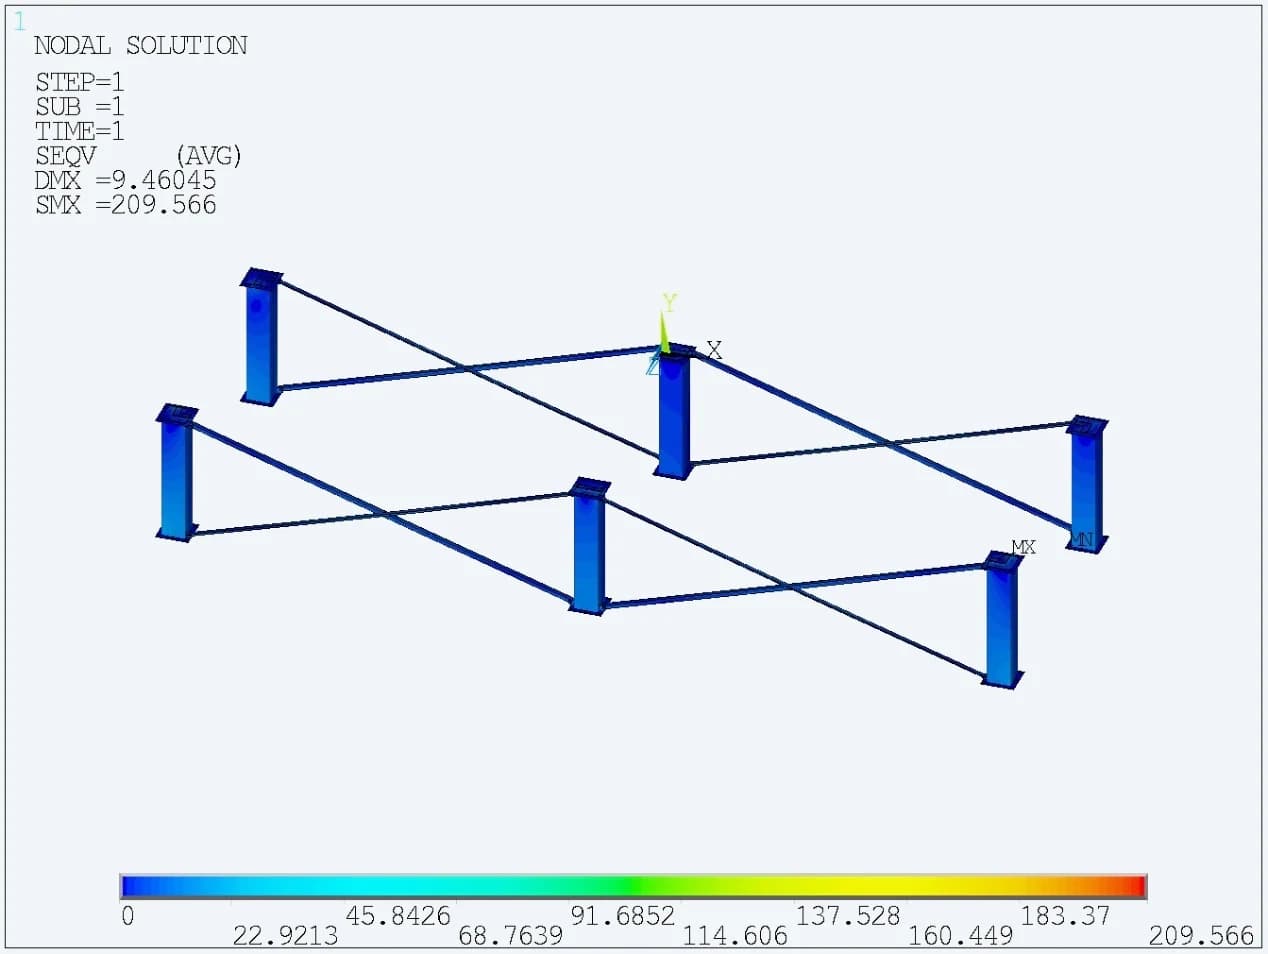
209.57 MPa
Main support stress in WL1 The report identifies this wind case as the highest main-support stress in its summary. The stated yield-to-stress ratio is 1.67 for the model material
Reaction schedules record forces and moments at the six main columns and four cabin columns, with axis definitions for the foundation interface.
These schedules provide inputs for foundation coordination. They do not establish soil capacity or concrete-foundation adequacy
11 / ACCESS PLATFORM ASSESSMENT
Extending the study to the access structures
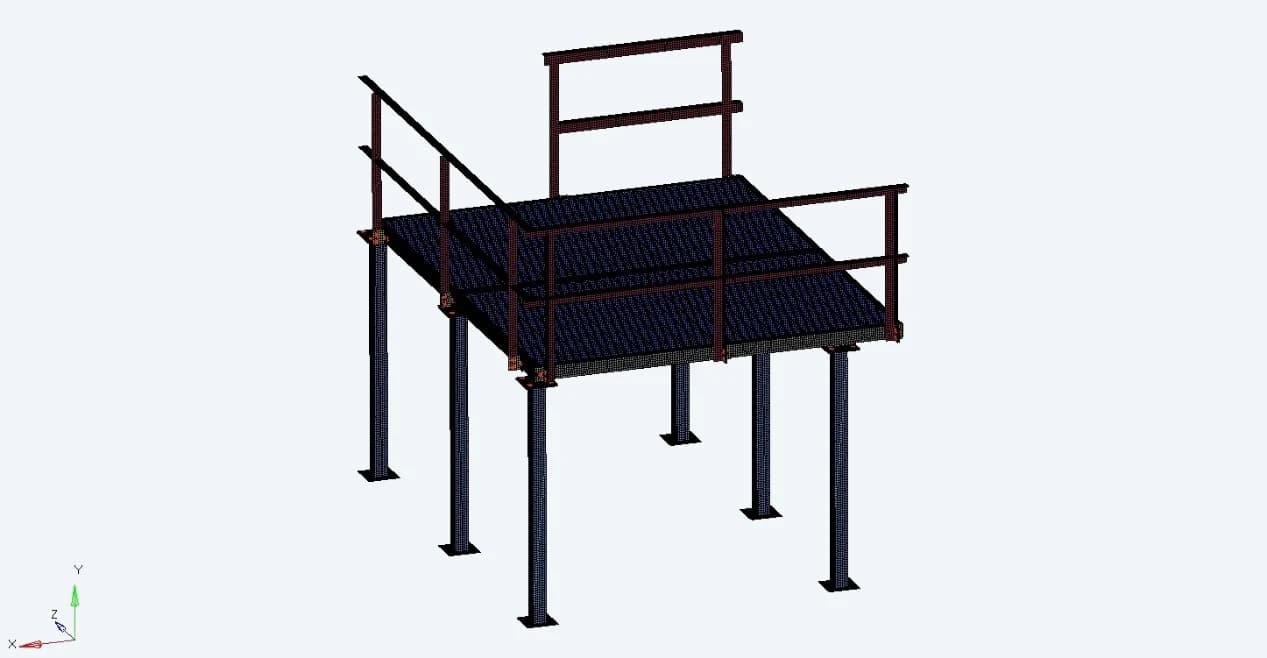
Larger access platform
The separate platform study represents the deck, supporting legs and guardrails. Its loading basis includes self-weight and 5 kN/m² on the platform.
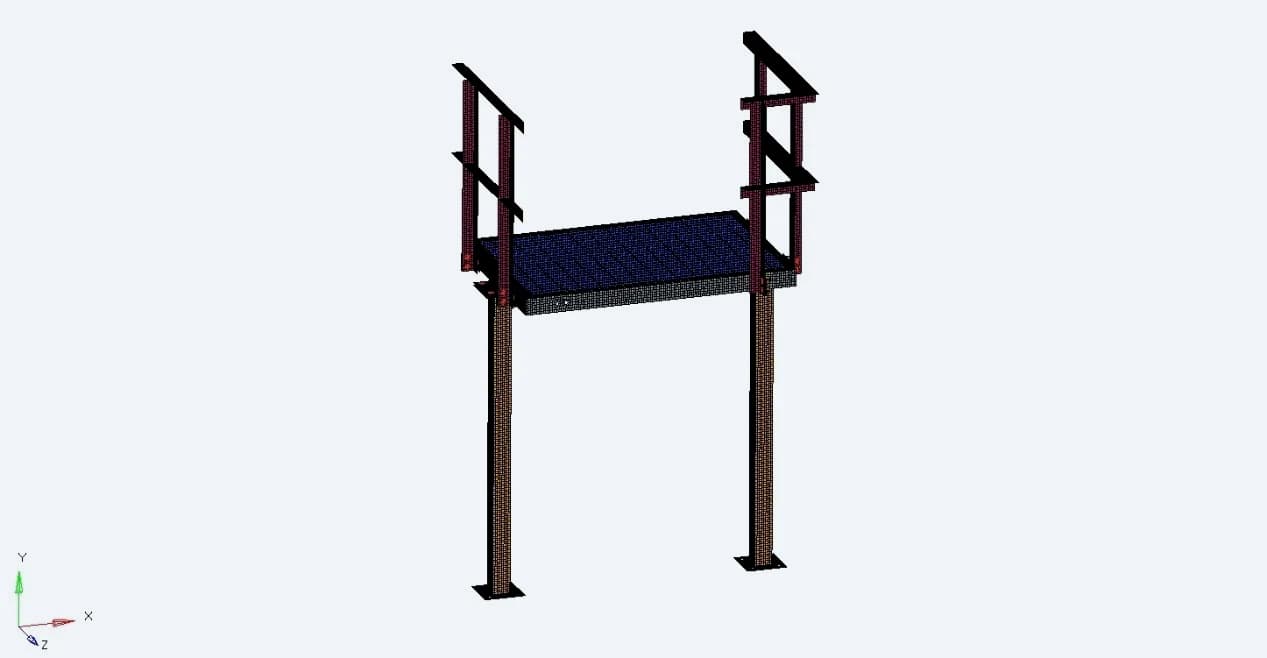
Smaller access platform
A second platform geometry is assessed in the same report, with its own span, supports and component response
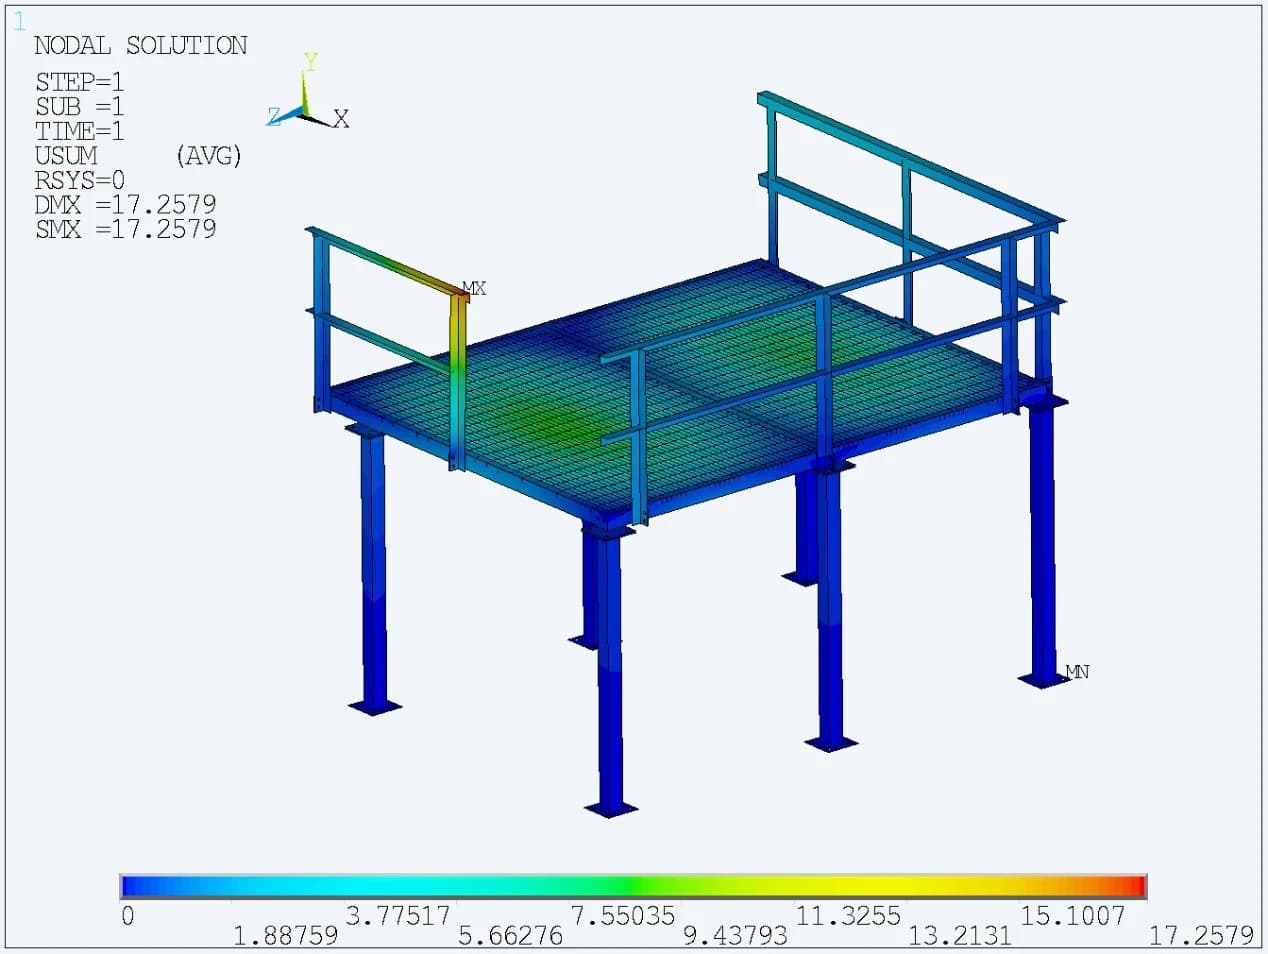
Platform deck and guardrail movement
The report states 6.13 mm on the platform against a 7.22 mm limit. The whole-model contour reaches 17.26 mm at the guardrail, a different location
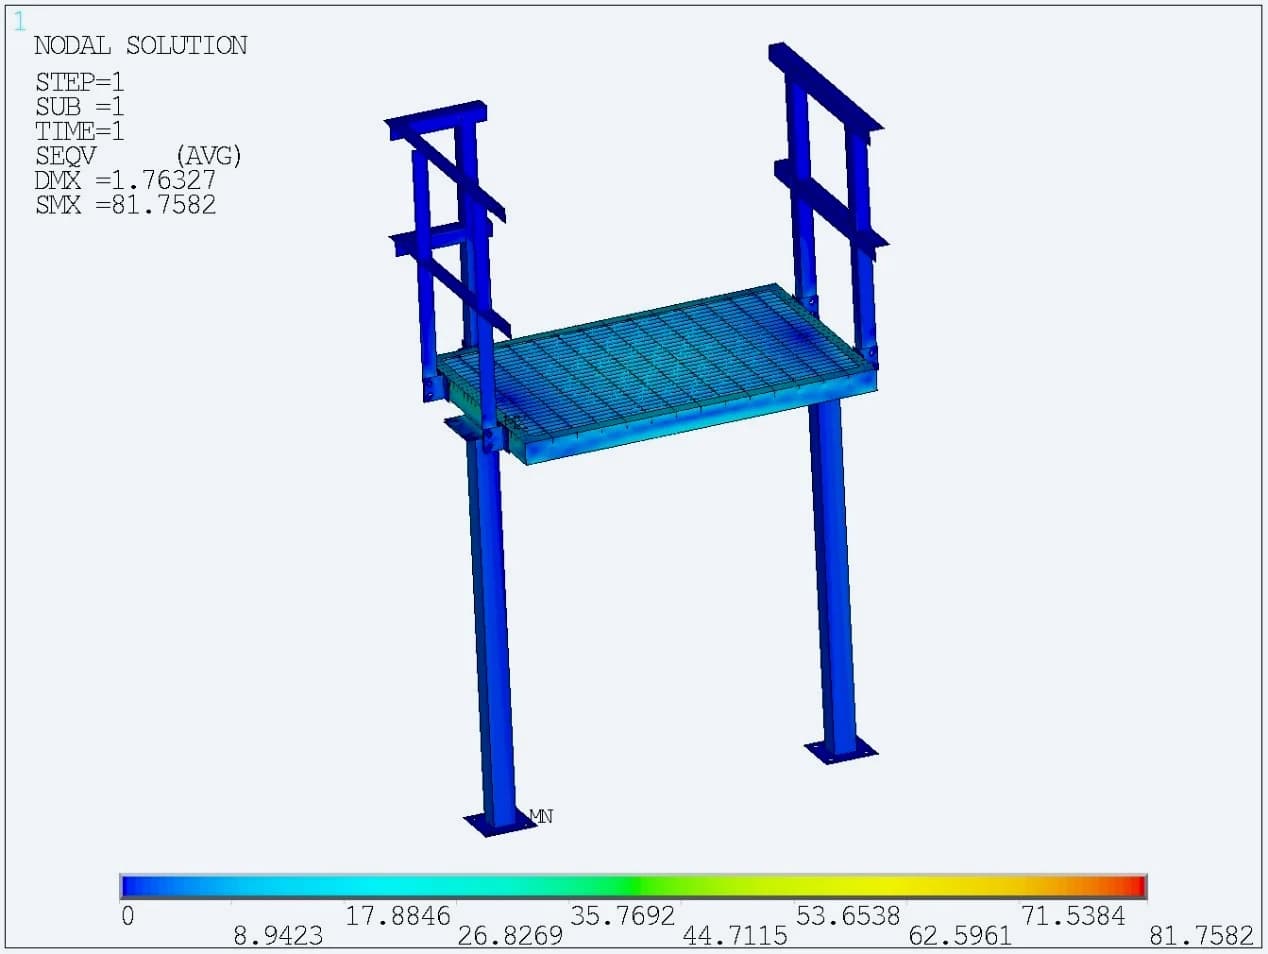
81.76 MPa in the smaller platform
The smaller platform plot shows 81.76 MPa stress. Its separate deformation result is 1.76 mm against a reported 2.72 mm limit
For the larger platform, the report states an assessment stress of 200 MPa after peak exclusions. The original stress contour has a local maximum of 319.89 MPa
12 / SELECTED RESULTS
Component checks used in the assessment
| ASSESSMENT | REPORTED RESPONSE | REFERENCE USED IN REPORT |
|---|---|---|
| Base frame, dead load | 1.52 mm deformation / 80.90 MPa stress | 8.88 mm deflection limit |
| Base frame, dead + live | 3.06 mm deformation / 145.63 MPa stress | 8.88 mm deflection limit |
| Wind cases WL1 / WL2 | 15.45 mm / 12.47 mm movement | 25.5 mm horizontal limit |
| Lifting | 2.93 mm deformation / 206.28 MPa base stress | 8.88 mm deflection limit |
| Main supports, WL1 | 209.57 MPa stress / reported ratio 1.67 | 350 MPa material yield strength |
Values are rounded from the detailed plots where available. The source summary records satisfaction of its stated checks, subject to the model assumptions and treatment of local peaks
A detailed basis for vessel design review
The ASME Section VIII, Division 2 assessment connected full-vessel response with the behaviour of individual pressure-boundary components. SCL evaluations resolved membrane and bending stresses at critical regions and supported the documented design development The delivered analysis package gave the engineering team a traceable basis for reviewing the propane and butane vessels across the defined operating, test and handling scenarios