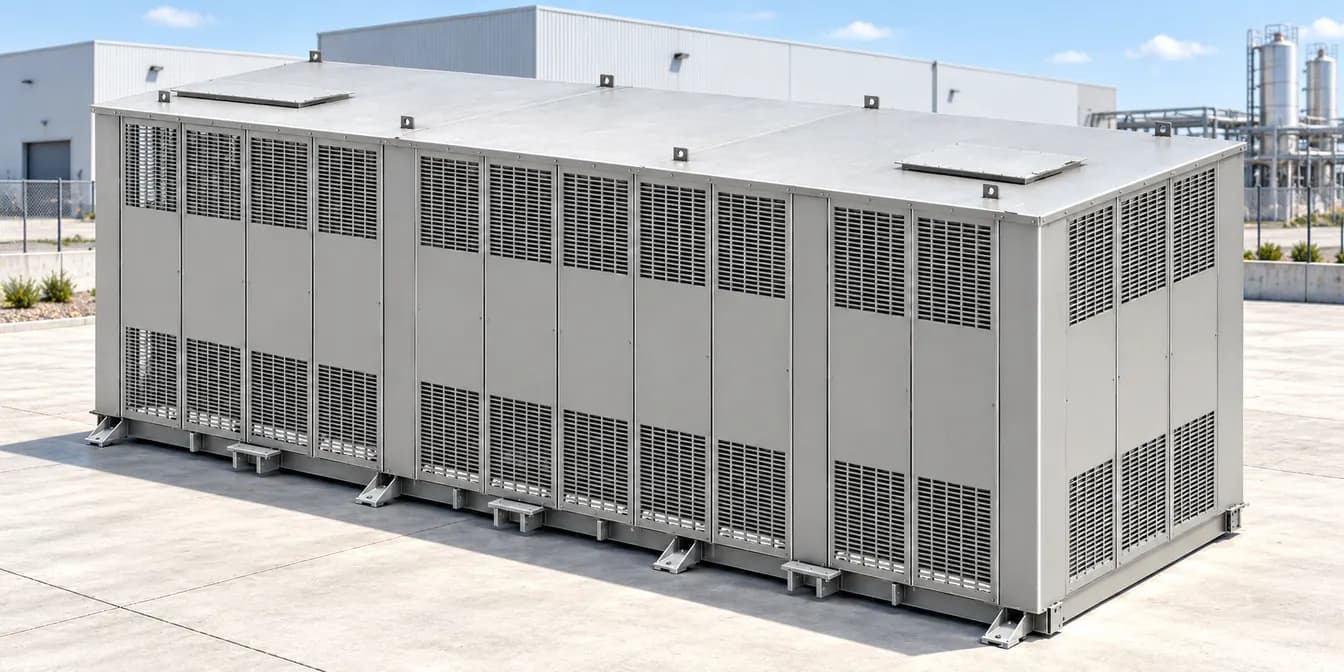
Structural FEA of an Electrical Shelter
IPM KA004A · service loads and lifting assessment
Product Design & Development
Structural FEA of an Electrical Shelter
- Requirement
Assess the complete structural load path
Evaluate the electrical shelter with its equipment representation under defined service and lifting loads
- Challenge
Connect global response to local behaviour
Capture the different stiffness of the base, frame and ventilated panels while representing connections and supports
- Deliverables
A documented structural assessment
Prepared FE model, load-case definitions, constraints, deformation and stress plots, component comparisons and a revised report
- Directional service cases and lifting
- 7 cases
- Base, superstructure, roof and walls
- 4 assemblies
- Revised constraints · November 2023
- Rev. 02
The Engineering Process
From CAD geometry to a component-level conclusion

Step 01: Review CAD

Step 02: Prepare Mesh
Step 03: Define Loads

Step 04: Solve & Inspect

Step 05: Compare Results
01 / Understand the Assembly
A shelter built around electrical equipment
BESS - Design/Development
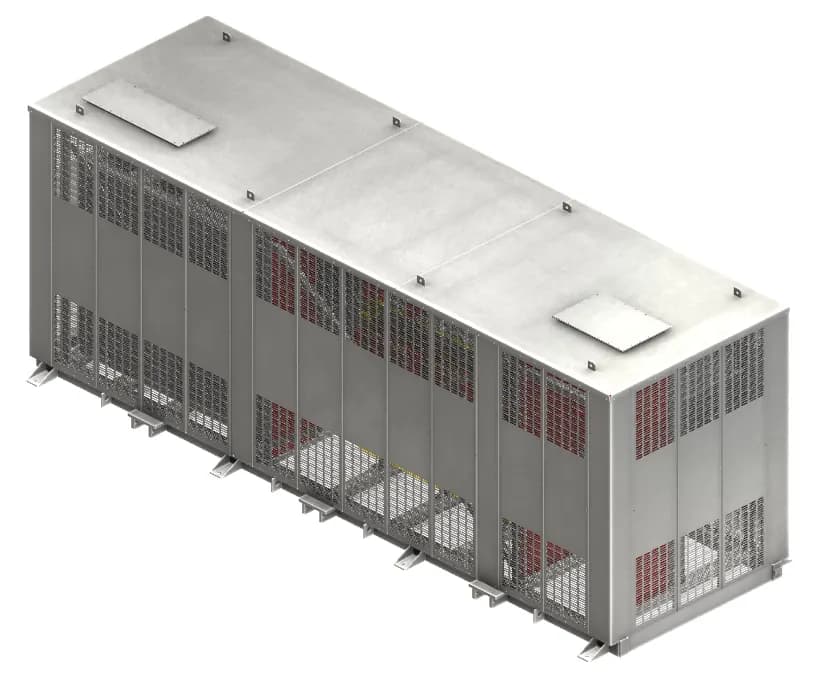
The enclosure combines a structural base, a supporting superstructure, roof sheets and ventilated wall panels. Repeated removable panels provide access around the electrical equipment. The analysis follows the load path through these parts to the supporting base and anchorage
02 / Model Preparation
Represent the structure and its connections
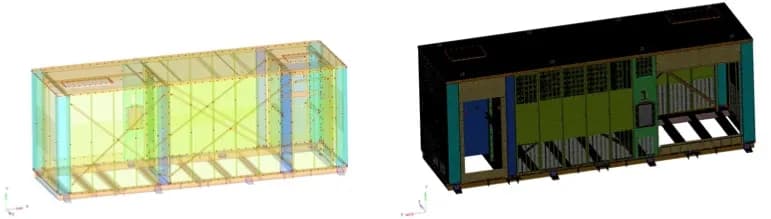
Complete enclosure model
Thin structural and sheet-metal parts were idealised using midsurfaces and shell elements. Geometry cleanup and mesh-quality checks formed part of preprocessing
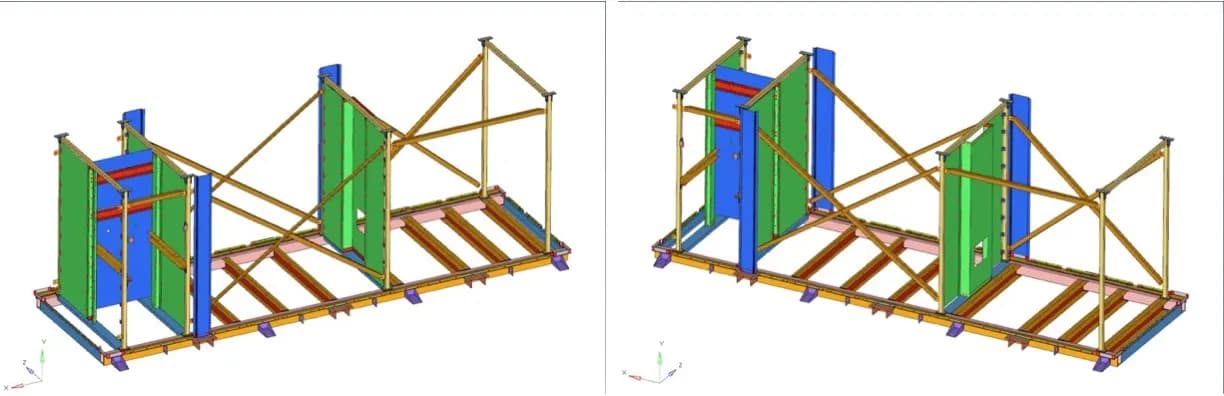
Superstructure representation
Bolts and U-clamps were represented with beam elements. Equipment masses were connected to their mounting locations so their loads entered the structural model
| MODEL FEATURE | REPRESENTED RECORDED IN THE REPORT |
|---|---|
| Thin members and sheet metal | SHELL63 elastic shell elements |
| Bolts and U-clamps | BEAM188 elements |
| Equipment and subsystems | MASS21 point masses with CERIG connections |
| Welded interfaces | Connected nodes at welded locations |
| Material basis | ASTM A36 · stated yield strength 36.3 ksi |
Preprocessing: HyperMesh v17. Solver: ANSYS Mechanical APDL v2020. The study uses static linear analysis.
03 / Component Resolution
Inspect the parts that behave differently
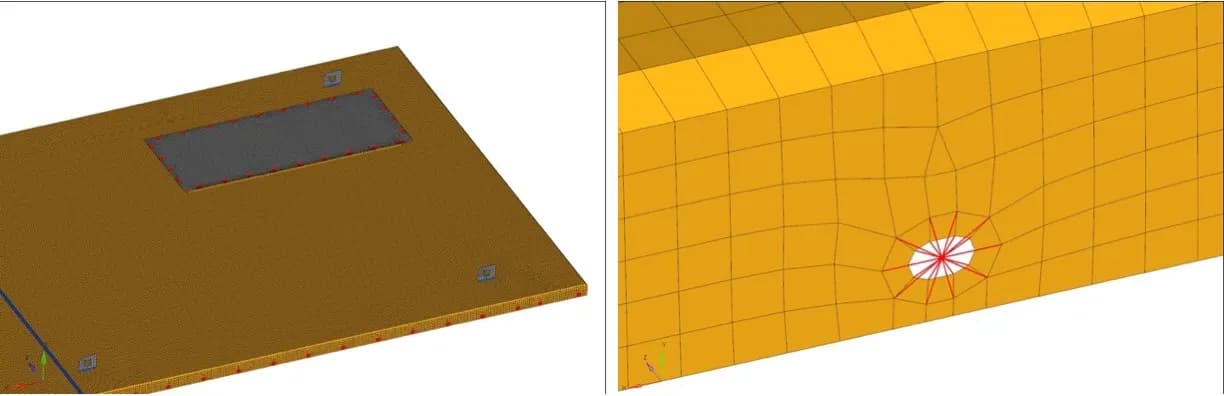
Roof-panel mesh
The roof sheets form a distinct part of the structural assessment. Their response is reviewed separately from the primary frame
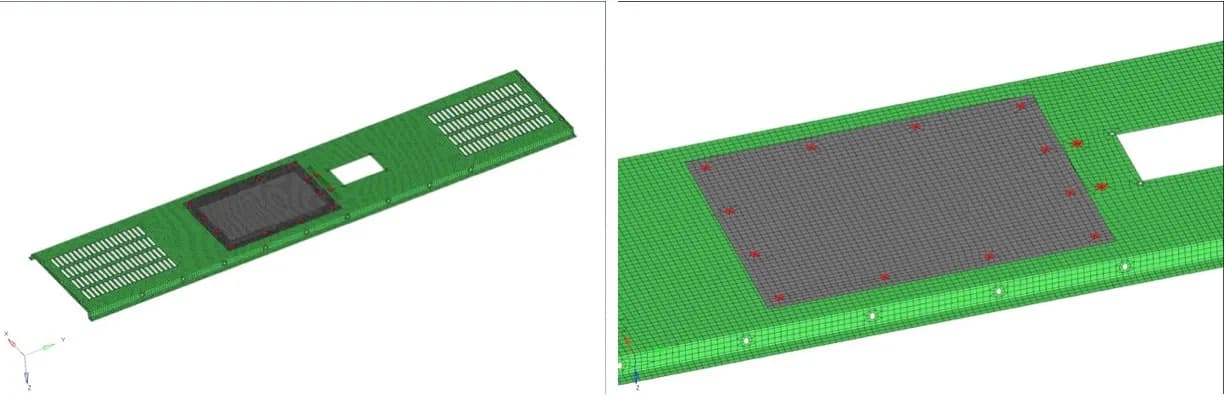
Local panel representation
Panel geometry and openings affect local stiffness. Separate component plots make local stress and deformation visible within the larger enclosure model
04 / Load Cases
Service loading in two directions, plus lifting
| CASE | REPORTED COMBINATION | DIRECTION |
|---|---|---|
| 1-1 / 1-2 | 1.2D + S + 0.5W | Longitudinal X / transverse Z |
| 2-1 / 2-2 | 1.2D + W + 0.3S | Longitudinal X / transverse Z |
| 3-1 / 3-2 | 1.2D + E + 0.15S | Longitudinal X / transverse Z |
| 4 | D + lifting force | Vertical Y |
D: dead load · S: snow · W: wind · E: equivalent static seismic load
The directional cases test how the same structure responds when lateral loading acts along its length or across its width. The lifting case introduces a different support condition and is assessed separately. The report cites ASCE/SEI 7-22 and IBC 2021 as its design references
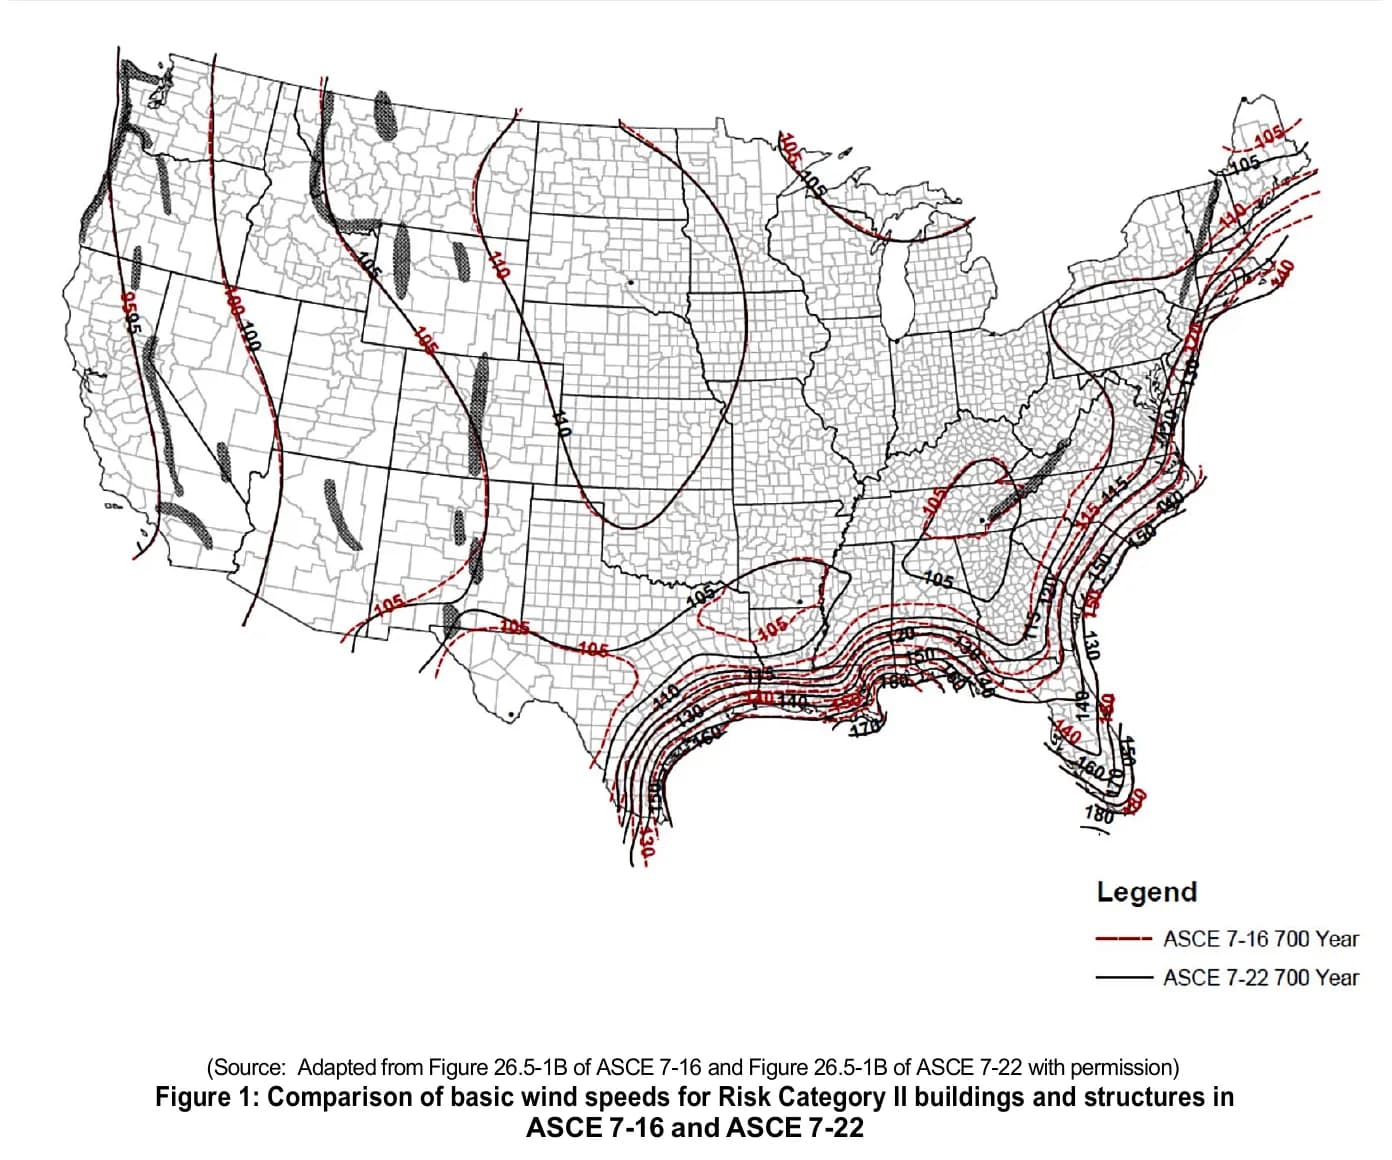
- Reported basic wind speed
- 95 mph
- Reported design snow load
- 4.9 psf
- Stated material yield strength
- 36.3 ksi
05 / Boundary Conditions
Make the support assumptions explicit
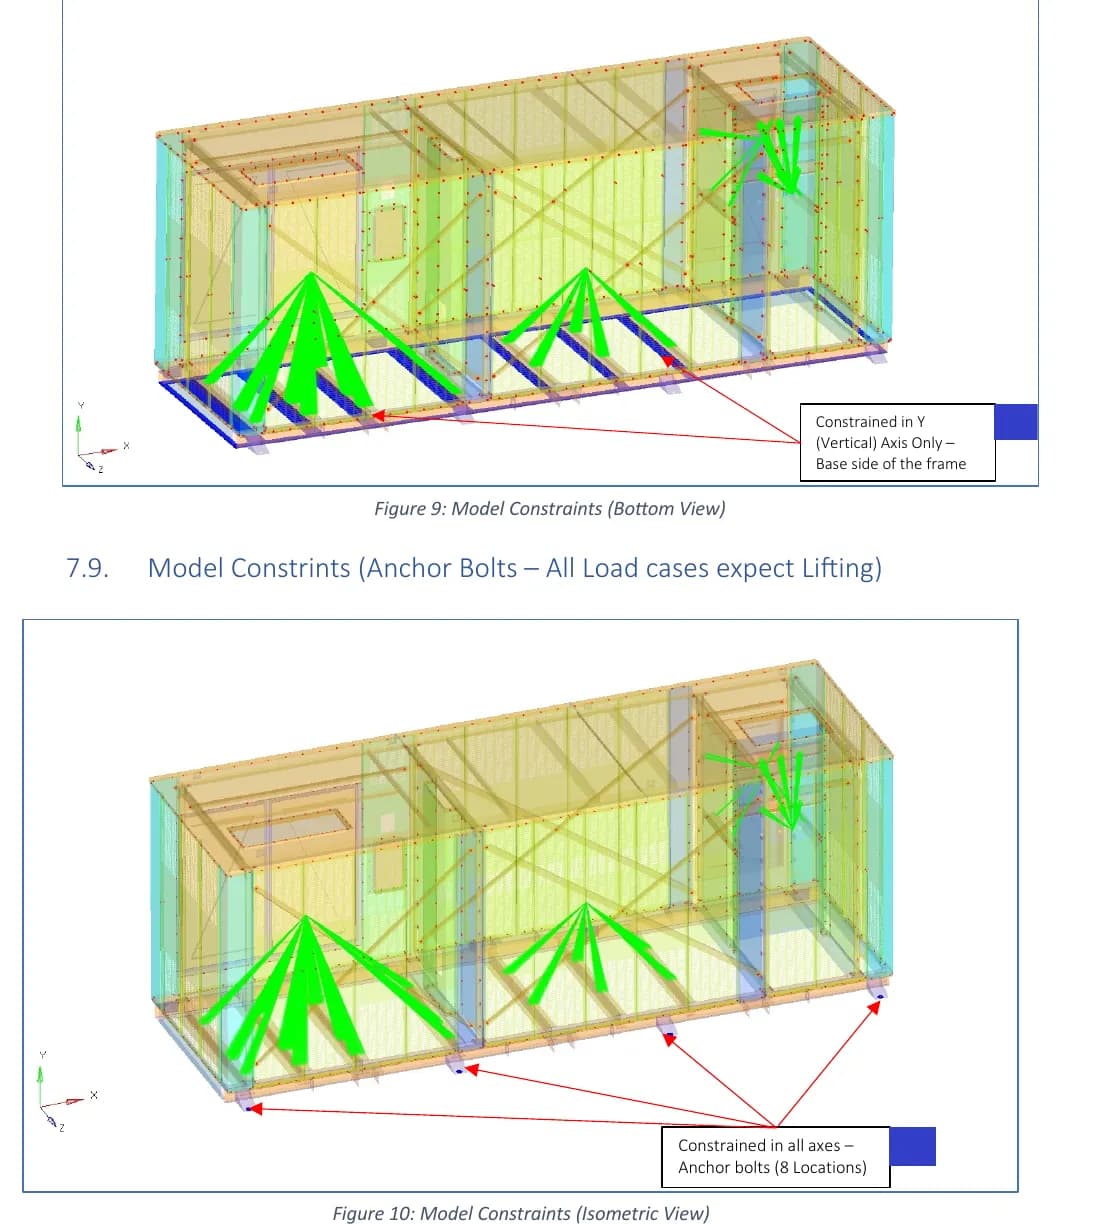
Revised service supports
For the service cases, the underside of the base is restrained in the vertical Y direction. Anchor-bolt locations are fully constrained at eight positions.
These conditions determine how reaction forces pass into the supports and therefore affect both global displacement and local stresses. Revision 02 records the revised model constraints
Original report: revision 02, page 17. Lifting uses the separate arrangement shown later
06 / Dead, Snow and Wind
Check the base and frame under combined loading
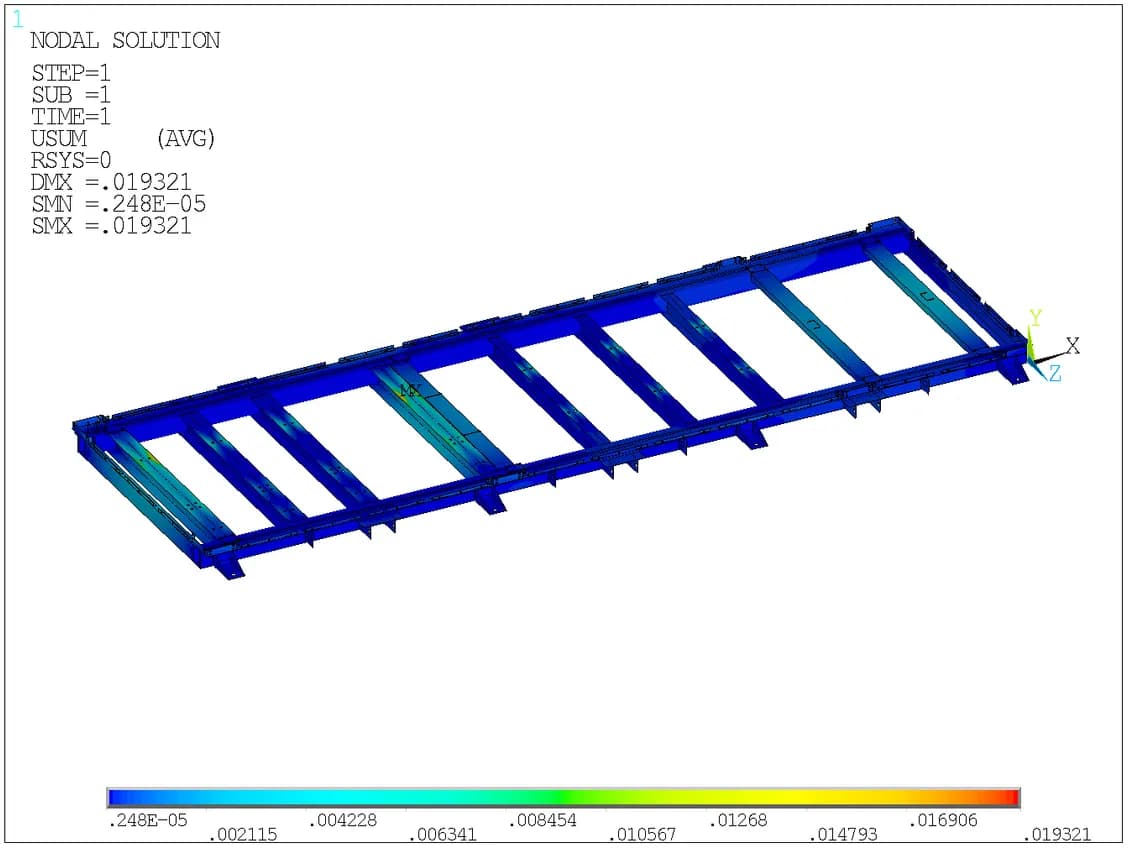
Base-frame deformation
Case 1-1 reports a maximum base-frame displacement of 0.019 in. The contour shows where movement develops within the supported assembly
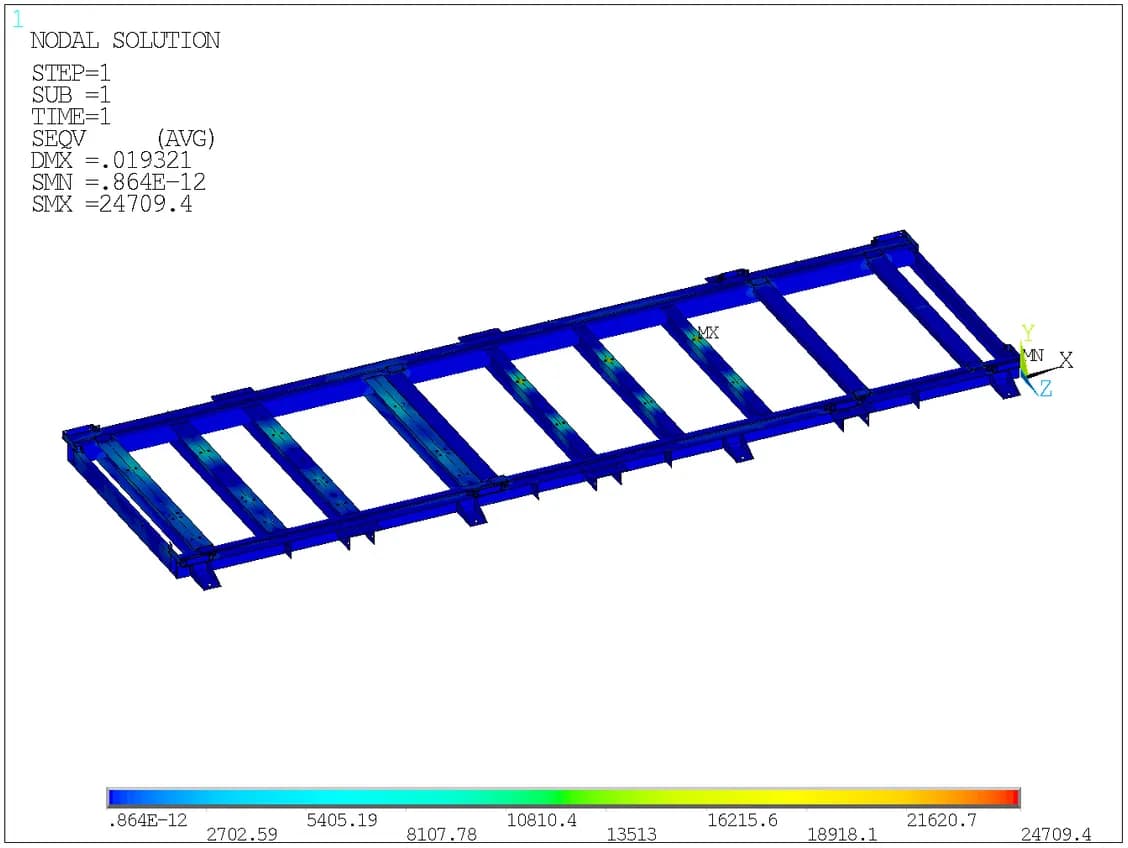
Base-frame stress
The same case reports a peak base-frame von Mises stress of 24.709 ksi. Reviewing both fields connects movement to the regions carrying the load
07 / Wall-Panel Response
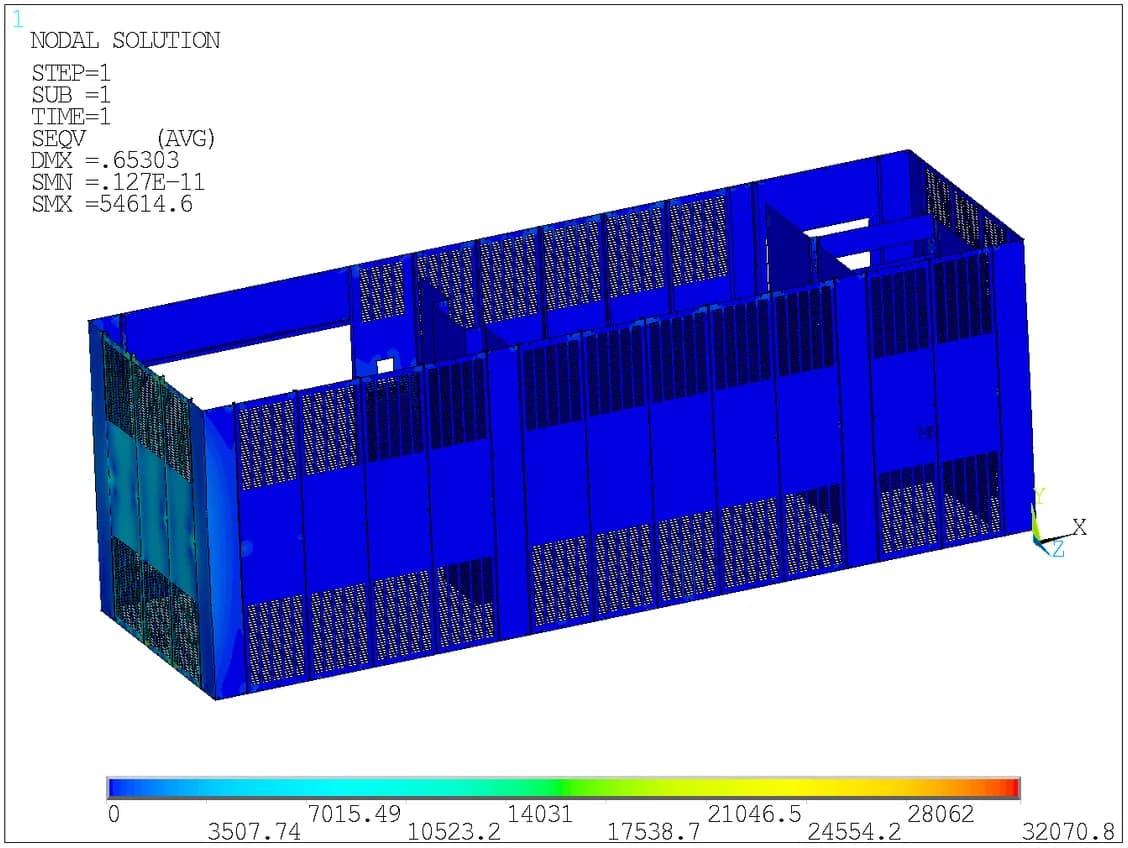
The sidewall governs the reported stress comparison
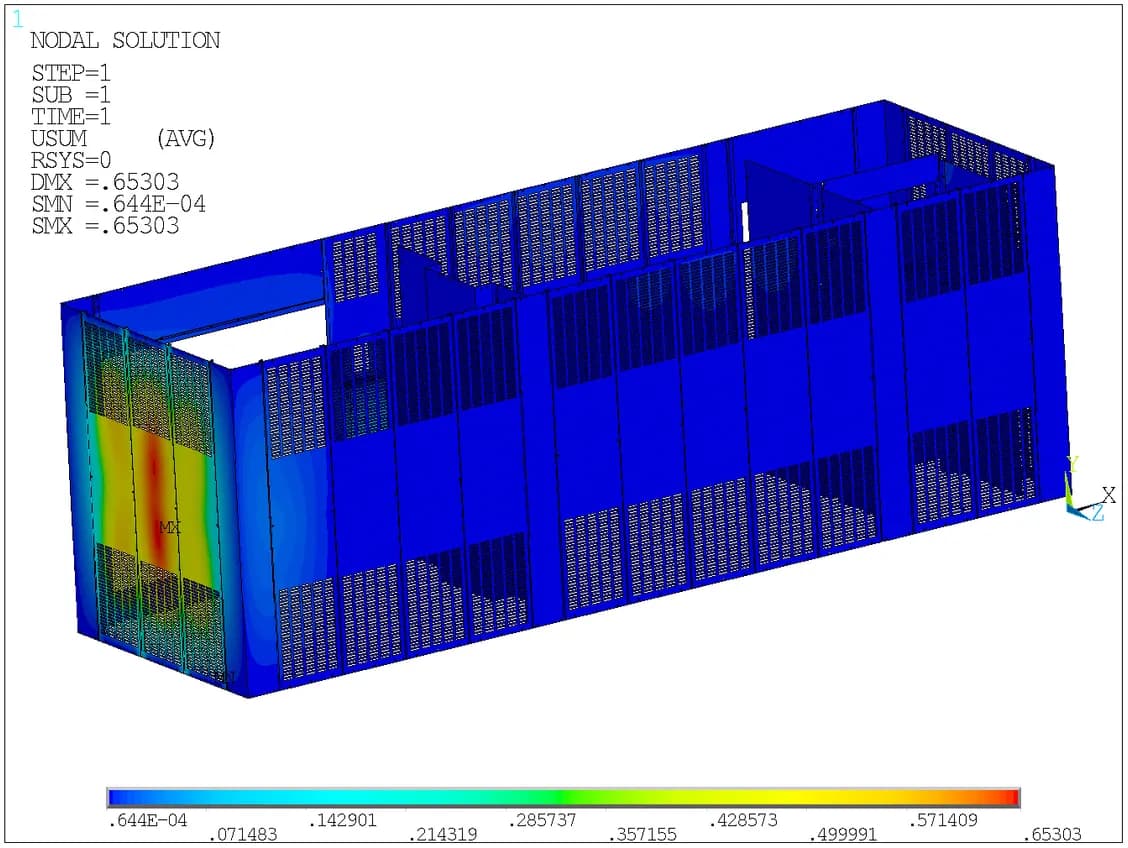
Case 2-1 · displacement
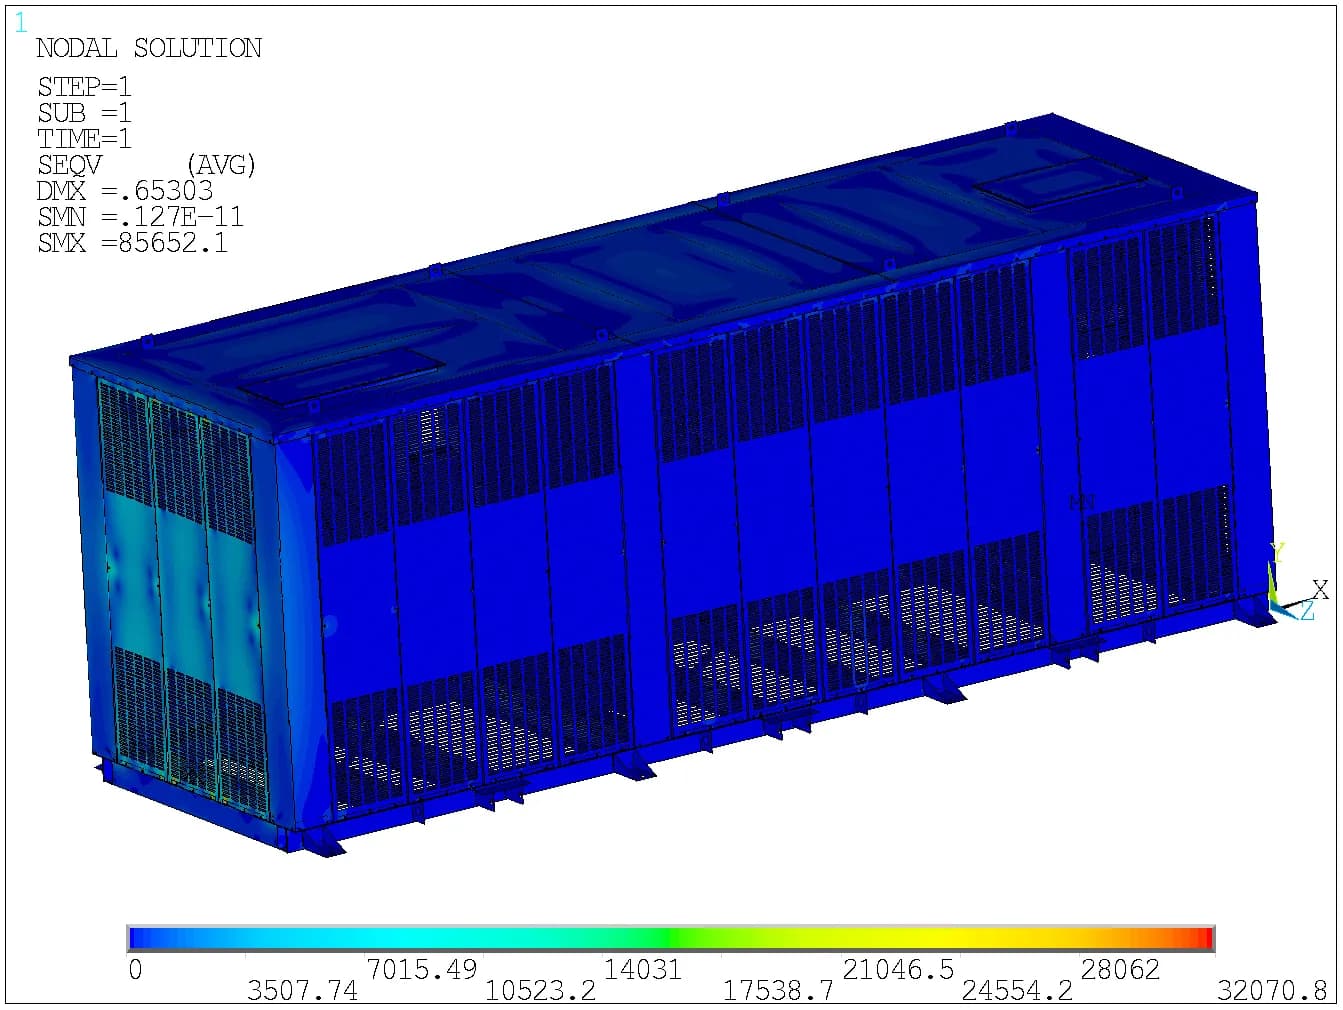
The sidewall reaches a reported maximum displacement of 0.653 in under the longitudinal wind combination. This is a deformation result; the report does not establish a separate serviceability acceptance limit
Case 2-1 · von Mises stress
The corresponding sidewall stress reaches 32.071 ksi, the highest component value listed across the seven cases. It remains below the report’s stated 36.3 ksi yield strength
08 / Equivalent Static Seismic Loading
Trace response through the supporting structure
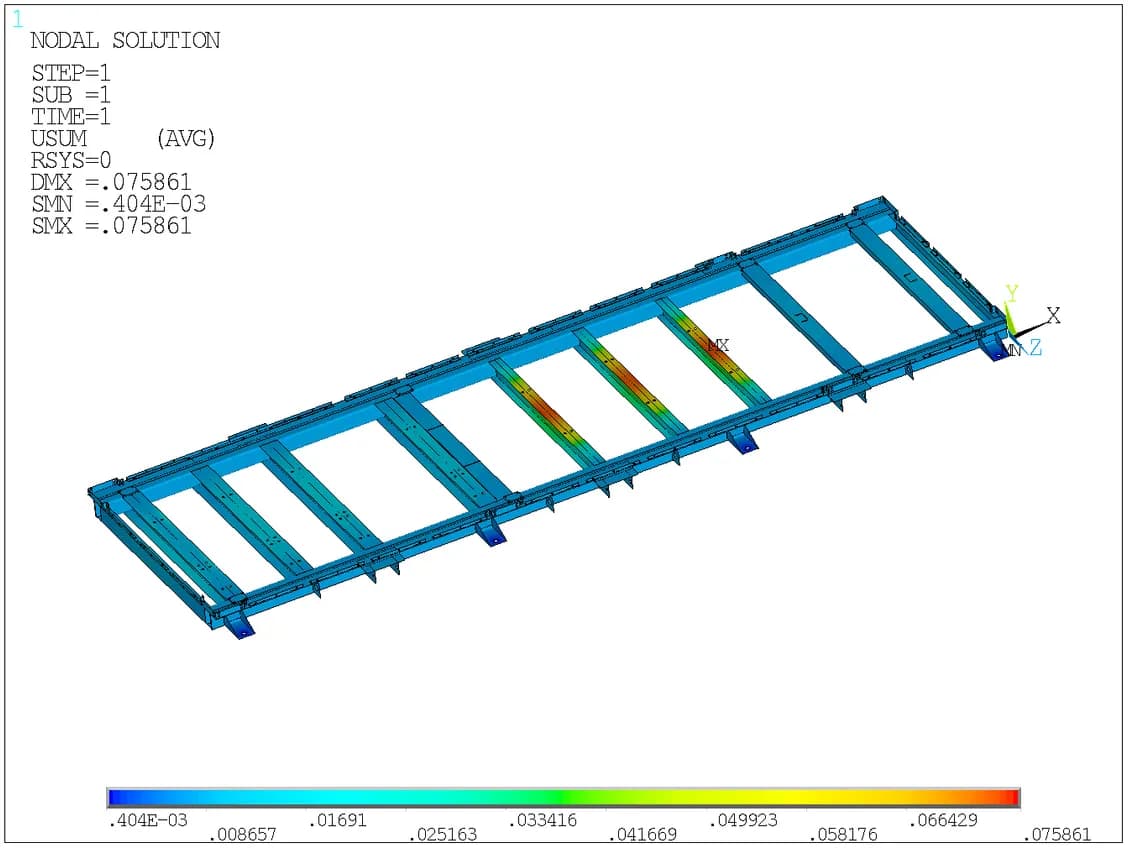
Case 3-1 · base-frame movement
The longitudinal seismic combination produces a reported base-frame displacement of 0.075 in. The model includes the equipment-mass representation and its mounting connections
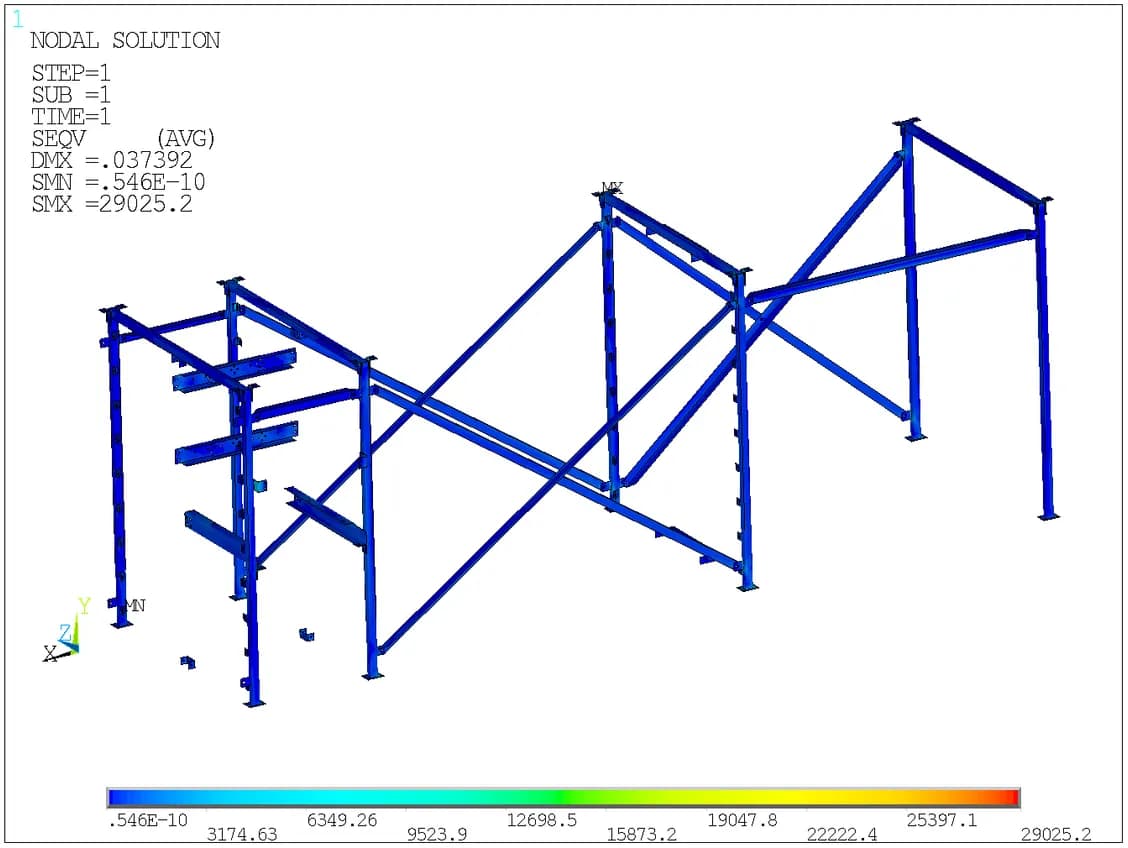
Case 3-1 · superstructure stress
The superstructure reaches 29.025 ksi in this case. Separate plots help distinguish the behaviour of the primary frame from the cladding and roof.
09 / Transverse Response
Direction changes which components attract stress
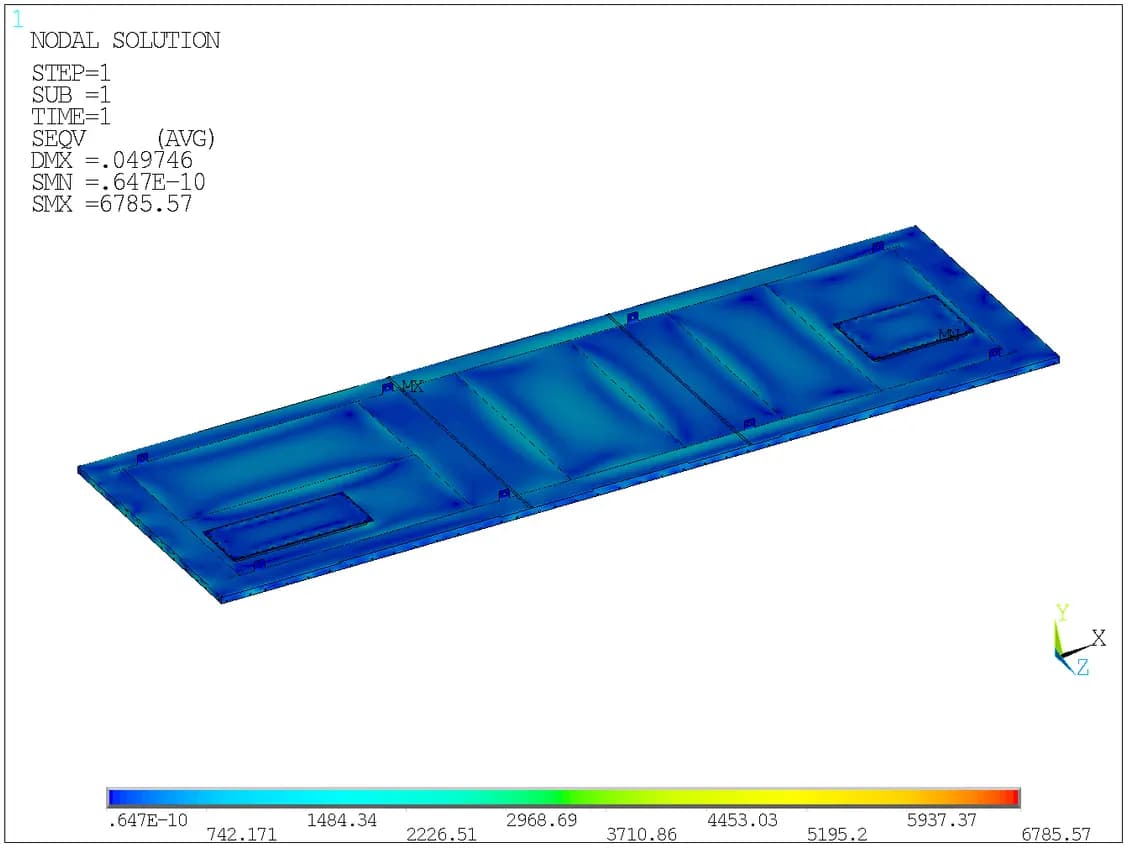
Case 3-2 · roof panel
The transverse seismic combination gives a reported roof-panel peak of approximately 6.786 ksi, the largest roof value in the component summary
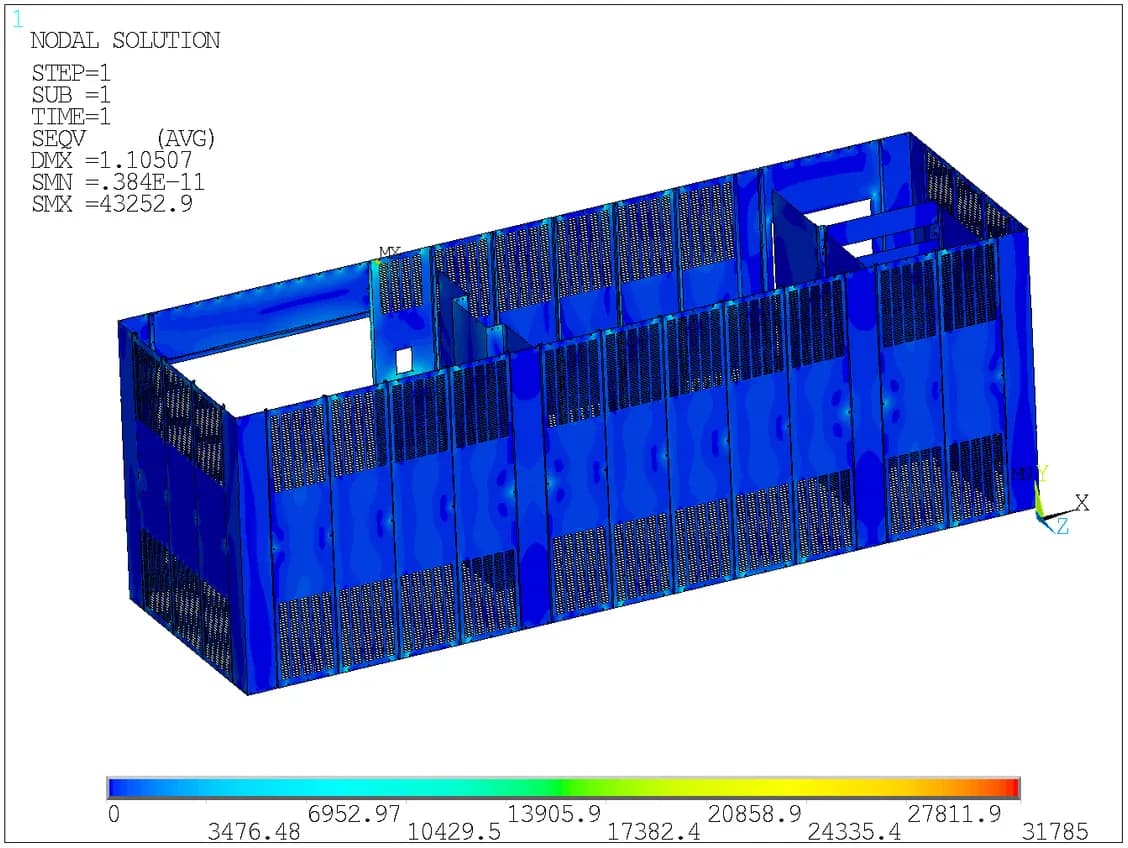
Case 3-2 · sidewall panel
The sidewall reaches 31.785 ksi in the same case. This component value is used in the comparison, rather than the lower base-frame value in the whole-assembly summary
10 / Local Connection Review
Review the anchor-cleat regions
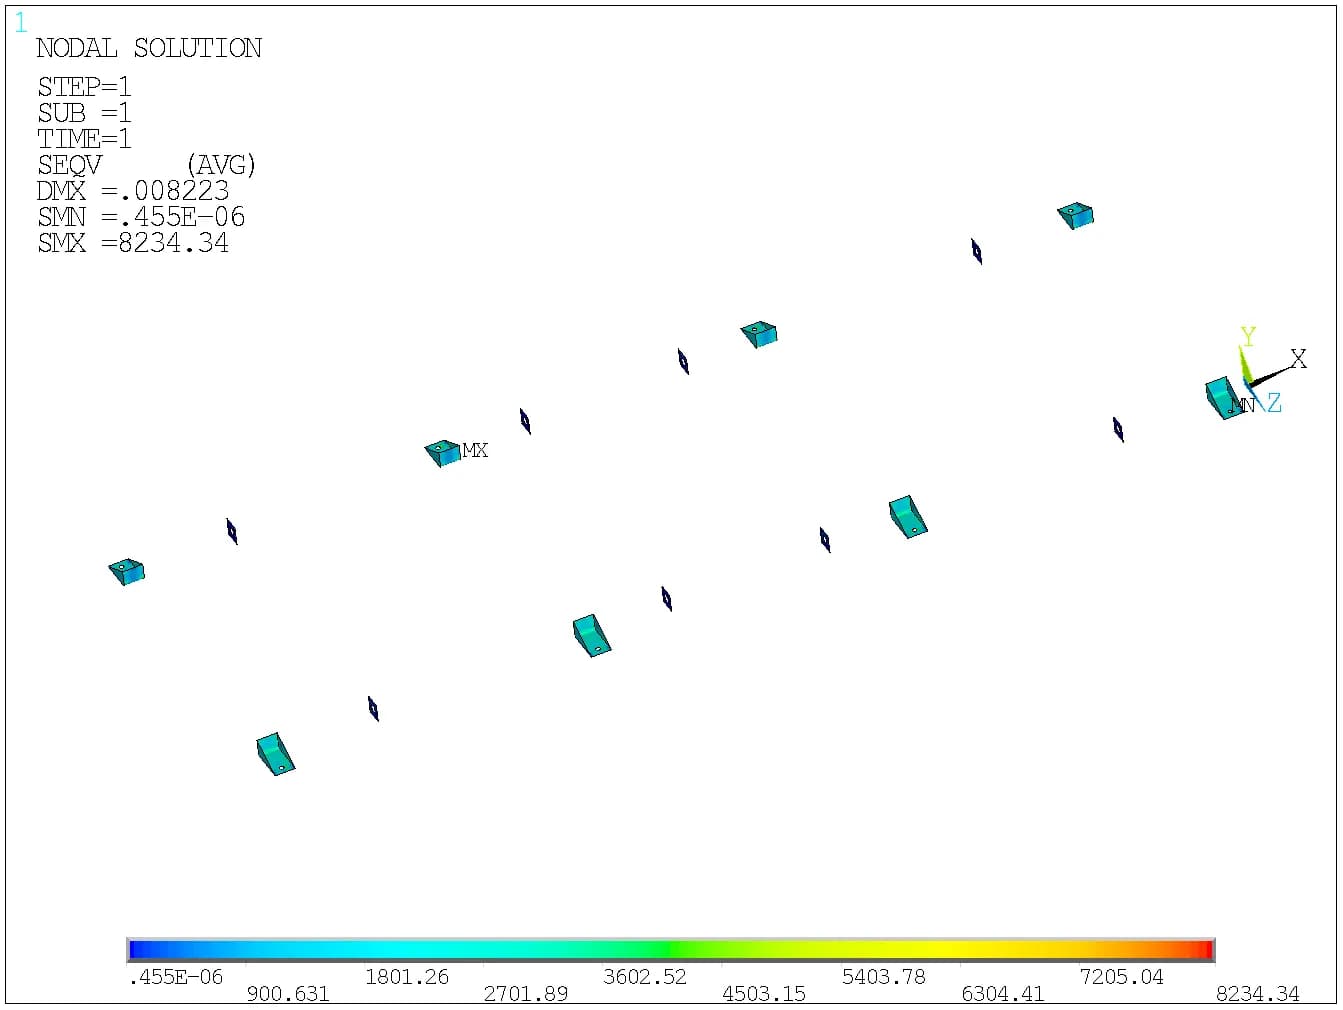
Local force transfer
The report examines stress around the anchor cleats as part of the seismic assessment. Case 3-1 reports 8.234 ksi at the cleat; Case 3-2 reports 6.842 ksi. These local views complement the global frame results
The plot represents the modeled cleat region. Bolt and connection behaviour follows the idealisations stated in the FE model
11 / Lifting Assessment
A separate load path during handling
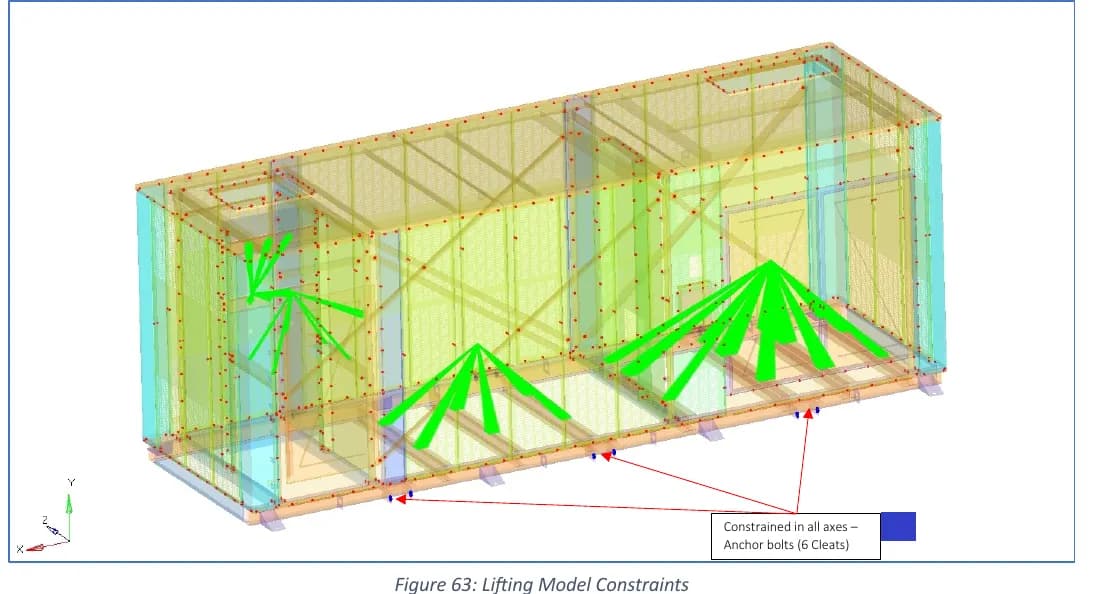
Six modeled lifting locations
The lifting study represents six D-shackle locations and slings connected to a single spreader beam. The model uses a separate constraint arrangement for this condition.
The report then checks the base, superstructure, roof and wall panels under dead load and lifting force. This is the documented analysis setup, rather than a field rigging procedure
12 / Lifting Results
Inspect deformation and stress during lifting
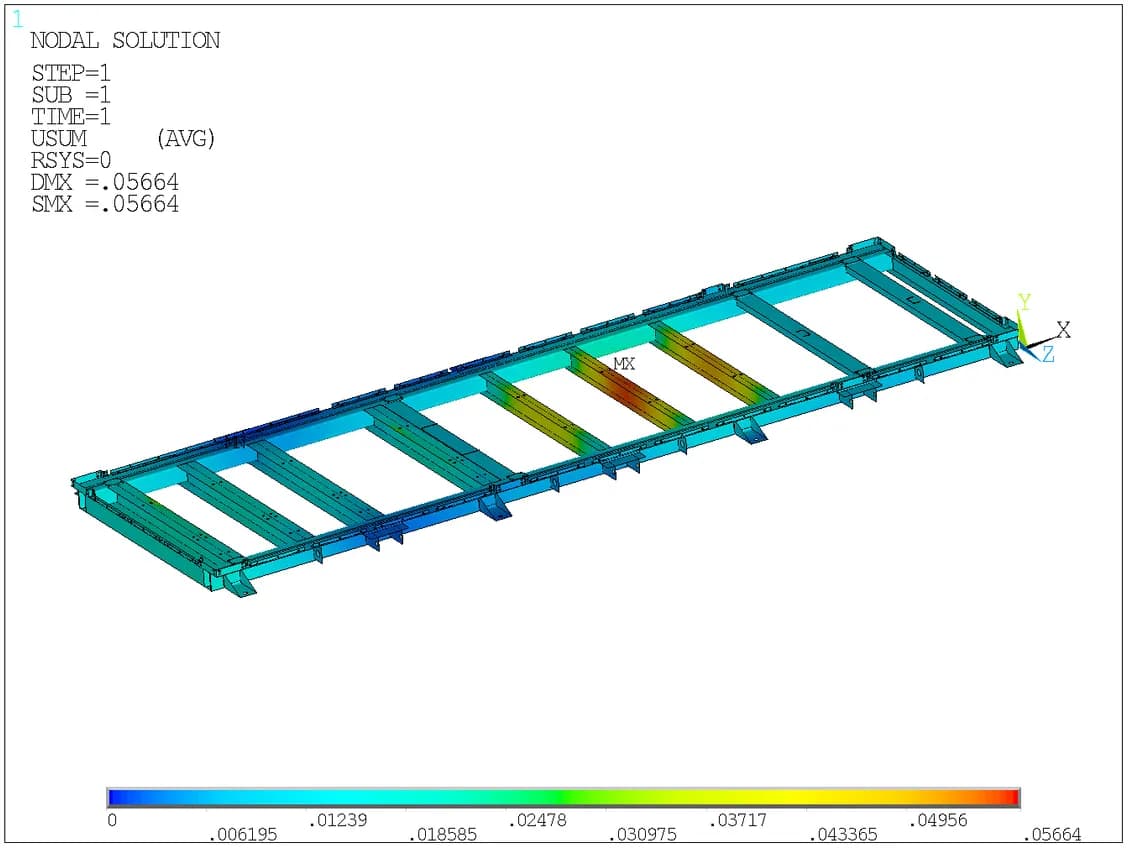
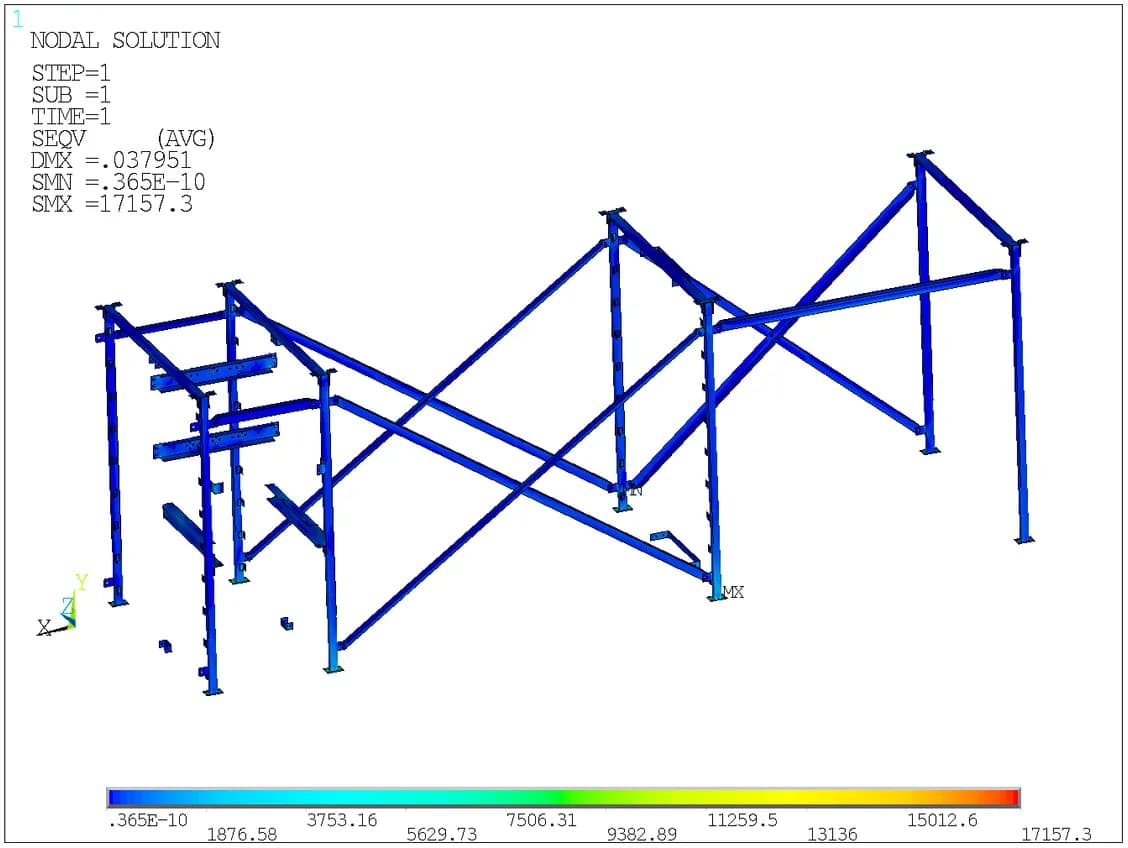
Base-frame displacement
The lifting case reports a maximum base-frame displacement of 0.056 in. The base-frame stress is 14.805 ksi
Case 3-2 · sidewall panel
The superstructure reaches approximately 17.2 ksi. The detailed plot and final table differ slightly in the last digits; the rounded value captures the reported result
13 / Result Comparison
Identify the governing component in every case
| CASE | GOVERNING LISTED ASSEMBLY | PEAK STRESS |
|---|---|---|
| 1-1 | Sidewall panel | 27.008 ksi |
| 1-2 | Sidewall panel | 26.327 ksi |
| 2-1 | Sidewall panel | 32.071 ksi |
| 2-2 | Sidewall panel | 32.014 ksi |
| 3-1 | Superstructure | 29.025 ksi |
| 3-2 | Sidewall panel | 31.785 ksi |
| 4-Lifting | Superstructure | ≈17.2 ksi |
Based on the component maxima in Table 8, revision 02, page 86. Reference yield strength: 36.3 ksi
The comparison shows why a component-level review matters. Wall panels govern five of the six service cases, while the superstructure governs the longitudinal seismic case and lifting. The roof and base frame remain part of the assessment even where they do not set the largest stress value
Project Outcome
A structural assessment with traceable findings
The work established an FE representation of the electrical shelter and documented its response across seven defined loading cases. The component comparison identifies the most highly stressed assemblies and the locations that deserve attention during design review
Stresses below the stated material yield
The report concludes that stresses remain below yield under the simulated conditions. The peak listed component stress is 32.071 ksi against a stated yield strength of 36.3 ksi