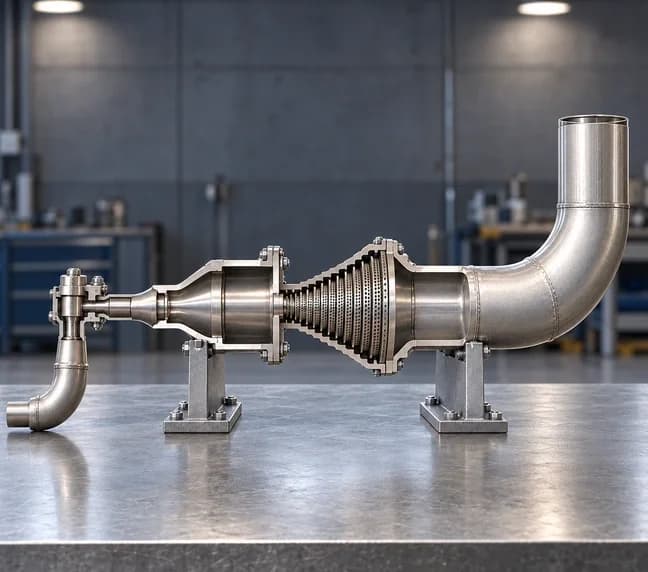
Control Valve and Expander Duct
We assessed gas flow through a plug valve and a staged orifice pack, then mapped the pressure letdown, thermal change and high-speed discharge for design review
ICON ENGINEERING SERVICES / CFD ANALYSIS
Control Valve and Expander Duct
- Requirement
Understand the pressure letdown
Assess the valve, expander and perforated plates under the specified gas conditions. Report flow behaviour within the assembly and beyond the outlet
- Challenge
A changing gas flow field
The gas passes through narrow restrictions before discharging into an extended domain. Pressure, temperature and velocity change markedly along this path
- Deliverables
A documented CFD assessment
We prepared domain and sampling-plane views, contour plots and velocity vectors. Location tables record the revised case for the client’s design review
- Revised-case orifice pack
- 15 plates
- Fully open valve lift
- 45 mm
- Result extraction framework
- 5 planes
CAD AND PREPROCESSING
The geometry and analysis domain
01 Valve and orifice geometry
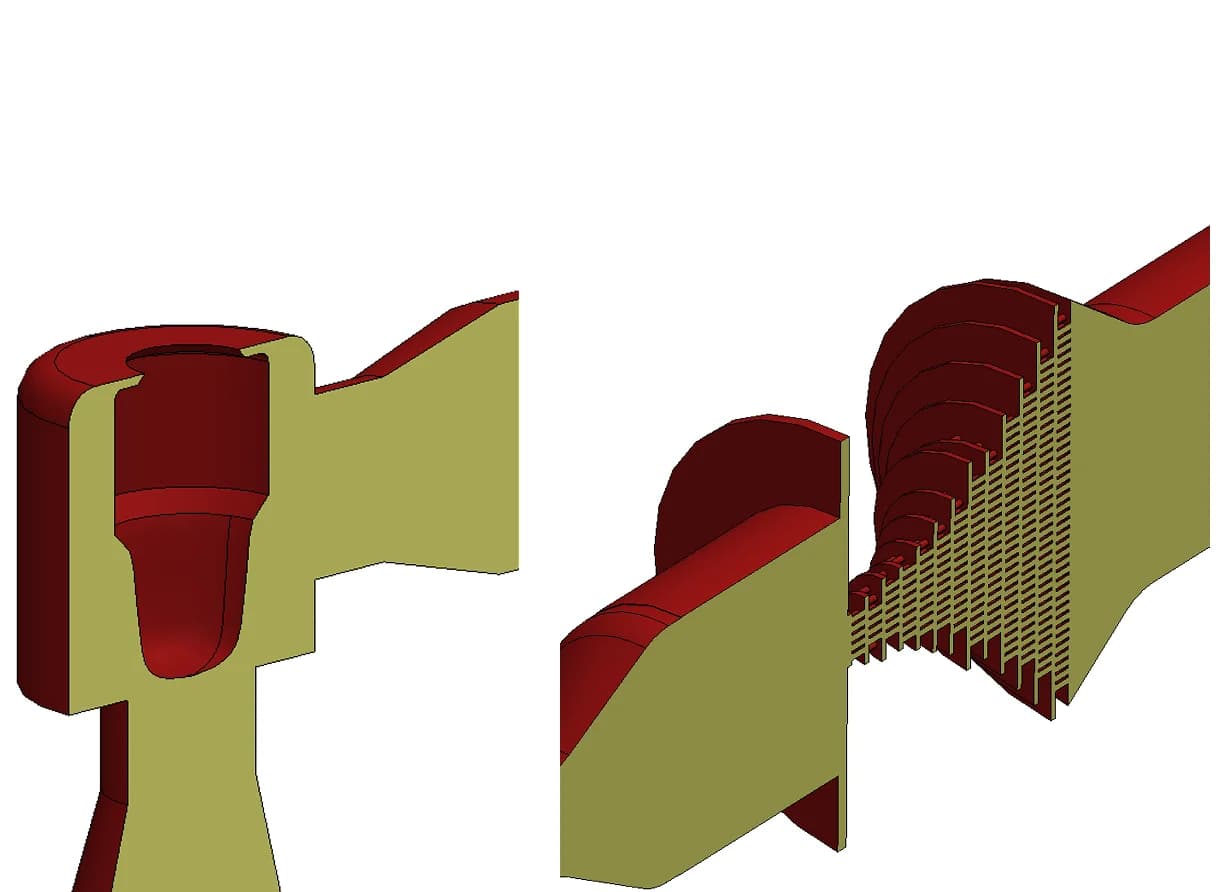
Original plug-valve and orifice-stack sections
We defined the fully open plug and the 15-plate restriction pack in the CFD geometry. Section views expose the internal passages that control the flow
02 Outlet domain extension
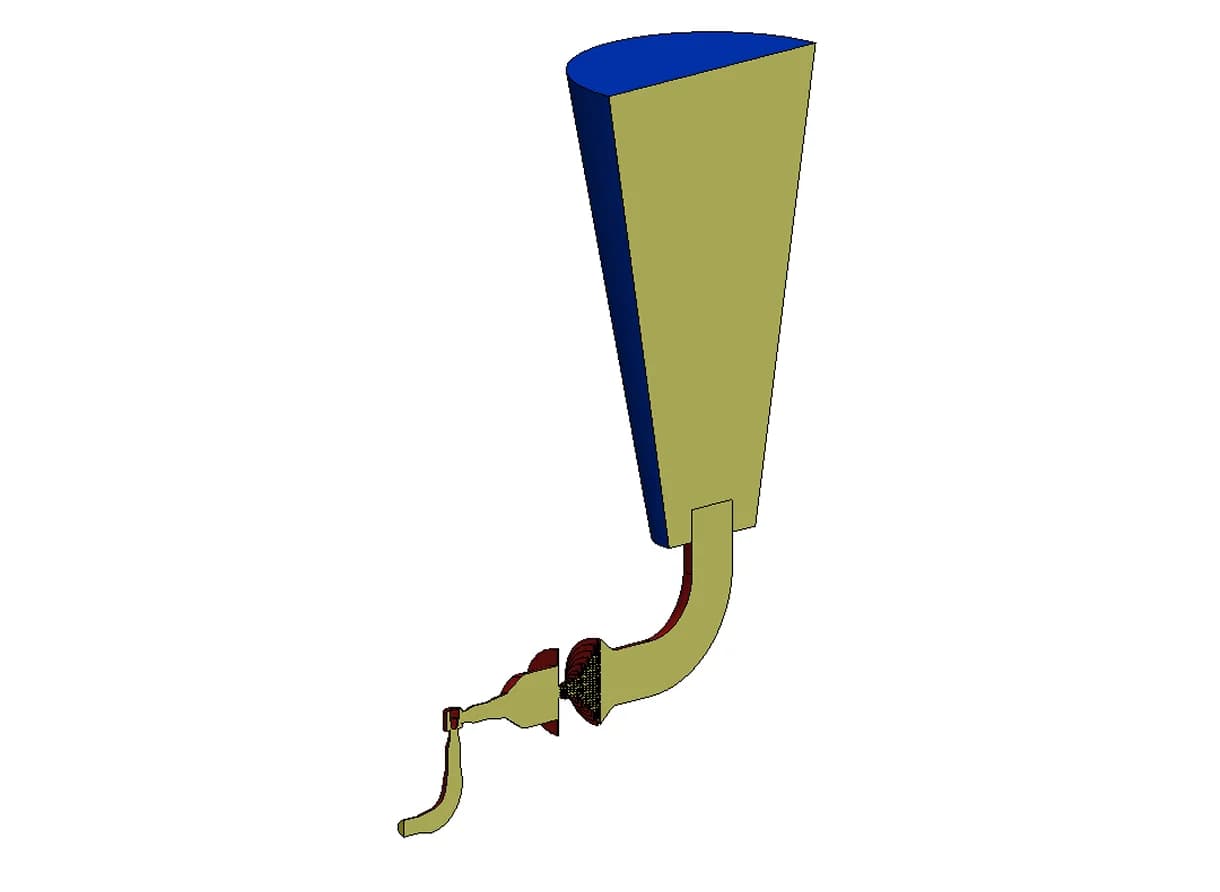
R01 model. Static temperature on the central plane
The fluid domain extends beyond the physical outlet. This allows the discharge region and the section 1 m downstream to form part of the reported assessment
03 Whole-system and valve planes
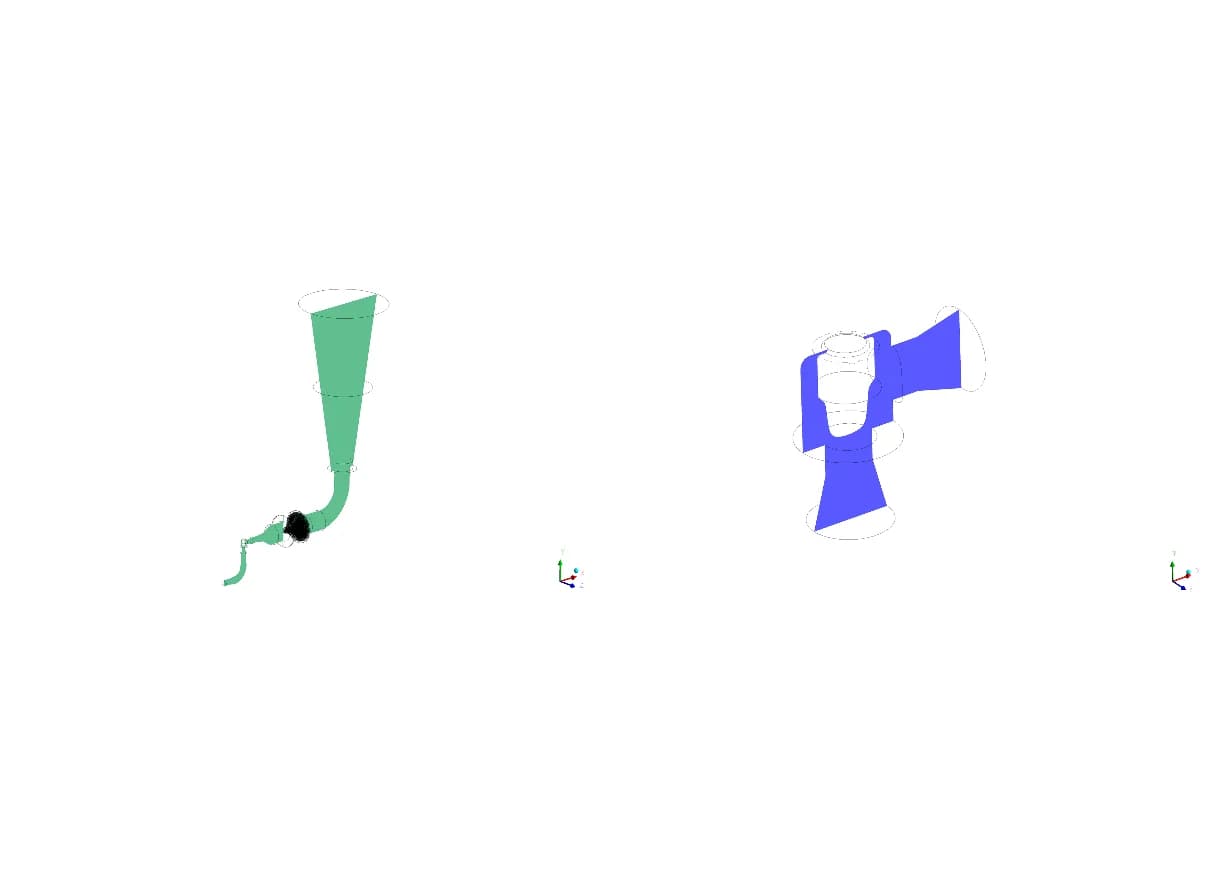
Plane 01: full domain. Plane 02: valve region
We used a central system plane to follow the flow path and a local plane through the valve to examine the inlet, plug restriction and outlet region
04 Orifice and discharge planes
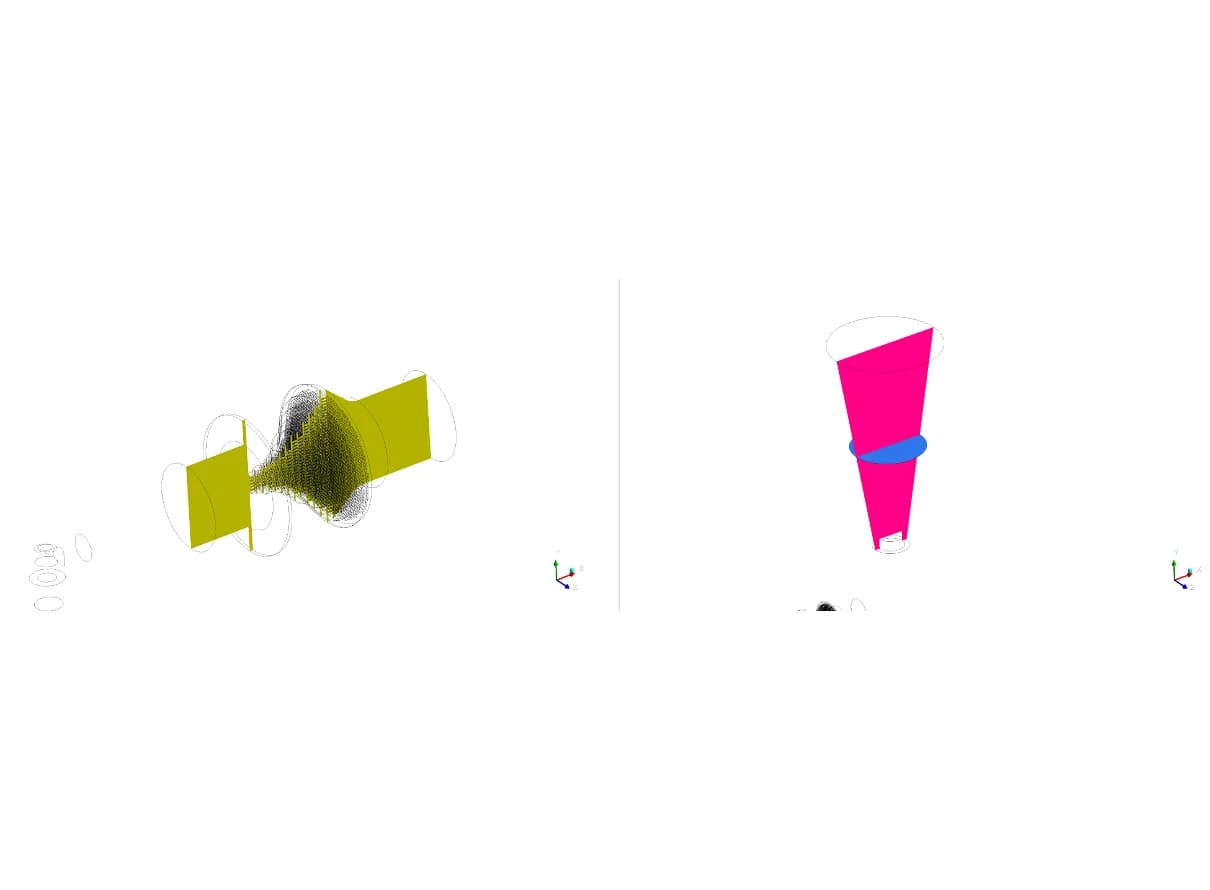
Plane 03: orifices. Planes 04–05: discharge and 1 m section
We sampled the orifice pack on a central plane. Discharge and downstream planes provide a consistent reference for comparing the outlet region
OPERATING CONDITIONS
The documented revised-case setup
The opening schedule provided a geometric basis for the airflow model. It distinguished roof-monitor louvres from façade louvres and individual shutters, allowing the result tables to trace flow through named openings
| PARAMETER | R01 REPORT VALUE |
|---|---|
| Inlet pressure | 136 kg/cm² gauge |
| Inlet temperature | 186.8 °C |
| Outlet pressure | 0 Pa gauge |
| Valve opening | Full open, 45 mm lift |
| Flow figure in setup | 44,172 kg/h |
| GAS SPECIES | COMPOSITION |
|---|---|
| Ammonia, NH3 | 48.8% |
| Carbon dioxide, CO2 | 44.3% |
| Water vapour, H2O | 3.4% |
| Hydrogen, H2 | 3.5% |
Documented approach: steady-state species transport with smooth, no-slip, adiabatic walls and a broadband turbulence-noise model The original scope used 46,500 kg/h as a reference maximum. The 44,172 kg/h figure above is listed in the February setup
ANALYSIS DEVELOPMENT
The study developed through successive reviews
December 2022Define the case
Geometry, gas properties and boundary conditions established the analysis scope
January 2023Review the gas model
The archive records a species-flow rerun addressing the expansion-related temperature response
20 February 2023Assess the R01 model
The revised 15-plate geometry received a dedicated set of contours and location results
22 February 2023Examine flow direction
A companion vector report added local views of the valve, orifice pack and discharge
REVISED-CASE RESULTS
Pressure and temperature across the assembly
05 Pressure distribution
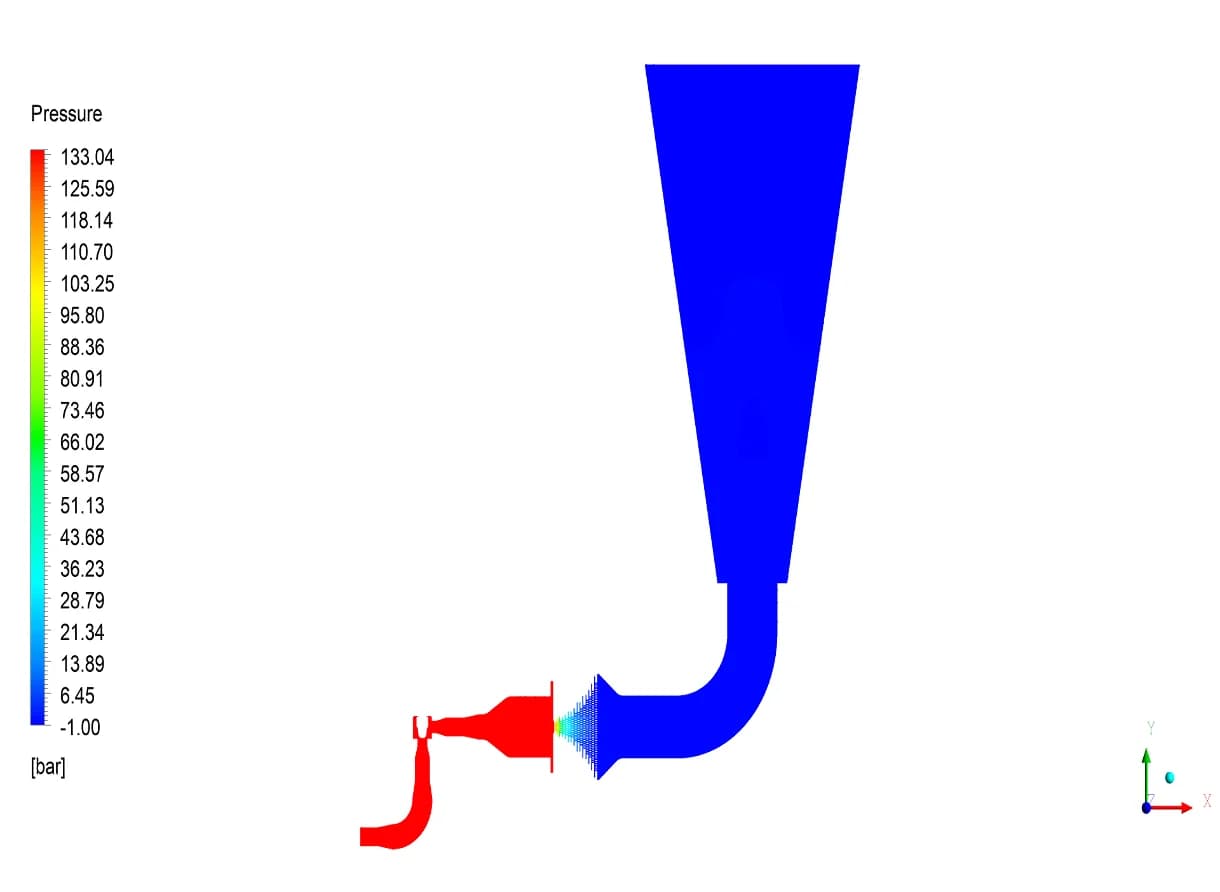
R01 model. Static pressure on the central plane
The reported pressure falls from 134.1 bar at the system inlet to 0.6 bar at the system outlet. The contour locates this change within the valve and staged restriction path
06 Temperature distribution
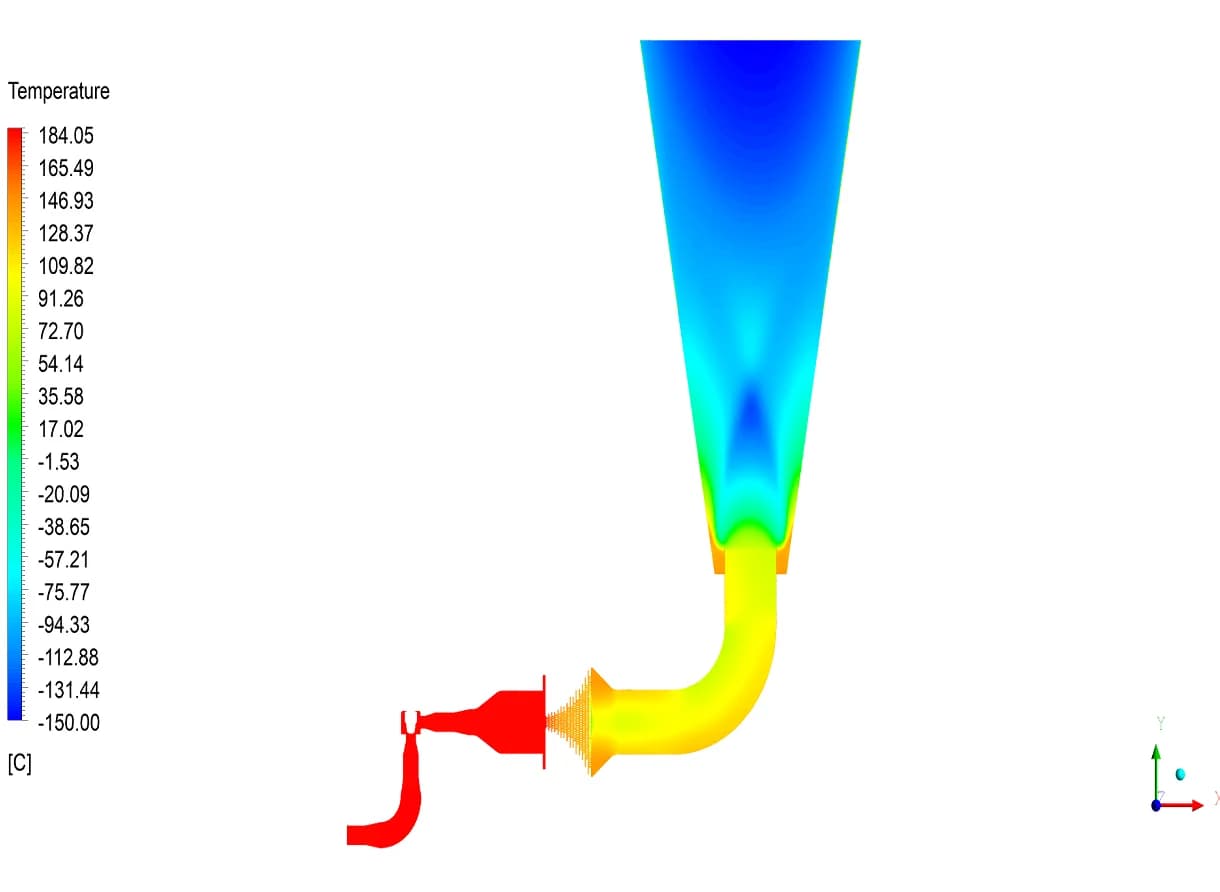
R01 model. Static temperature on the central plane
The revised case reports 186.7 °C at the system inlet and 81.8 °C at the system outlet. The static-temperature contour also shows the colder discharge region
07 Velocity through the valve
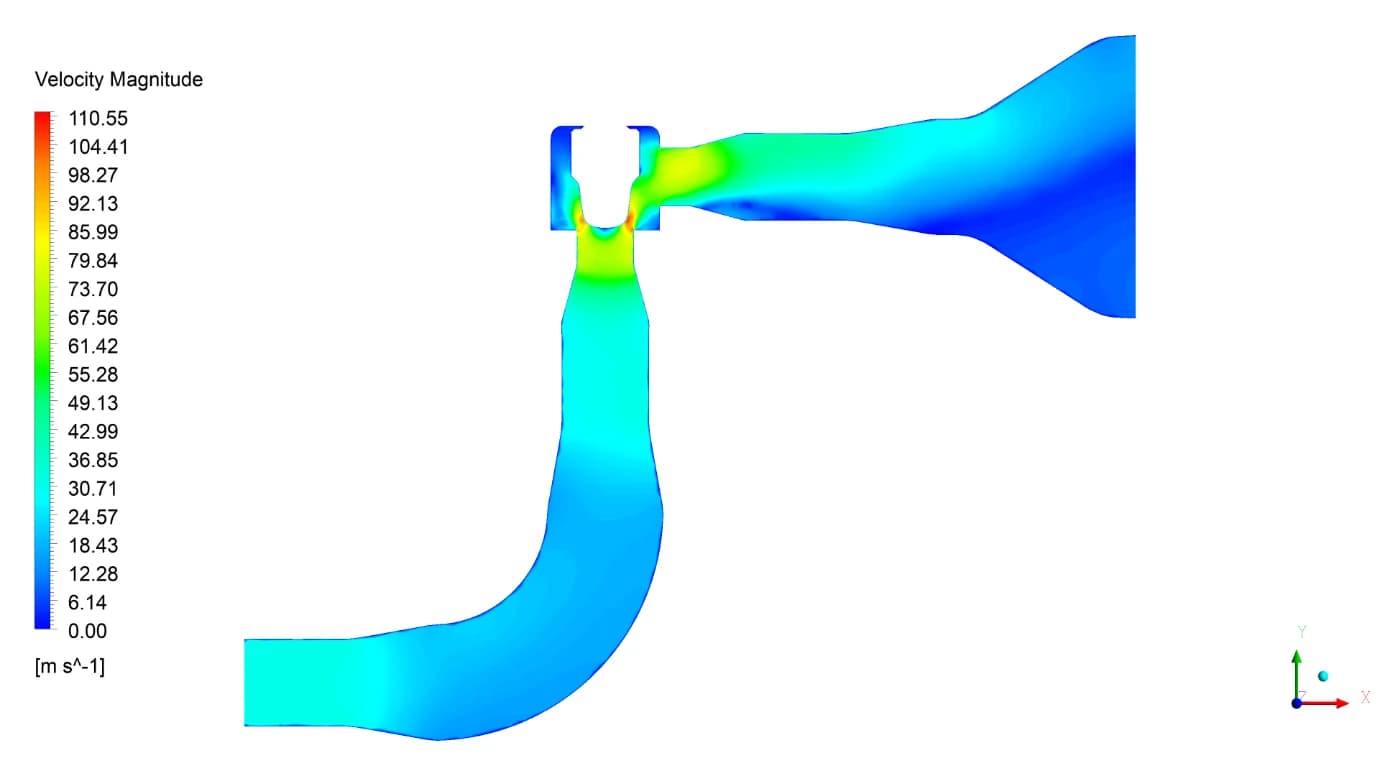
Local valve and expander velocity field
The local view resolves acceleration around the plug and expansion into the downstream passage. The reported average velocity changes from 33.9 m/s at the valve inlet to 43.5 m/s at its outlet
08 Velocity through the plates
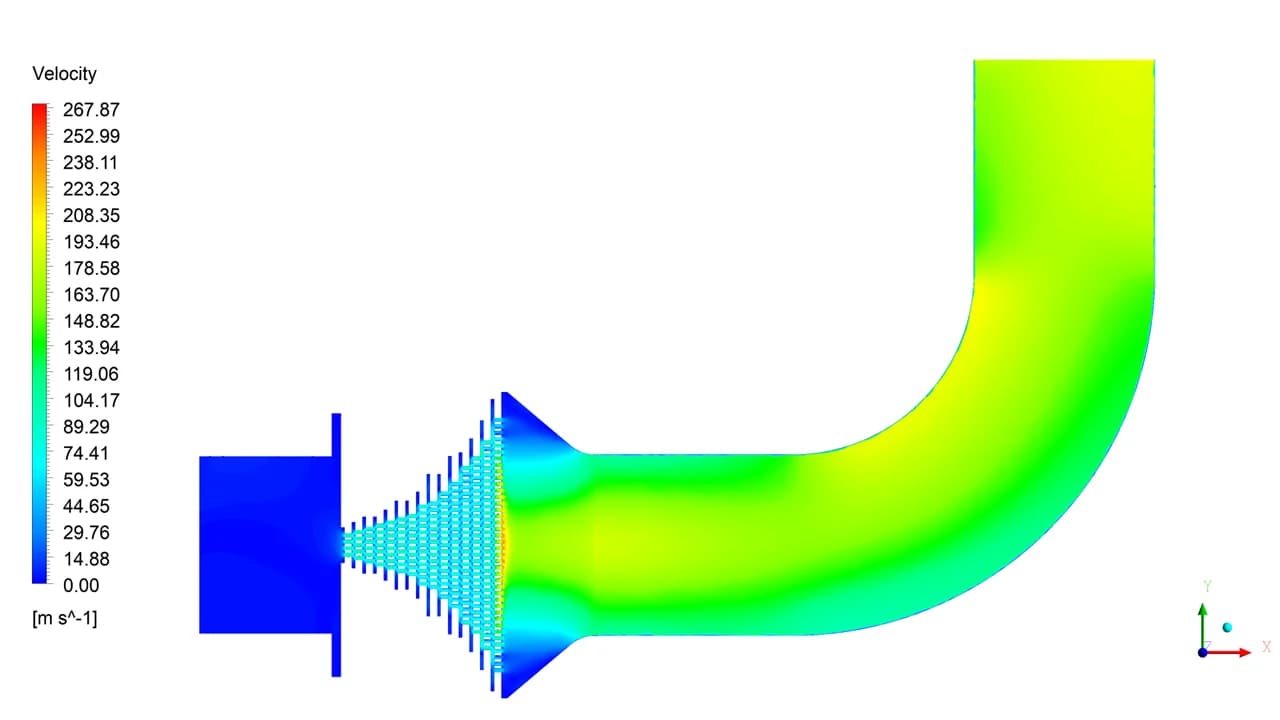
Successive restrictions and the outlet elbow
The perforations produce distinct jets and redistribution between stages. The table reports 13.4 m/s at the pack inlet and 180.9 m/s after plate 15, followed by further outlet acceleration
FLOW DIRECTION
Vectors reveal the local flow structure
09 Flow around the plug
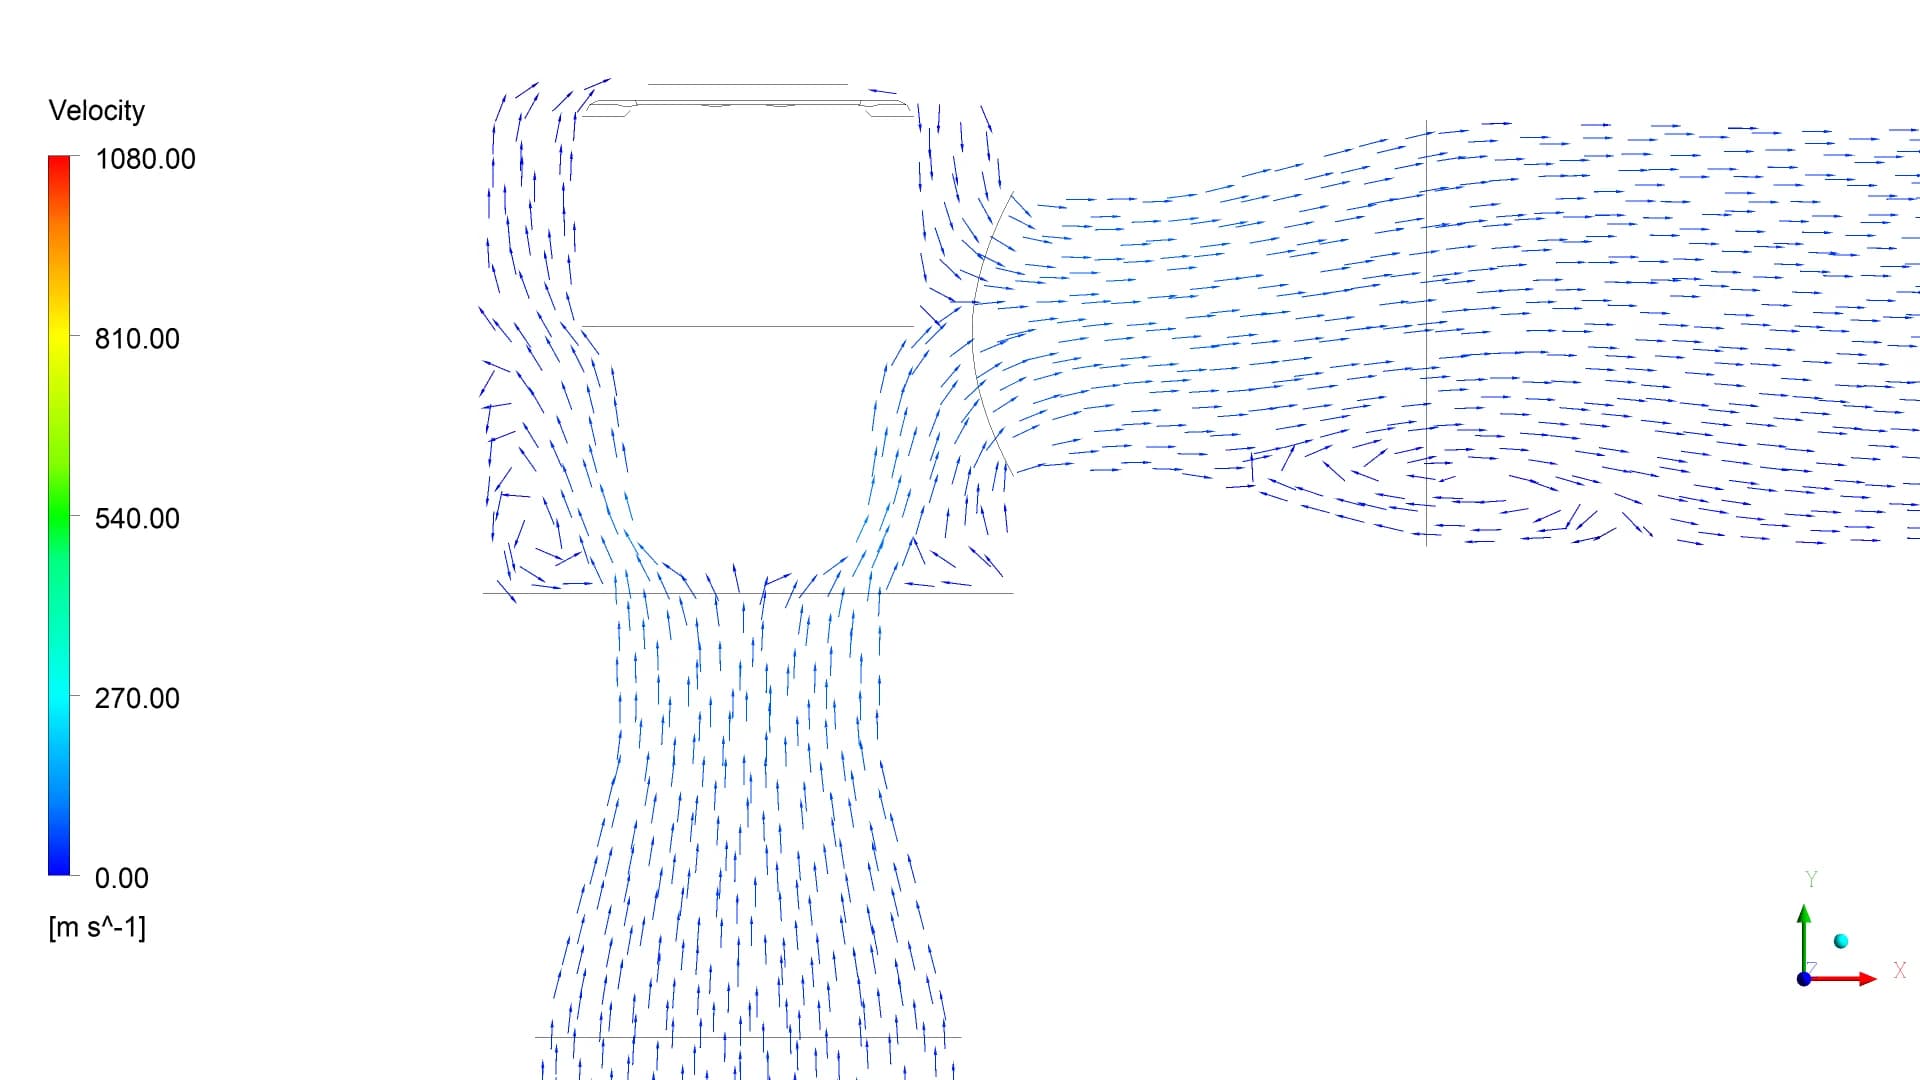
Original vector detail from the February companion report
The vectors show how the inlet flow turns around the plug and enters the expanding passage. This view complements the velocity-magnitude contour
10 Flow through the orifice pack
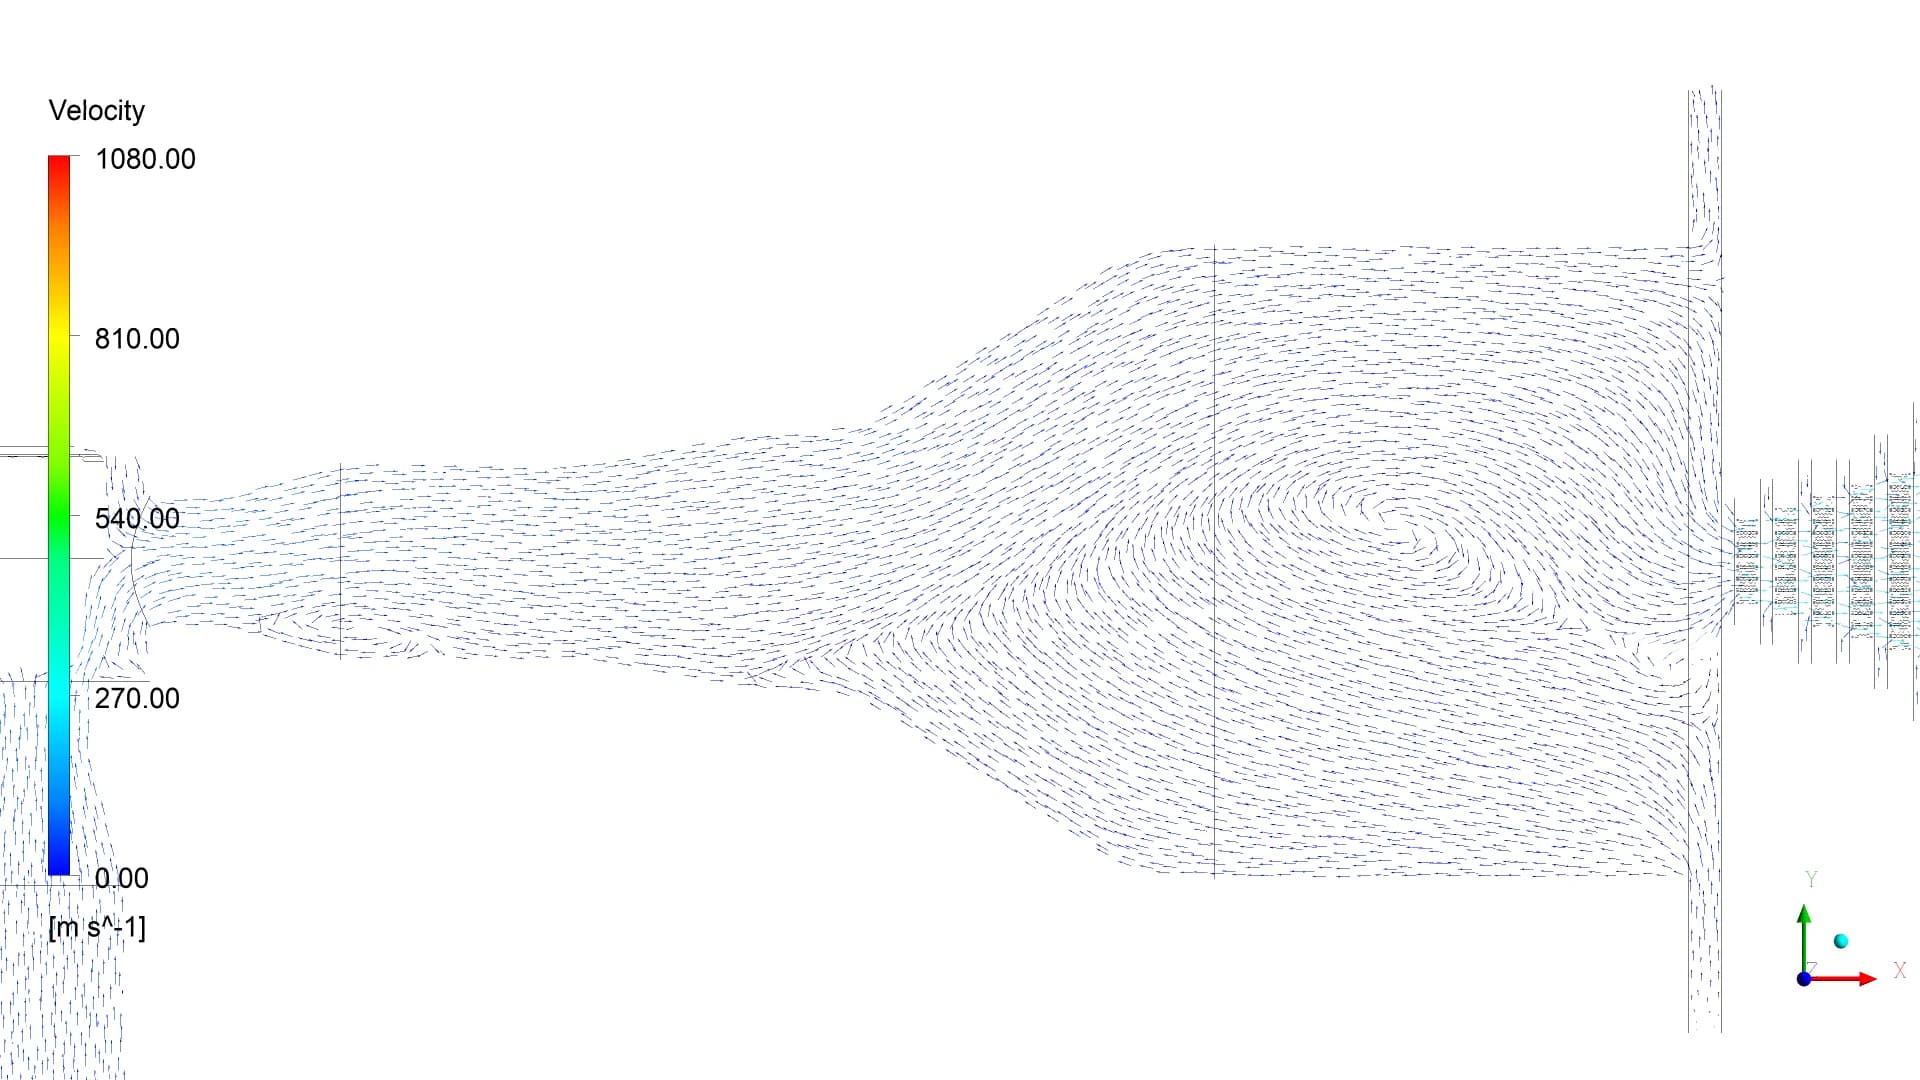
Original vector detail through successive plate passages
The local vectors show the jets through the perforated stages. They make the flow direction and changing passage area visible across the restriction pack
THE DISCHARGE REGION
Thermal change, velocity and acoustic power
Static Temperature
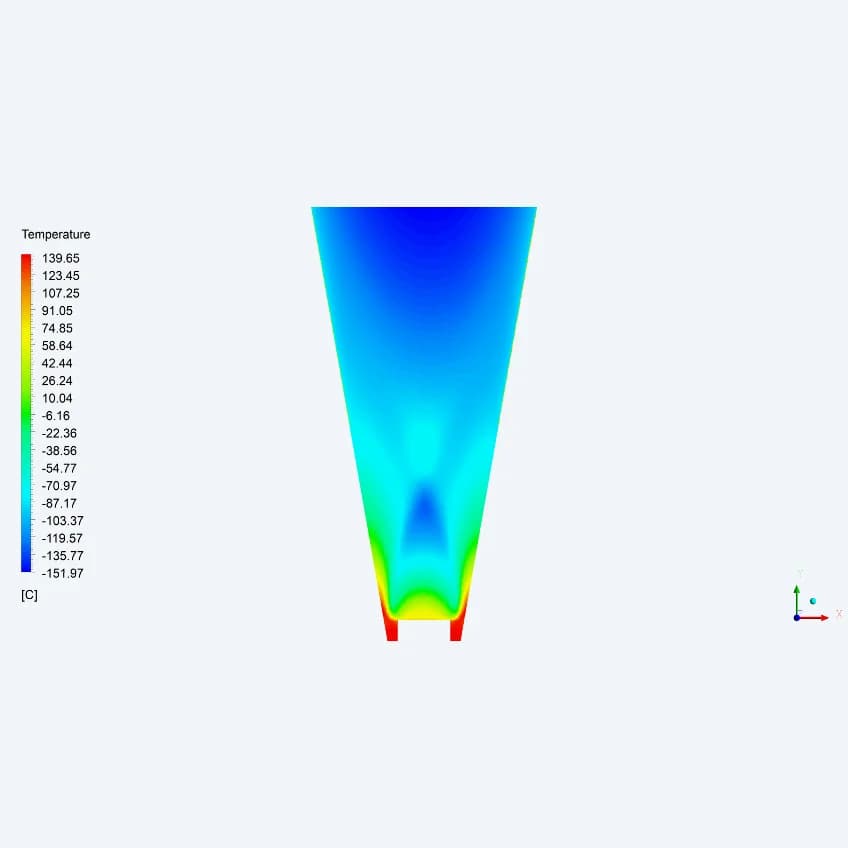
−90.7 °C
Reported at the 1 m location
The axial contour shows the cold core of the expanding discharge. The workbook records −90.7 °C at the specified downstream location
Discharge Velocity
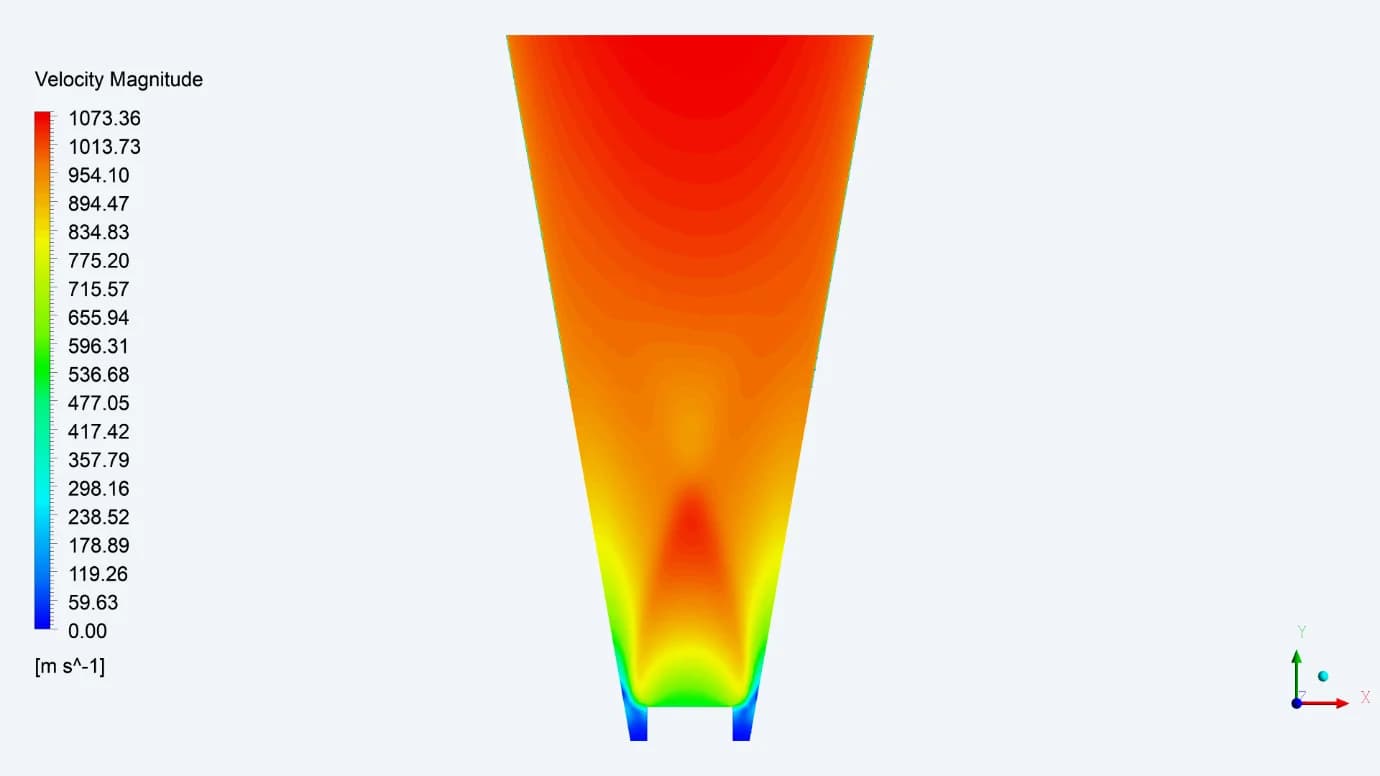
854.2 m/s
Reported average at the 1 m location
The whole-domain report identifies a local peak of 1073.4 m/s. This peak is distinct from the average value at the downstream location.
Acoustic Power
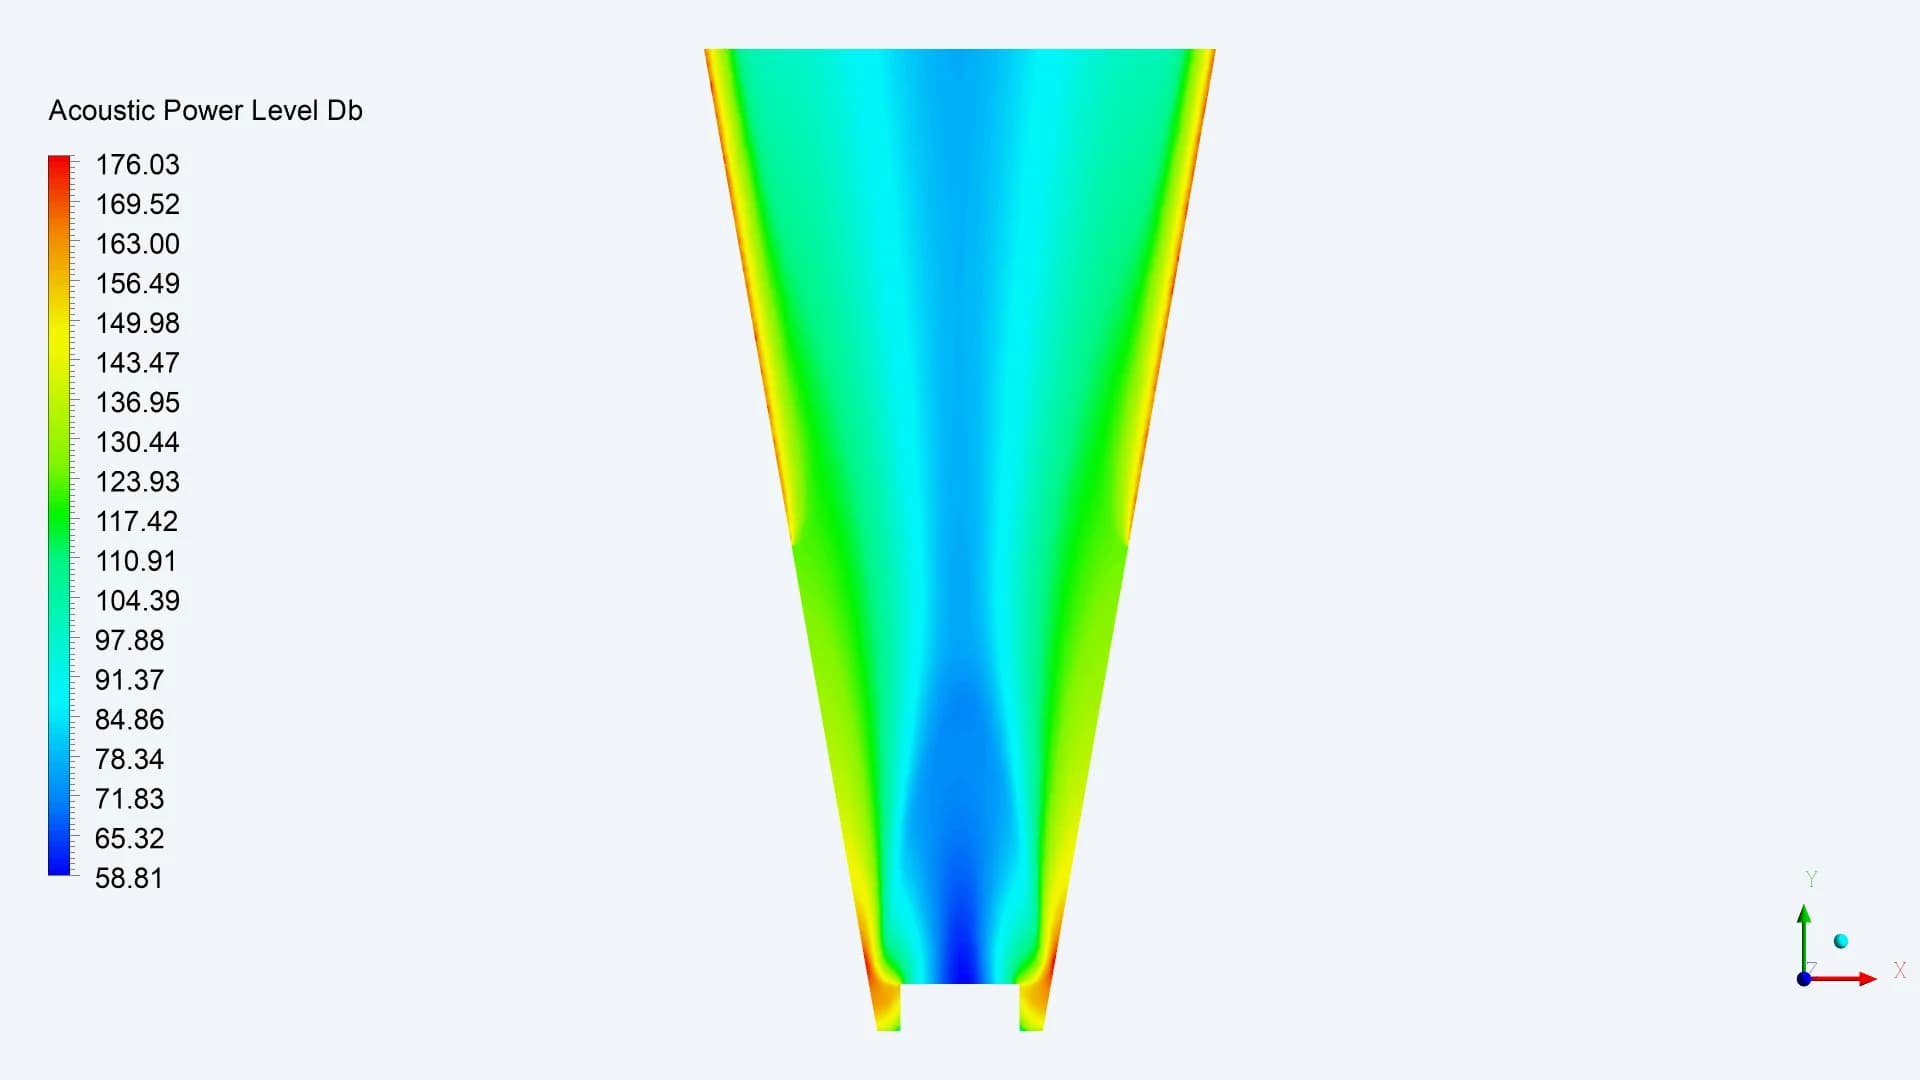
80.4 dB PWL
Reported at the 1 m location
The acoustic field identifies regions of higher modelled power. The location table provides a PWL value at the downstream reference.
STAGED PRESSURE LETDOWN
The pressure profile through all 15 plates
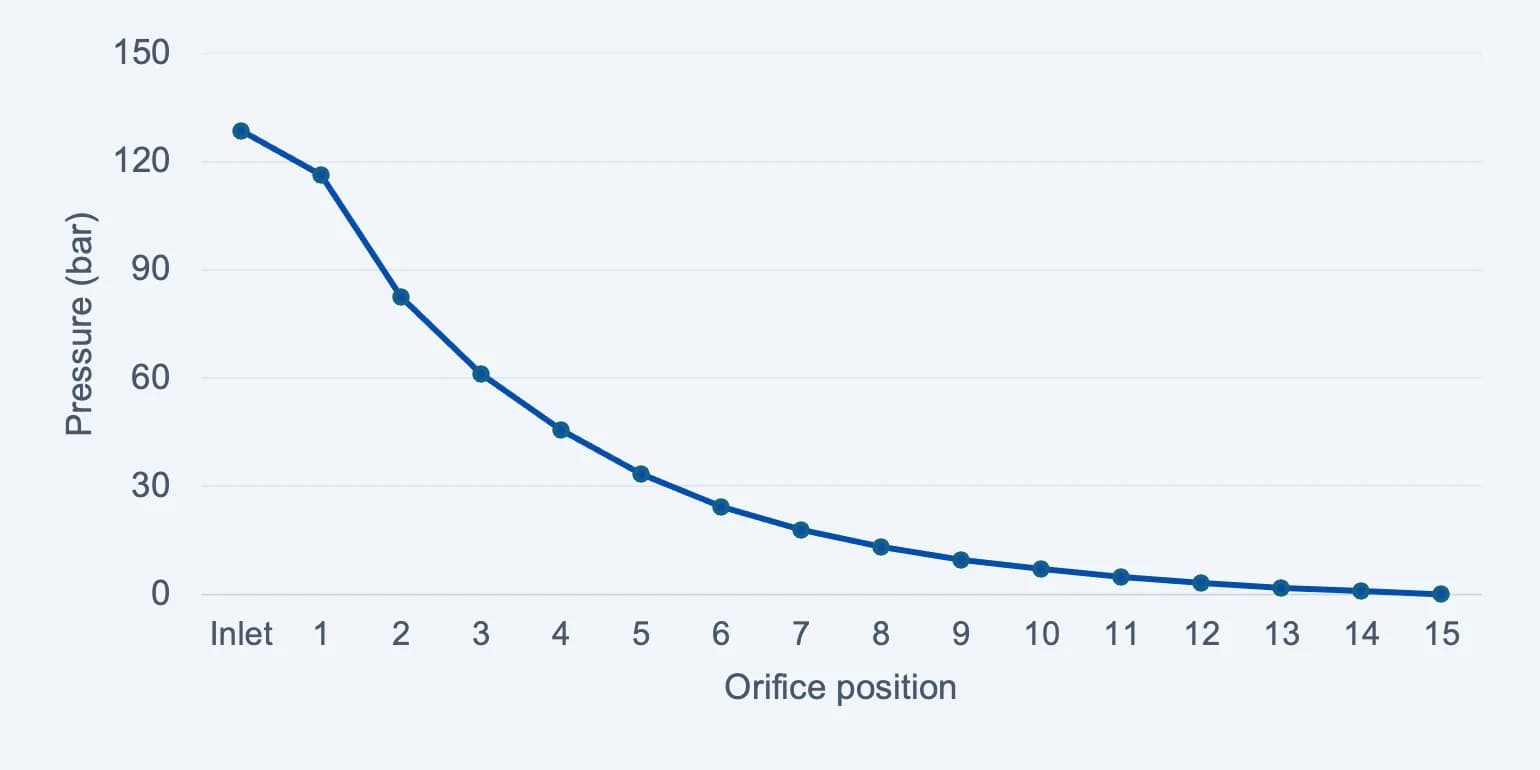
128.5 bar
Reported pack-inlet pressure
0.1 bar
Reported pressure after plate 15
Pressure values at successive locations show how the letdown distributes through the pack
Source: R01 result workbook, pack inlet and orifices 01–15. The system outlet is a separate location downstream of the pack.
Selected locations in the revised case
| LOCATION | PRESSURE (BAR) | TEMP (°C) | AVG. VAL. (m/s) | PWL (dB) |
|---|---|---|---|---|
| System inlet | 134.1 | 186.7 | 33.2 | 0.0 |
| Valve inlet | 134.1 | 186.7 | 33.9 | 8.8 |
| Valve outlet | 127.7 | 184.8 | 43.5 | 54.0 |
| Orifice-pack inlet | 128.5 | 186.0 | 13.4 | 24.6 |
| After plate 01 | 116.3 | 160.1 | 206.8 | 78.0 |
| After plate 05 | 33.4 | 134.3 | 235.1 | 101.4 |
| After plate 10 | 7.0 | 130.6 | 243.2 | 103.0 |
| After plate 15 | 0.1 | 116.9 | 180.9 | 107.0 |
| System outlet | 0.6 | 81.8 | 450.6 | 55.3 |
| 1 m from outlet | -1.0 | -90.7 | 854.2 | 80.4 |
Source: revised-case workbook. Result pressures retain its bar labels. The operating boundary pressure is separately specified as gauge
From a complex flow path to a clear design discussion
The study established where particles focus, where they disperse and how that behaviour changes with size and flow. It provided an evidence-led basis for the next air-sampler design decisions