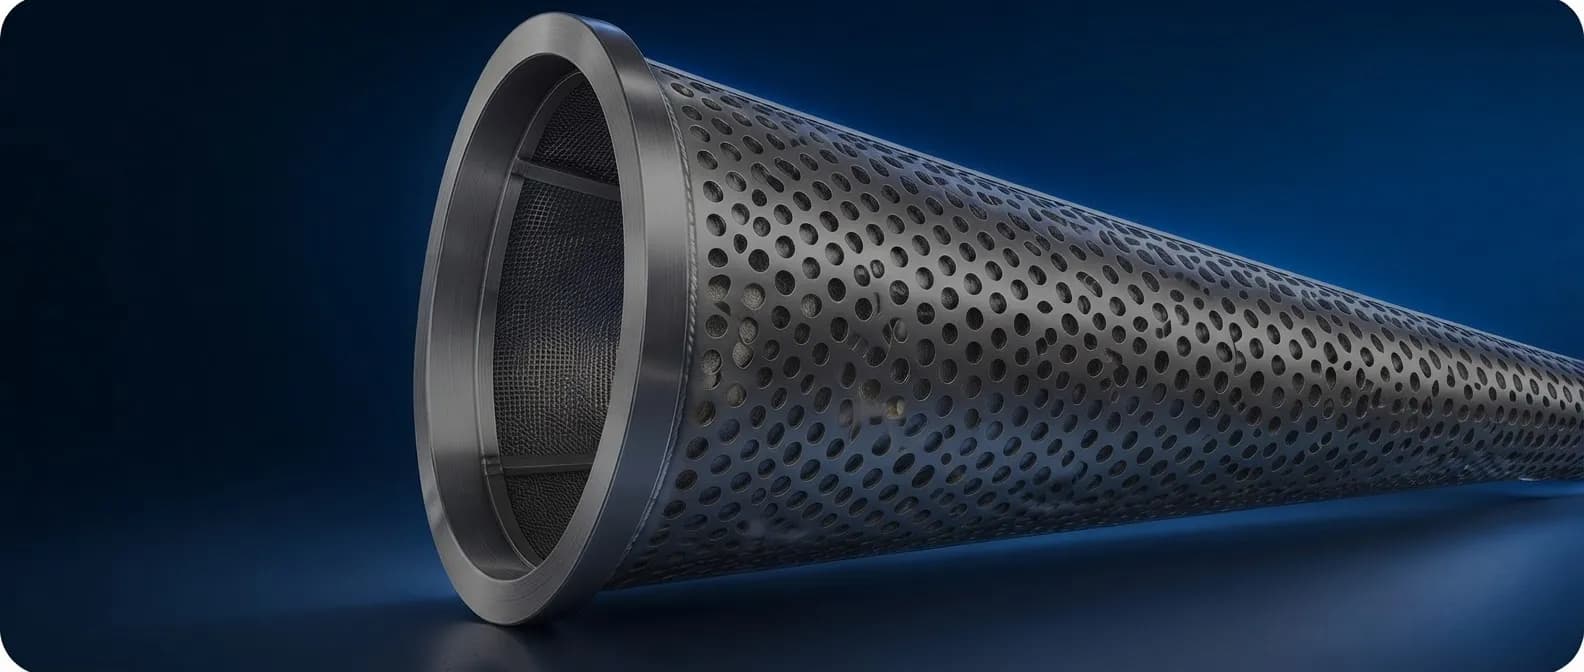
16 Inch Conical Strainer
Understanding pressure loss and flow
Product Design & Development
16-Inch Conical Strainer
- Requirement
Pressure loss through the strainer
Cadalan needed a pressure-drop assessment for a 16-inch conical strainer at the specified process-gas flow rate, supported by a clear view of the internal flow.
- Challenge
Flow through a layered screen
The perforated sheet and mesh combine to restrict the flow area. We needed to assess the pressure loss and the flow redistribution around the cone and branch.
- Deliverables
A documented CFD assessment
Our work covered the CFD domain, screen resistance inputs, operating conditions and result interpretation. The report presents pressure and velocity contours, vectors and streamlines.
- Nominal strainer size
- 16 inch
- Reported CFD mesh cells
- 15 million
- Reported pressure drop
- 18.74 kPa
The Analysis Process
How we assessed the strainer flow
01 Strainer Geometry
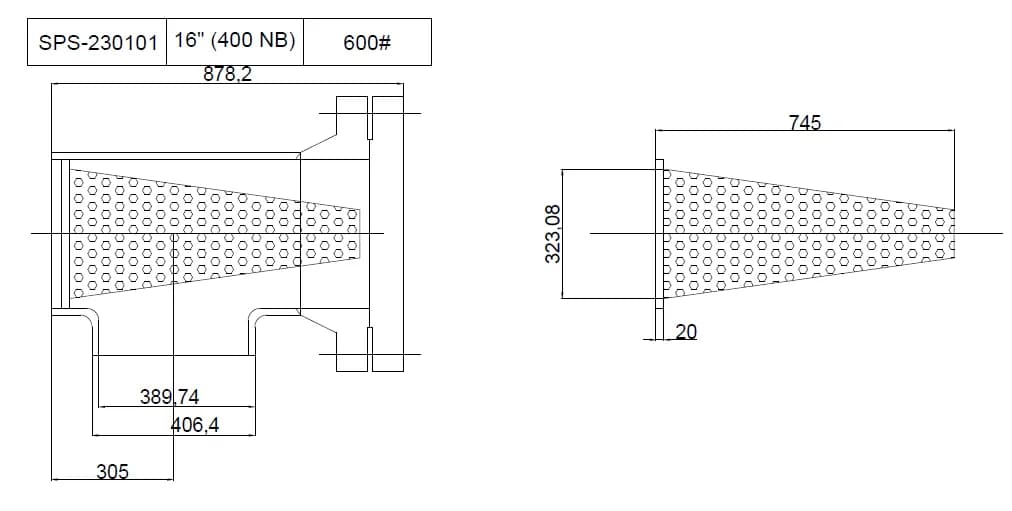
Source drawing for strainer tag SPS-230101
We used the supplied geometry to define the cone and its position in the housing. The drawing establishes the strainer dimensions and perforated construction.
02 CFD Domain and Mesh
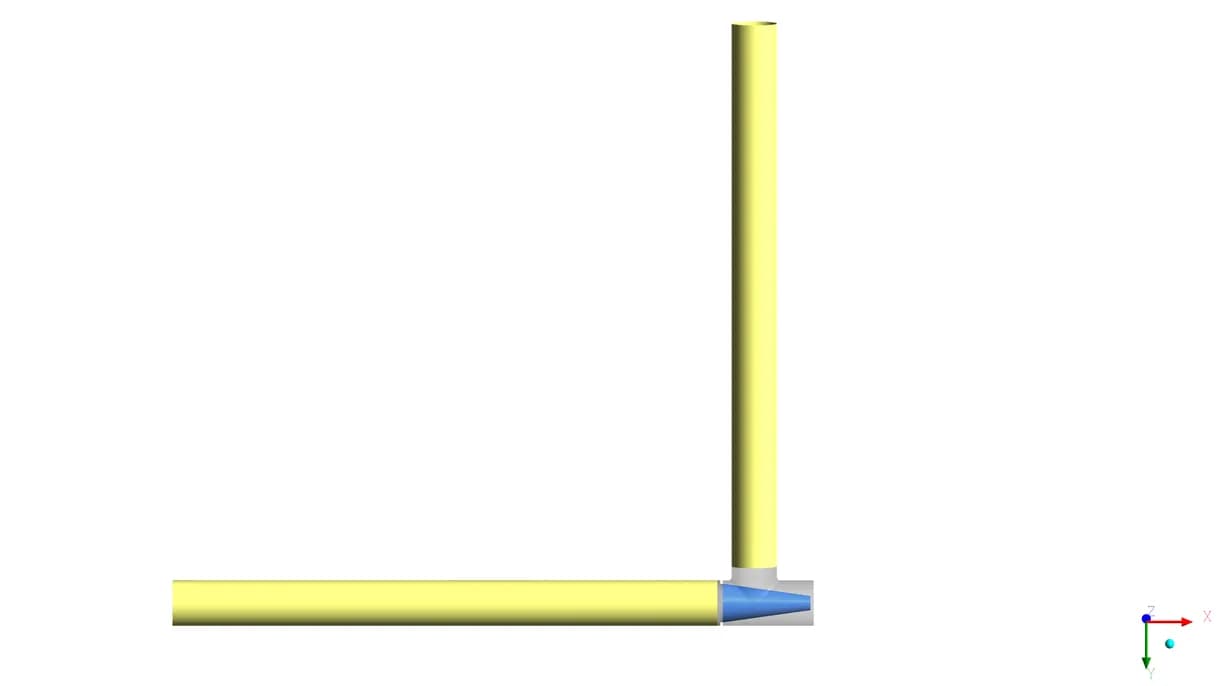
CFD model view. Reported mesh: 15 million cells
We modelled the pipe and strainer flow domain. The report specifies a pipe length of 4.5 m and a CFD mesh of 15 million cells
03 Screen Resistance Inputs
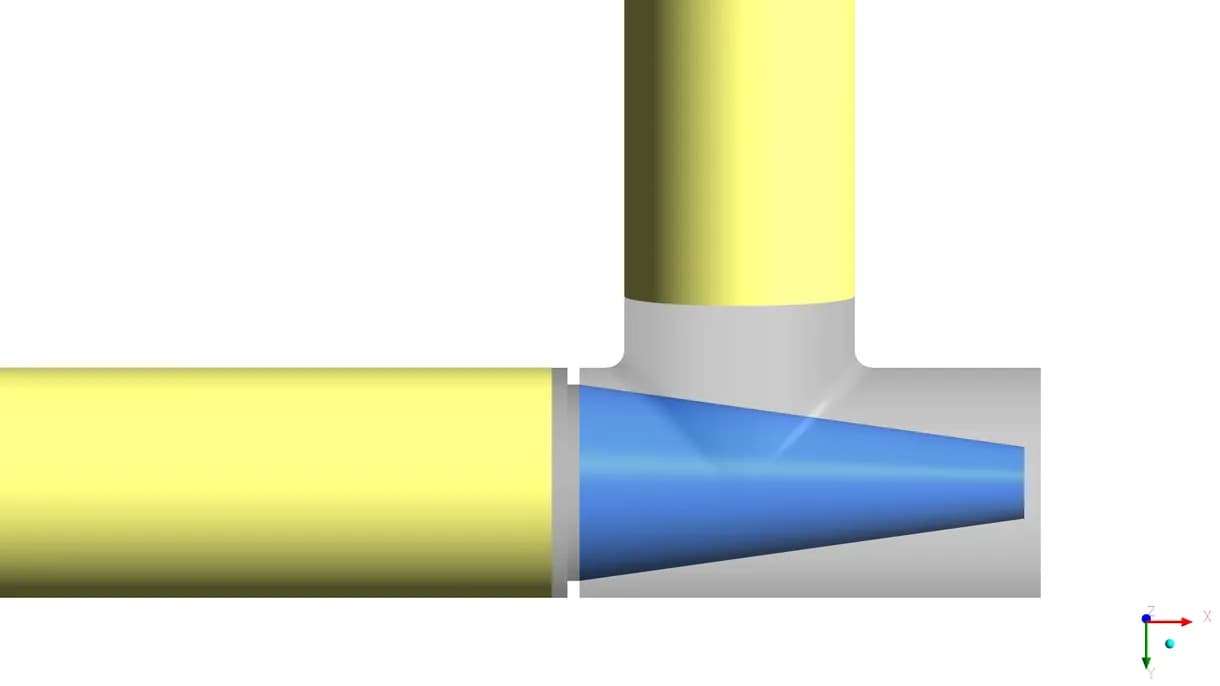
Model detail at the cone and branch junction
The case combines 66.78% perforated-sheet open area with 48.5% open area for mesh code 40. The resulting cumulative open area is 32.39%
04 Operating Conditions
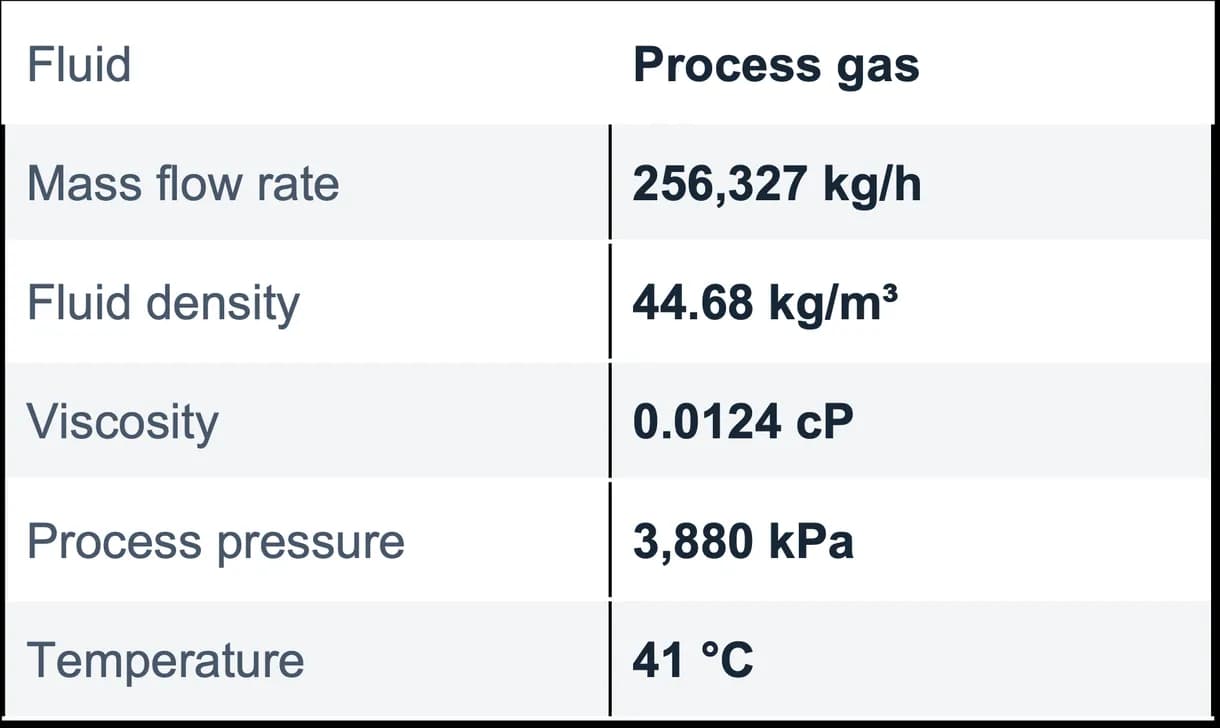
Inputs documented in the CFD report and workbook
We applied the documented fluid properties and operating inputs to evaluate pressure loss and visualise flow through the strainer assembly.
Pressure and Velocity Results
The pressure loss and local flow pattern
Pressure Distribution
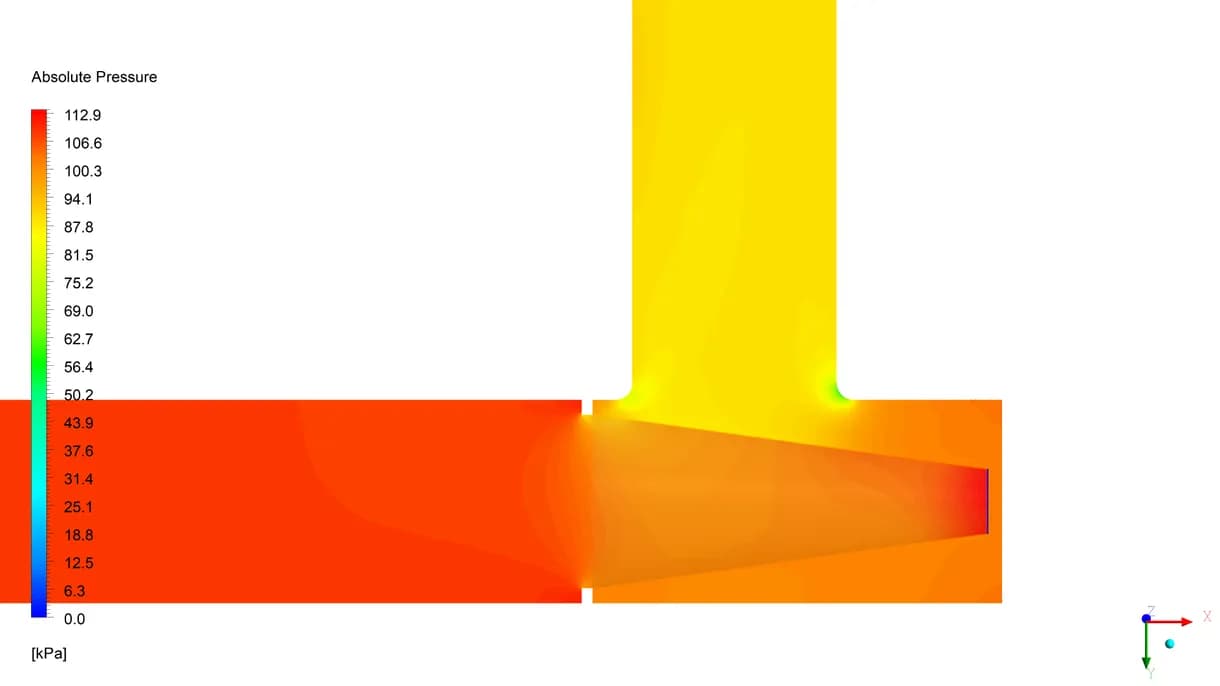
Original pressure contour on Plane-01
The report records a pressure drop of 18.74 kPa for the selected screen configuration. The contour shows the pressure change through the strainer and branch.
18.74 kPa reported pressure drop
Velocity Distribution
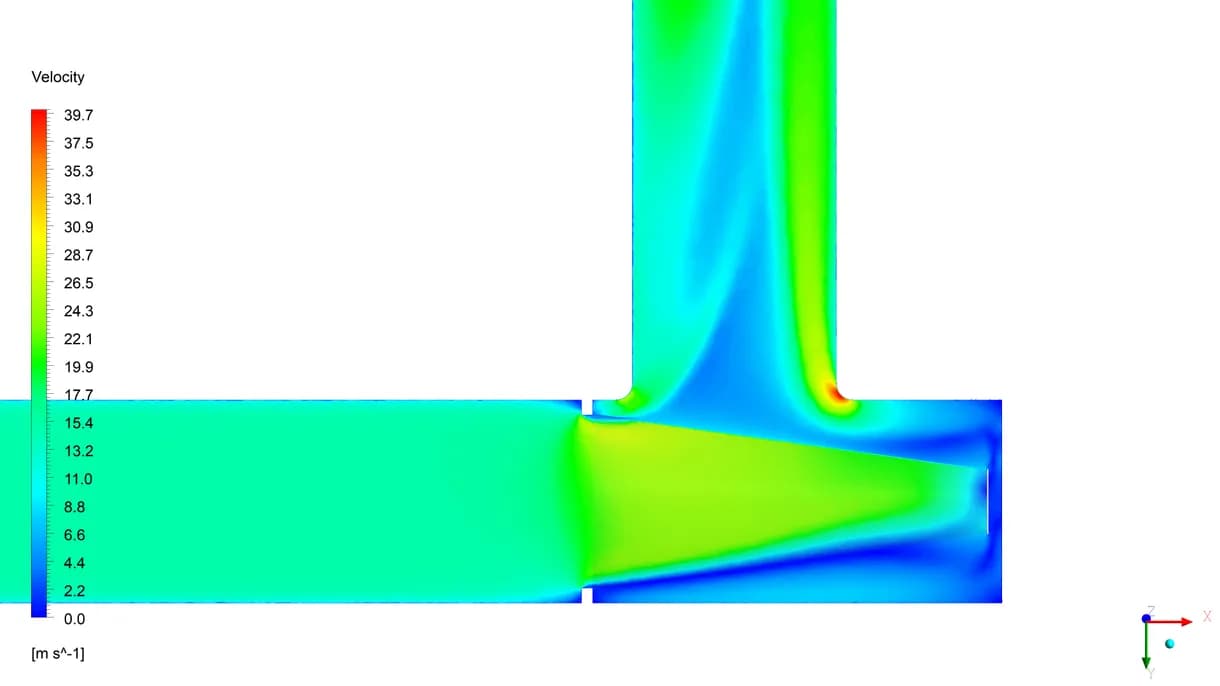
Original velocity contour on Plane-01
The contour shows local acceleration as flow turns into the outlet branch, with lower-velocity regions around the cone tip. It reveals an uneven flow distribution.
Local acceleration near the branch
Pressure drop follows the report and workbook. The archived pressure-plot values differ from the stated process pressure. The reference offset is not documented.
Flow Through the Cone and Outlet
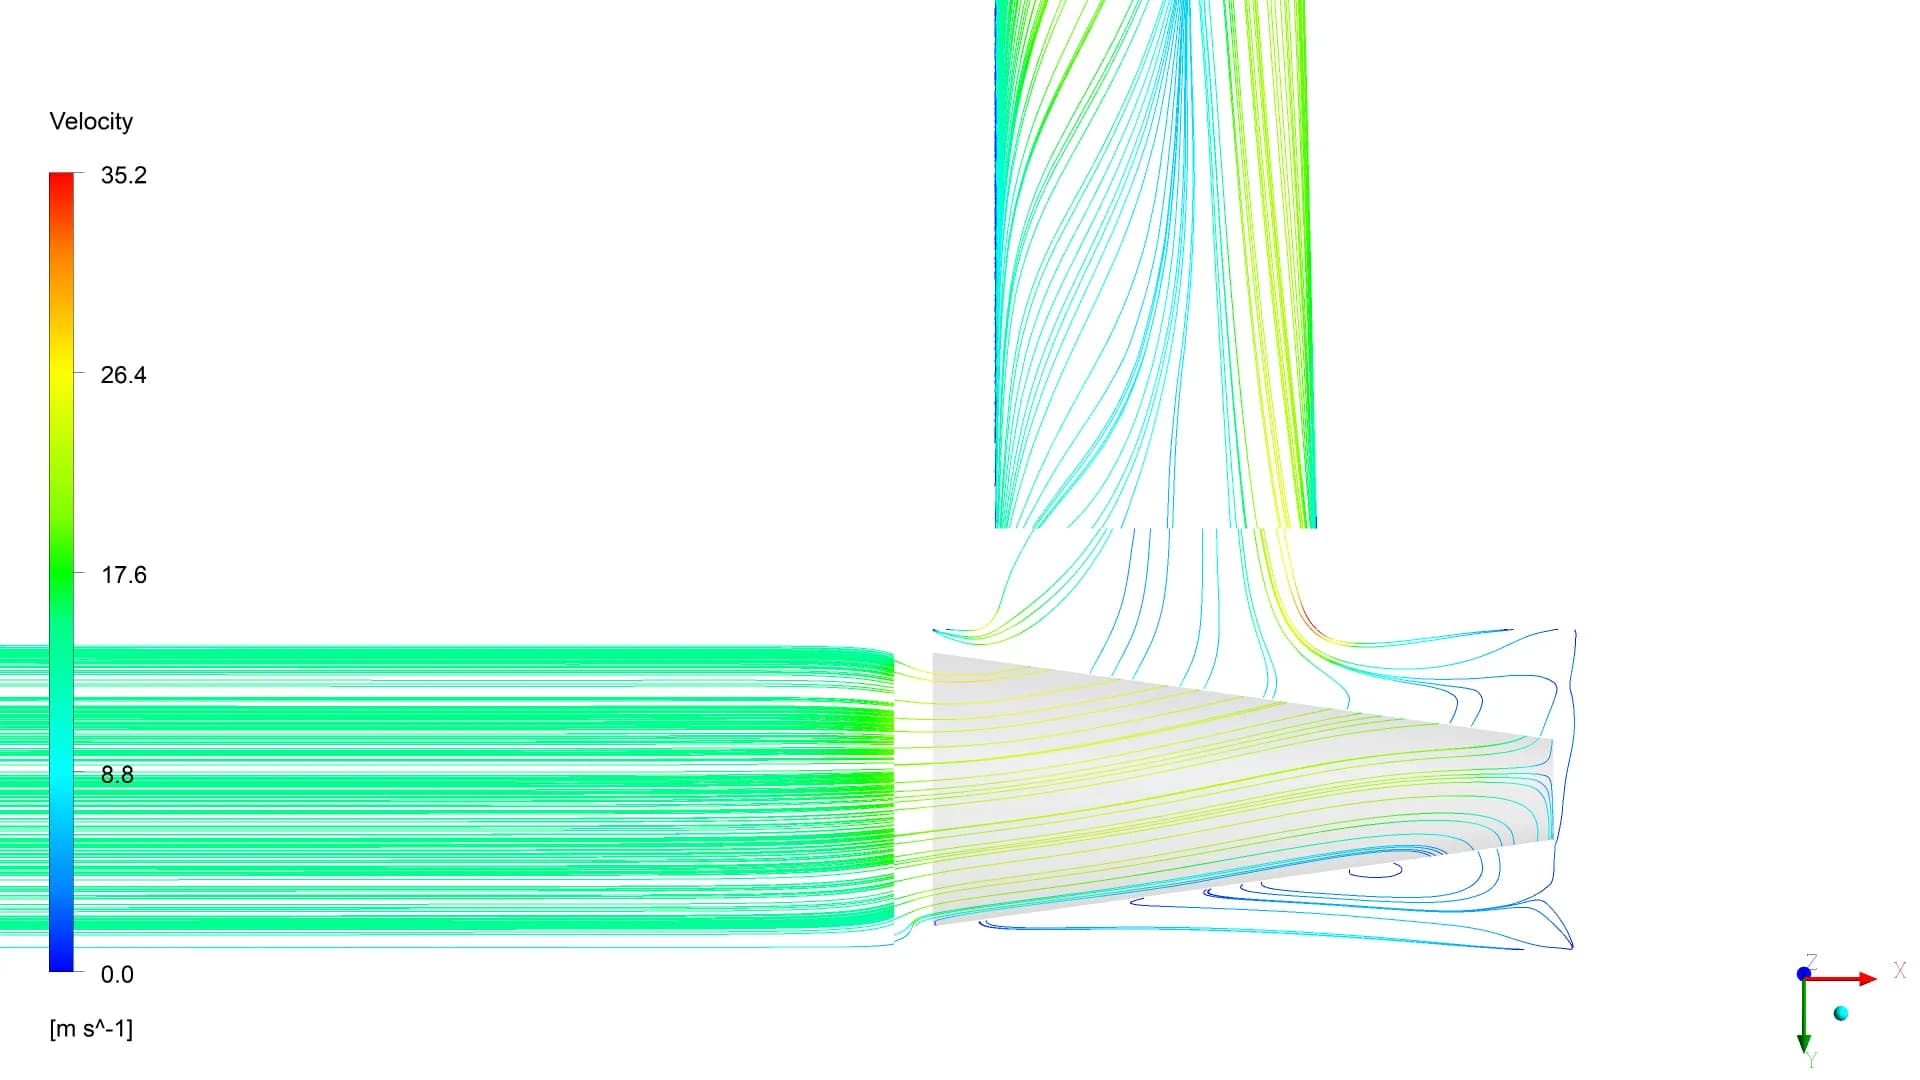
Streamlines reveal the internal flow path
A quantified pressure-loss basis
The study established a reported pressure drop of 18.74 kPa for the documented case. The pressure and velocity views explain how flow redistributes through the strainer, giving the client a loss estimate and visual evidence for design review