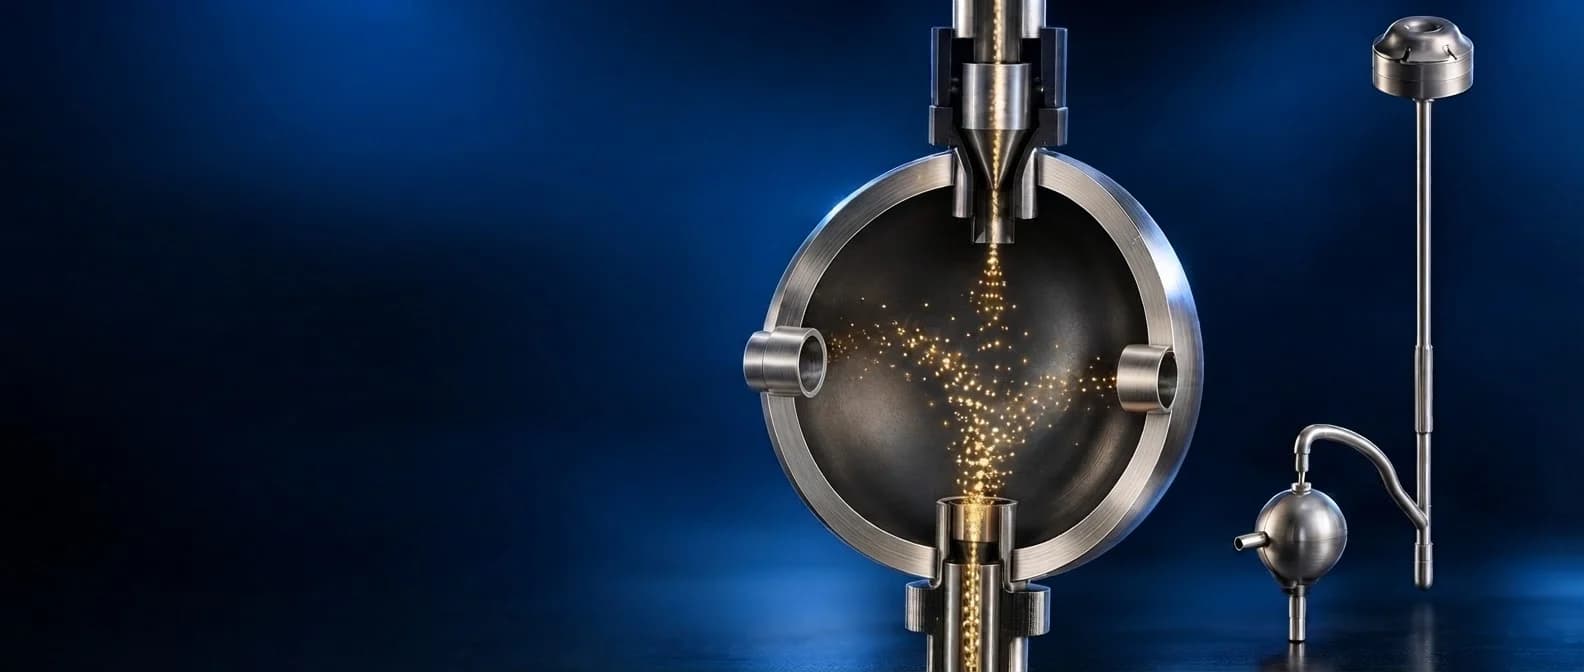
Air SamplerFollowing the particle path
Flow. Filtration. Particle Focusing
CFD + DPM
Air Sampler
- Requirement
Understand the complete flow path
Trace particles from the inlet cowl, through the filter and stem, into the nozzle and chamber. Determine how particle size and flow rate affect the focused region
- Challenge
Resolve the small features that matter
A narrow nozzle, repeated flow turns and filter assumptions all influence the result. A single airflow contour cannot explain how every particle size behaves
- Deliverables
Turn complex results into design insight
Develop the fluid-domain model, mesh and DPM setup; compare geometry iterations; report pressure, velocity, particle tracks and beam widths at defined planes
- Iterative geometry investigation
- 4 models
- Specified injection per final case
- 50,000 particles
- Final flow-rate comparison
- 2 / 3 / 4 LPM
DEVELOPMENT PROGRAMME
From a flow passage to a particle story

Step 01: Define
Extract the internal flow path and identify the restrictive features

Step 02: Prepare
Mesh the small passages and represent the inlet, outlet and filter

Step 03: Investigate
Separate pressure-loss effects from particle-cutoff assumptions

Step 04: Track
Follow six particle-size bands across three final flow rates

Step 05: Interpret
Compare focusing, dispersion and velocity at common locations
01 / GEOMETRY AND FLOW DOMAIN
Model the passage the particles actually travel
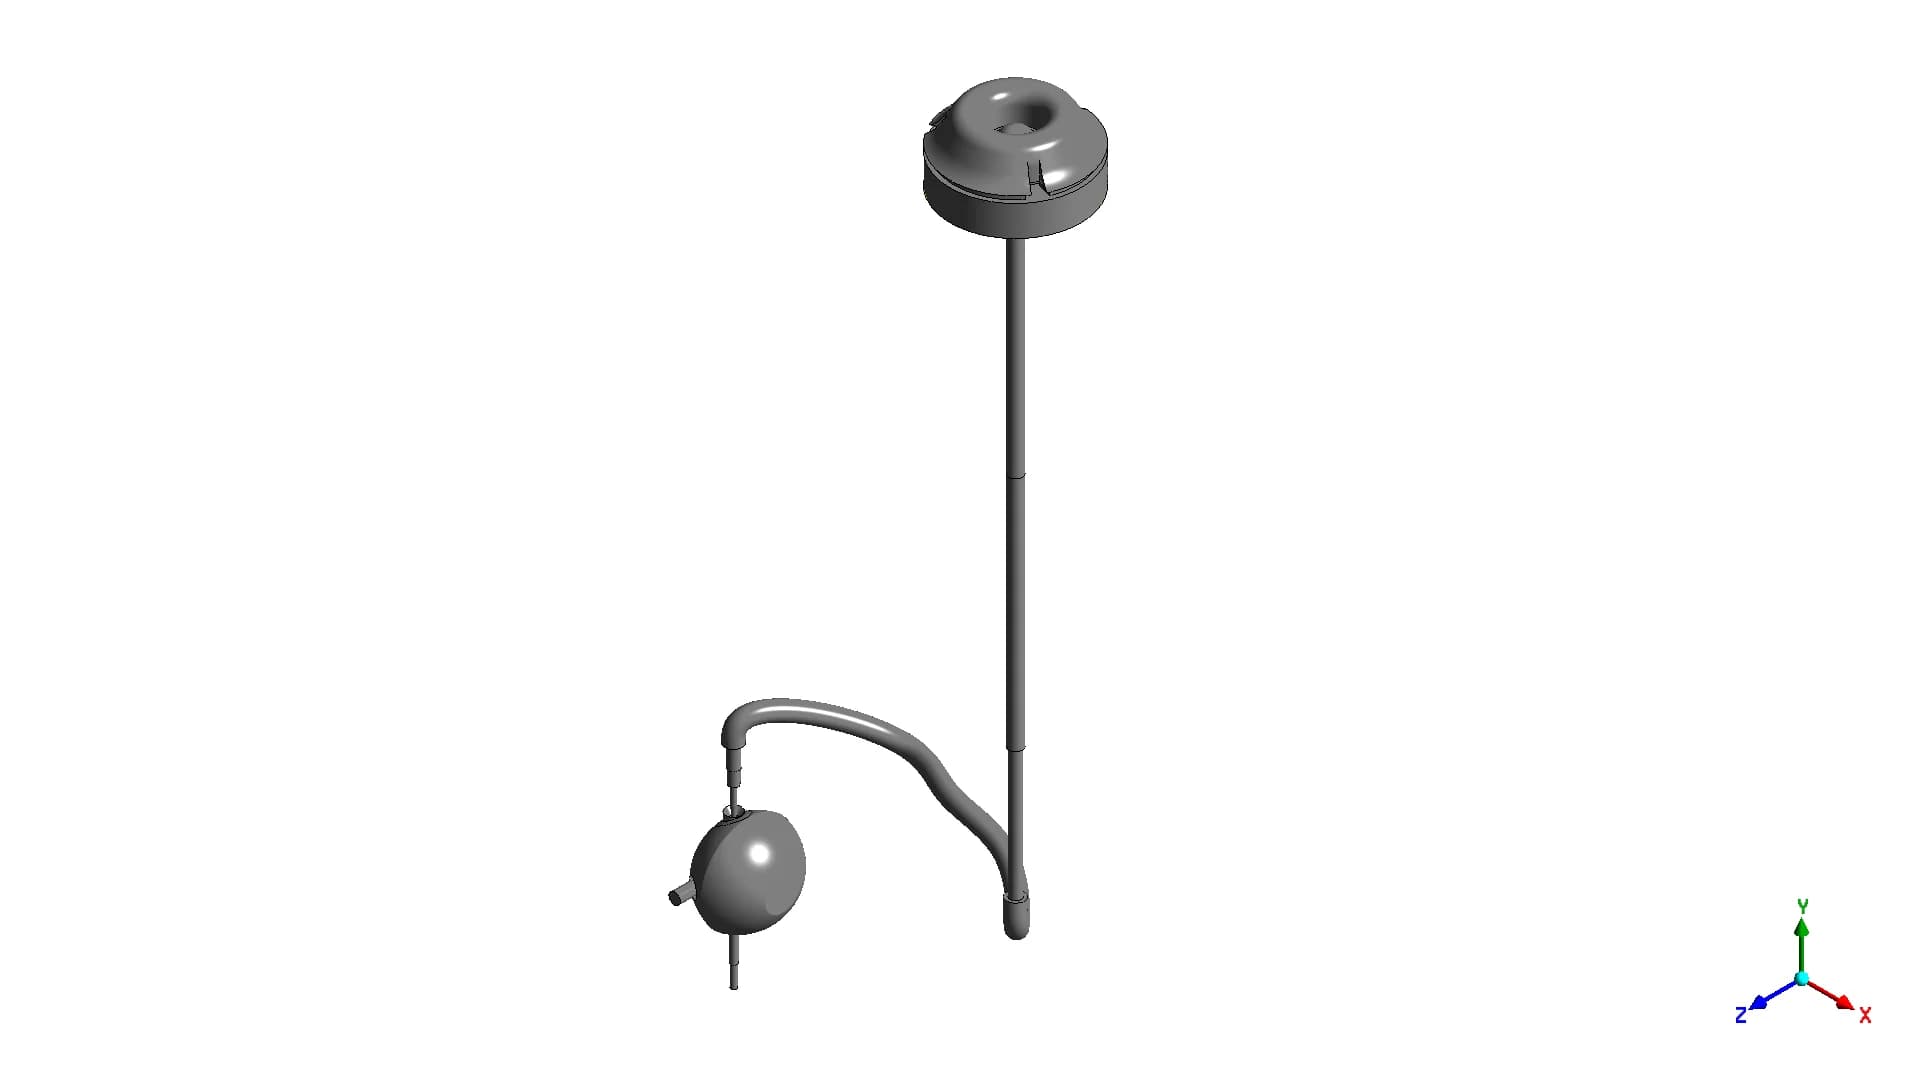
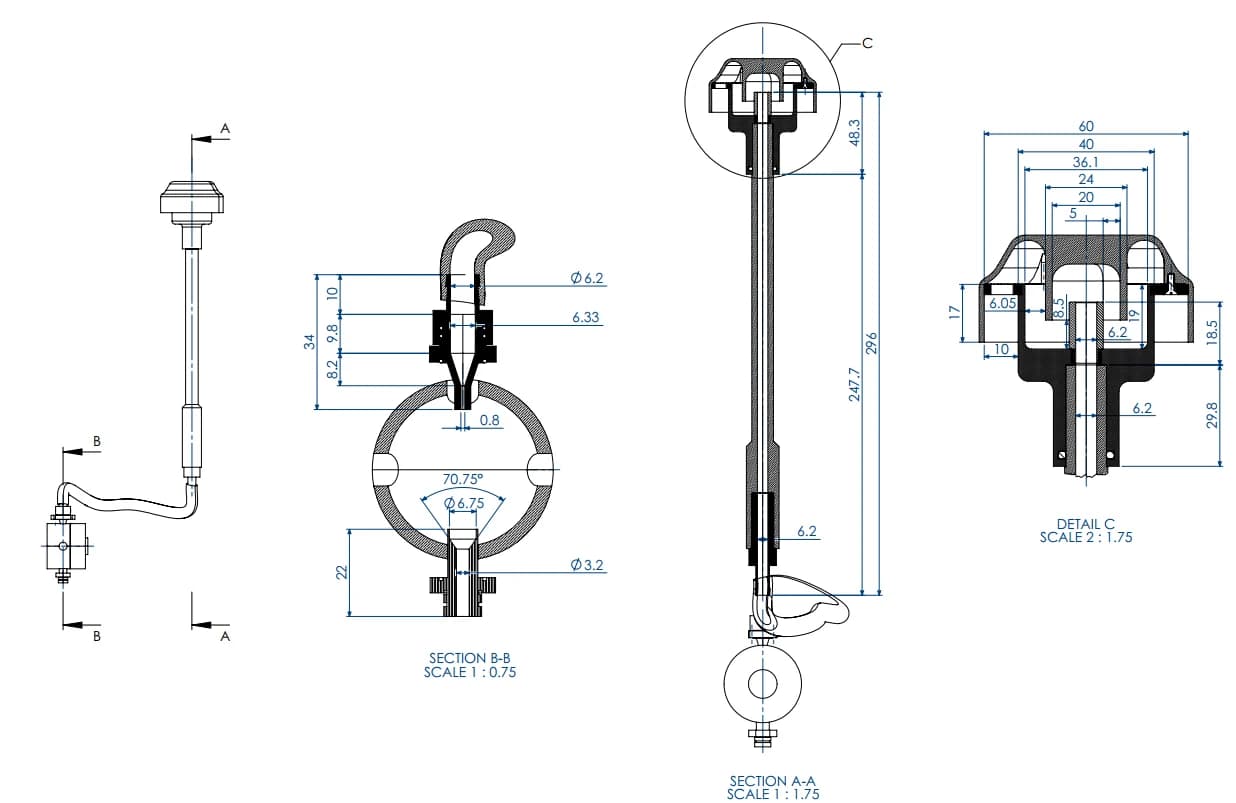
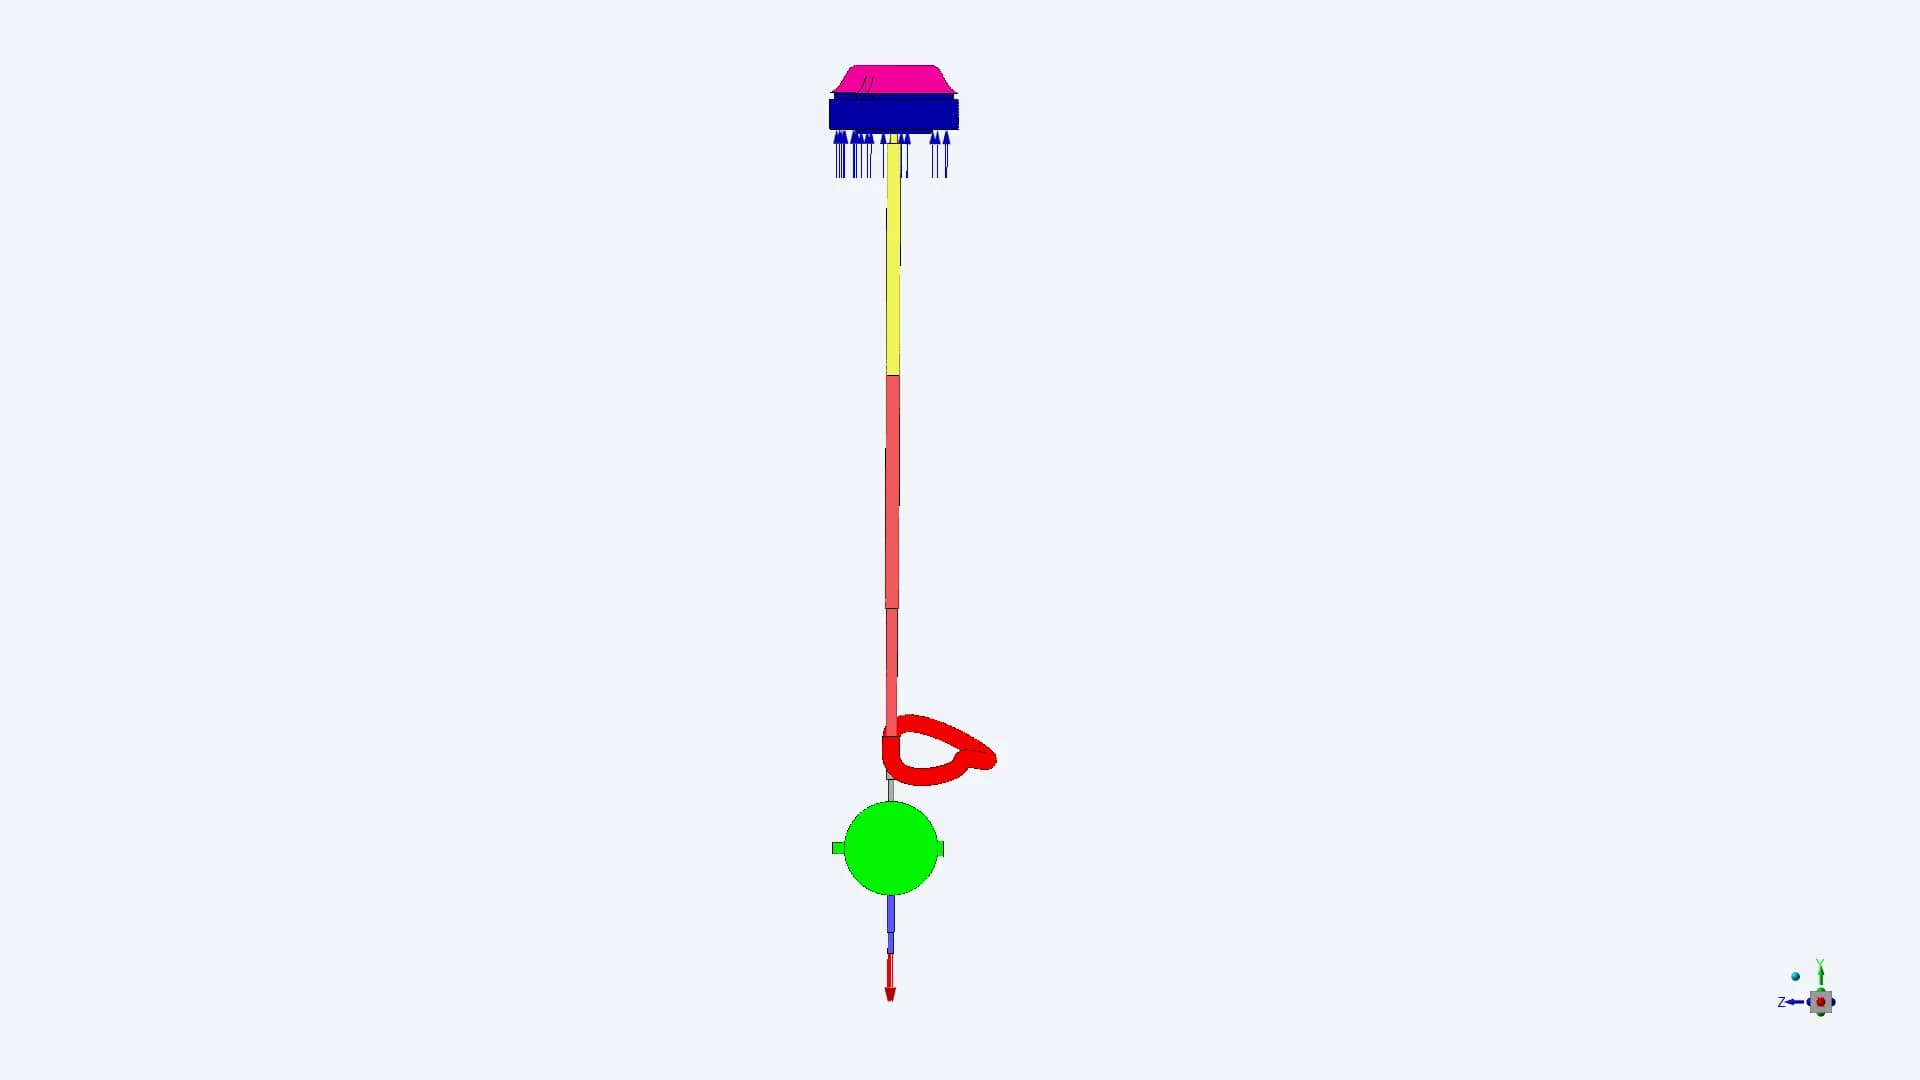
Cowl → filter → stem → curved connection → nozzle → chamber → outlet
The fluid domain follows the internal passage through the complete assembly. The final Model 04 uses a 0.8 mm nozzle feeding a spherical chamber. This makes the inlet and chamber part of one connected transport problem
02 / PRE-PROCESSING
Resolve the cowl, chamber and nozzle
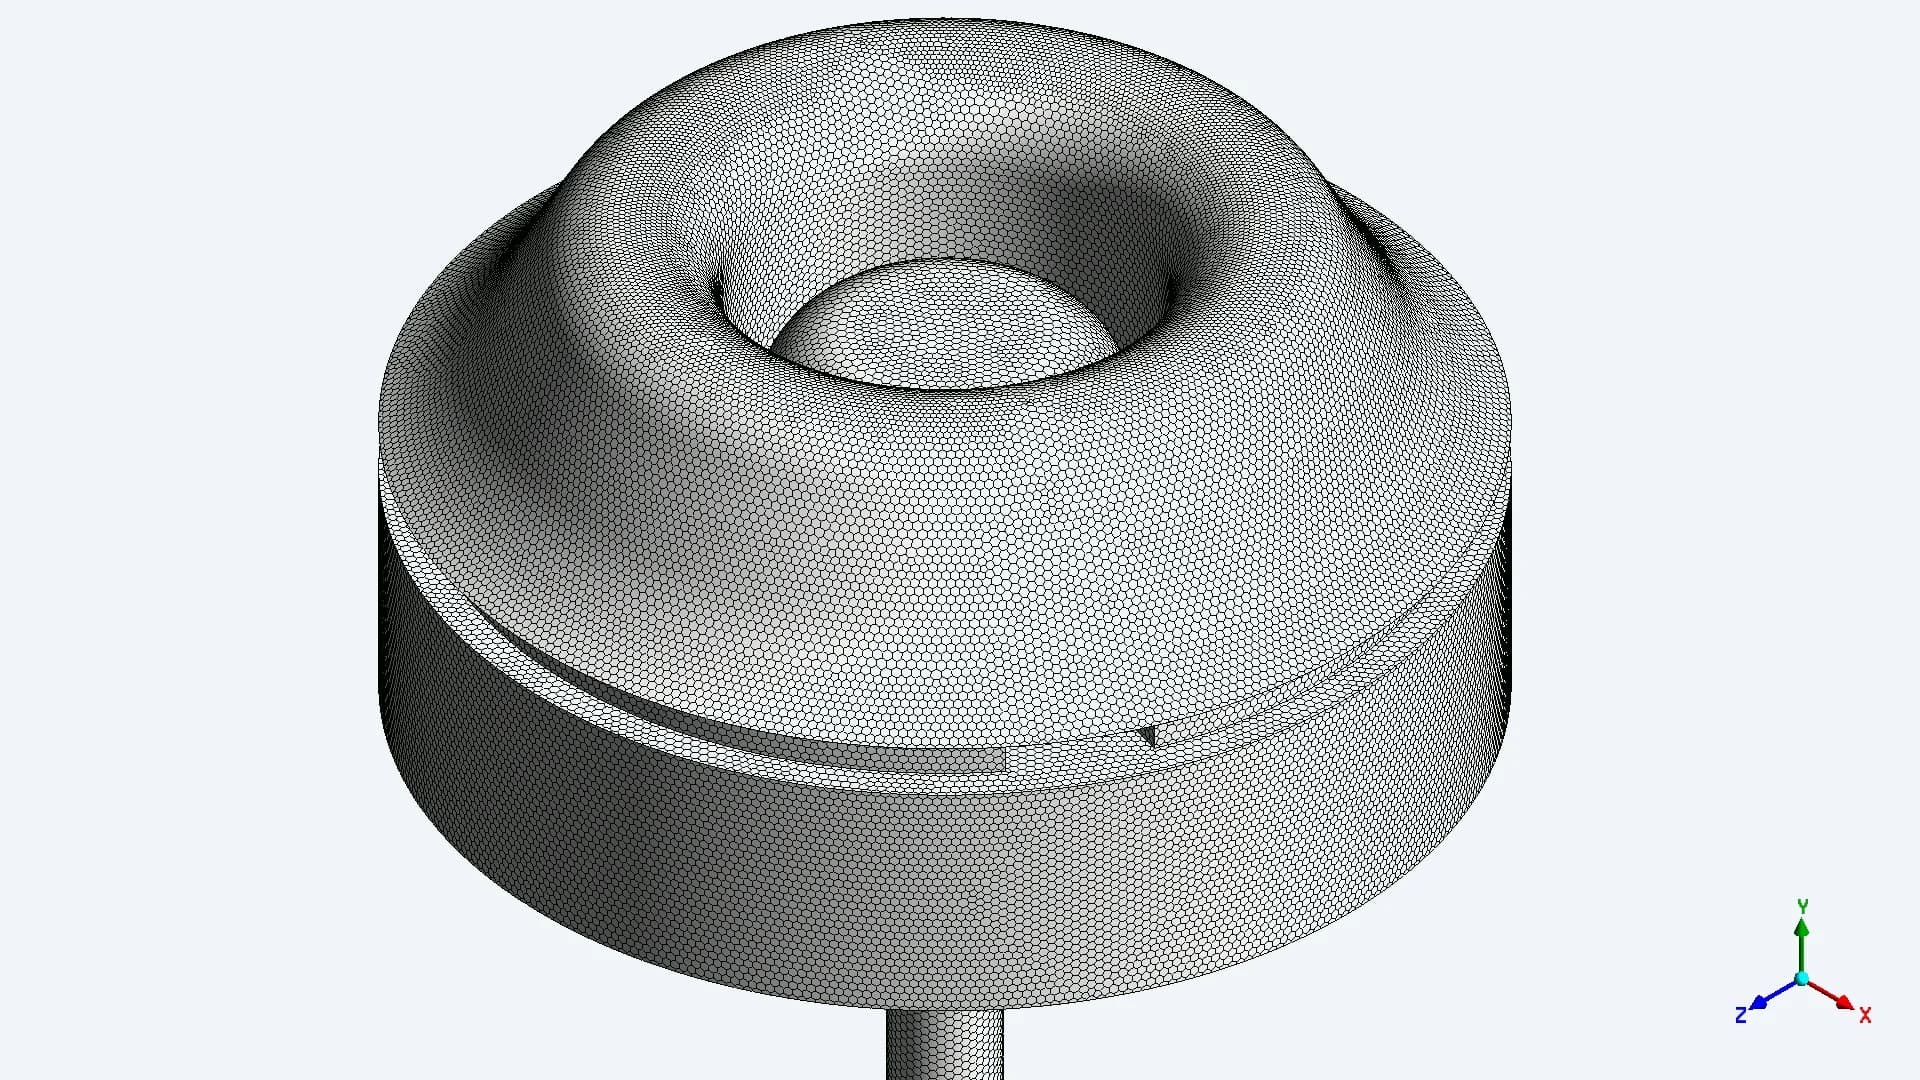
Inlet cowl and filter region
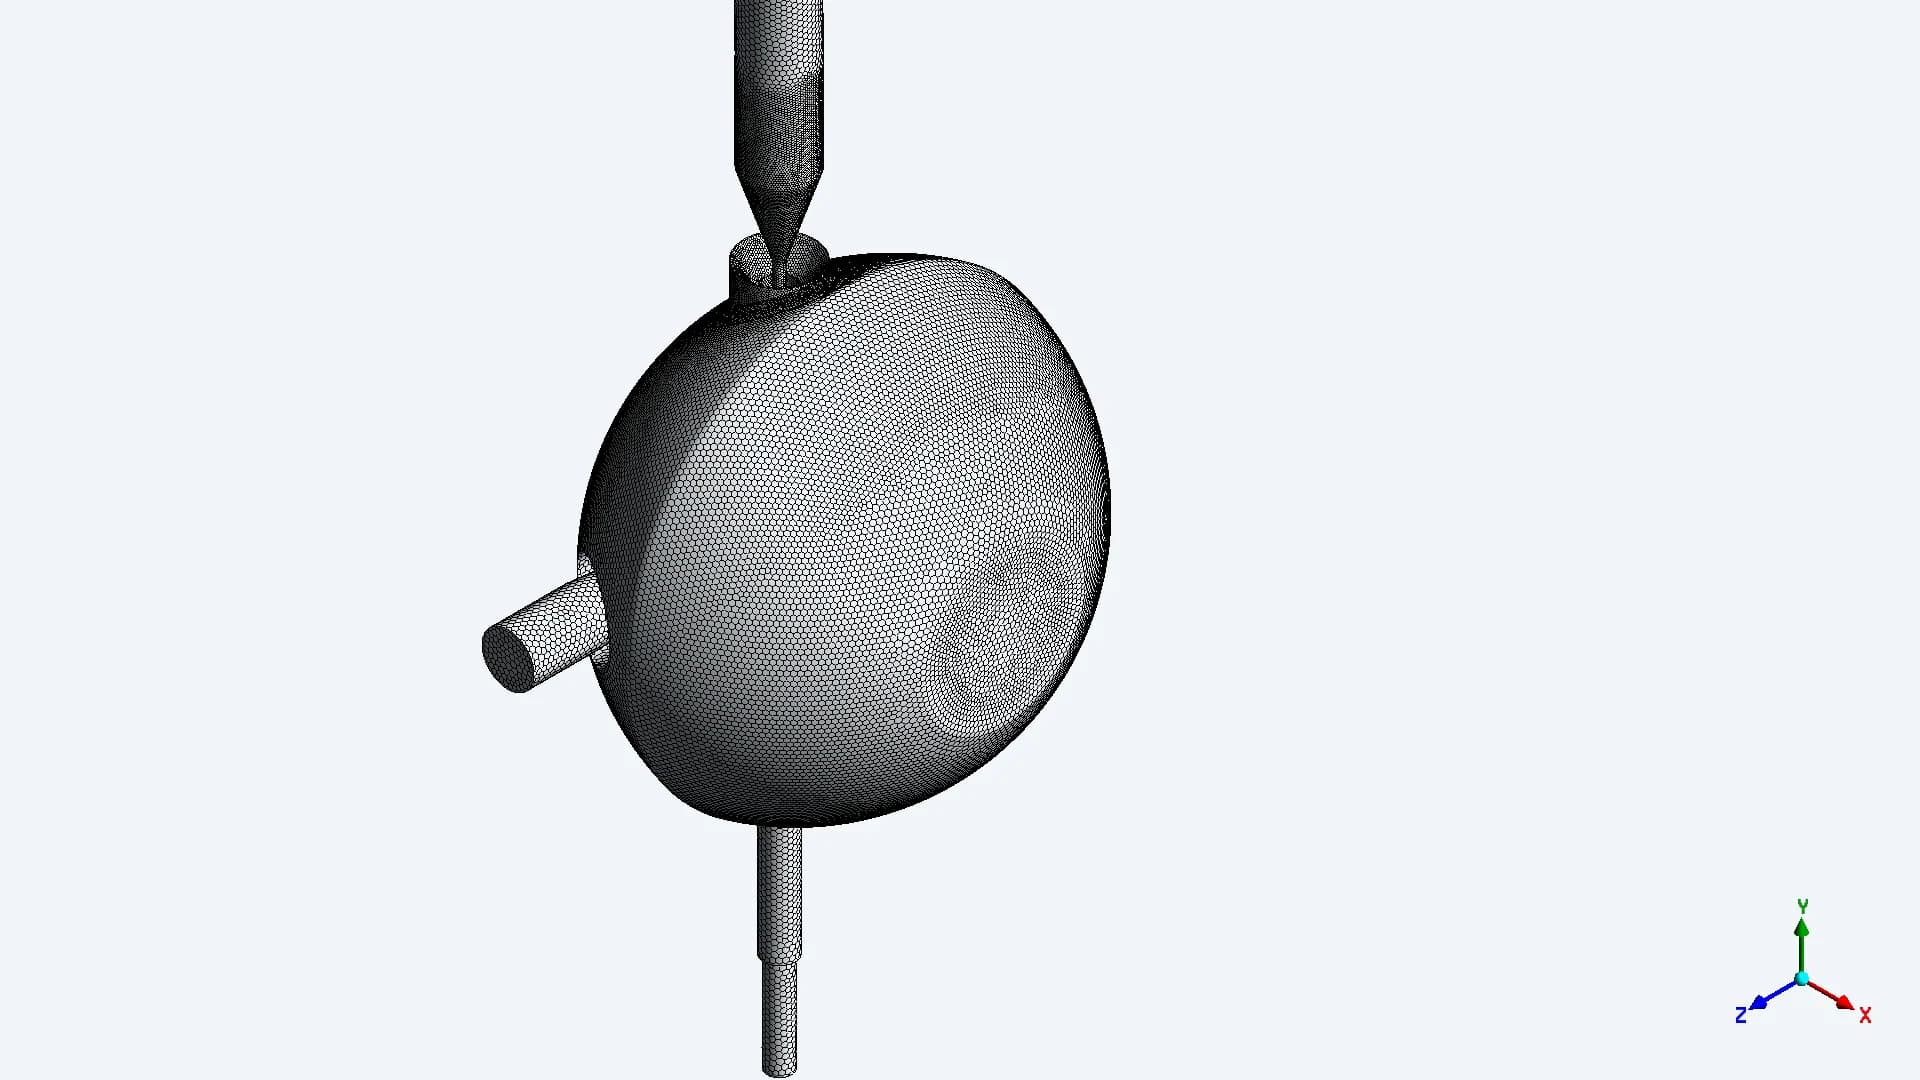
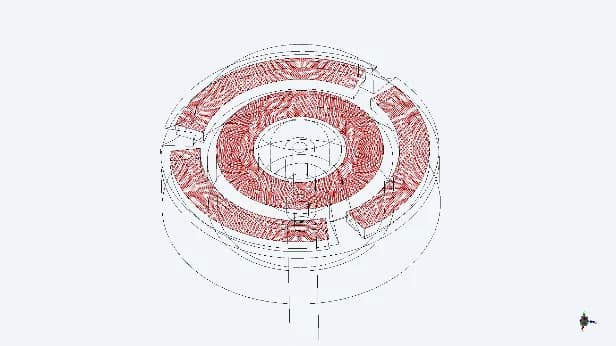
Curved connection and chamber
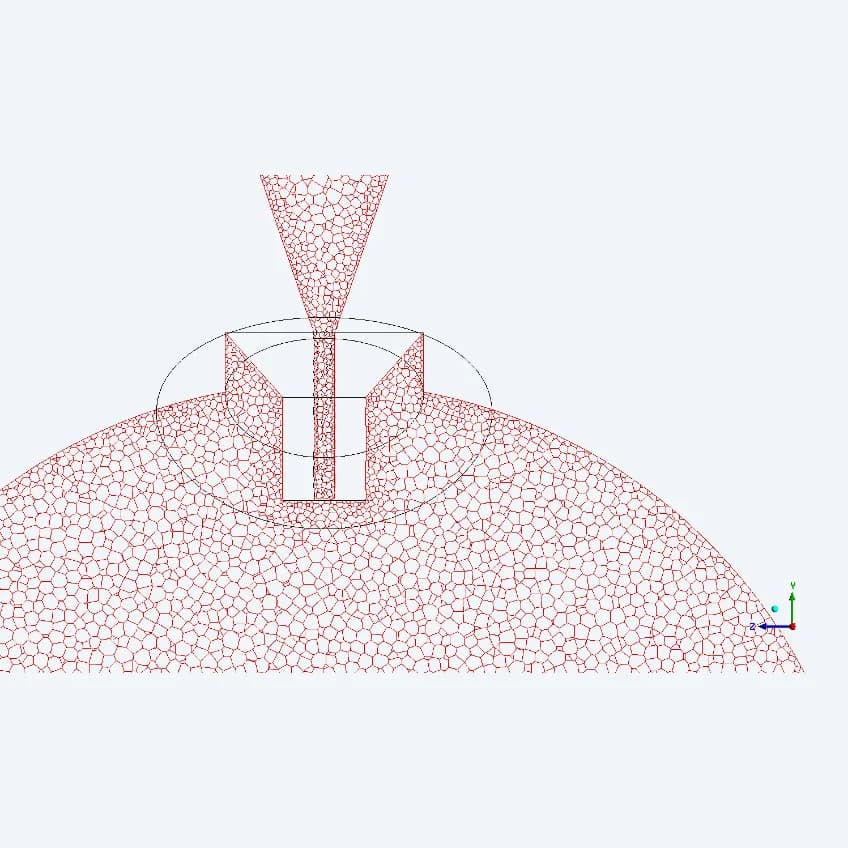
Nozzle section and local cells
The initial preparation report records a polyhedral mesh of approximately 13 million cells, surface sizing of 0.2–0.1 mm, and mesh/model sensitivity checks. The figures above show the later Model 04 mesh; its final cell count is not specified
03 / FLOW SETUP
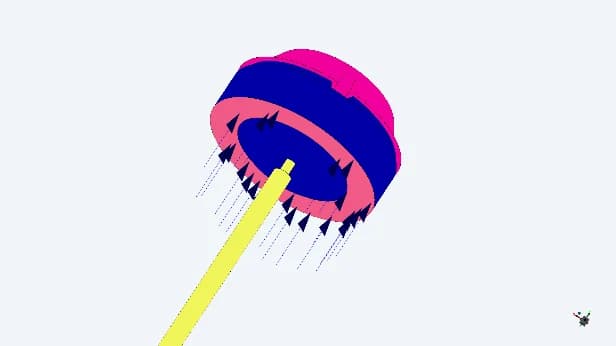
Define how air enters and leaves the system
| INPUT | REPORTED BASIS |
|---|---|
| Inlet | Open to atmosphere |
| Outlet cases | 2, 3 and 4 LPM |
| Flow solver | Pressure-based Navier–Stokes |
| Turbulence | k–ε model |
| Final filter | 15 µm particle cutoff |
| Filter pressure drop | Omitted in final Model 04 |
The final setup isolates particle transport with the stated cutoff assumption. Its results should be read with the omitted filter pressure drop in mind
04 / DISCRETE PARTICLE MODELLING
Give each particle-size band a defined role
The final cases inject 50,000 particles across six size bands, from 50 to 0.1 µm. The model removes the coarse band at the filter and tracks the smaller bands through the downstream passage
| PARTICLE DIAMETER | INJECTION SHARE | SPECIFIED COUNT | FILTER TREATMENT |
|---|---|---|---|
| 50–15 µm | 40% | 20,000 | Filtered |
| 15–10 µm | 10% | 5000 | Allowed downstream |
| 10–5 µm | 10% | 5000 | Allowed downstream |
| 5–1 µm | 10% | 5000 | Allowed downstream |
| 1–0.5 µm | 10% | 5000 | Allowed downstream |
| 0.5–0.1 µm | 20% | 5000 | Allowed downstream |
05 / THE FIRST DESIGN QUESTIONS
Separate inlet losses from nozzle behaviour
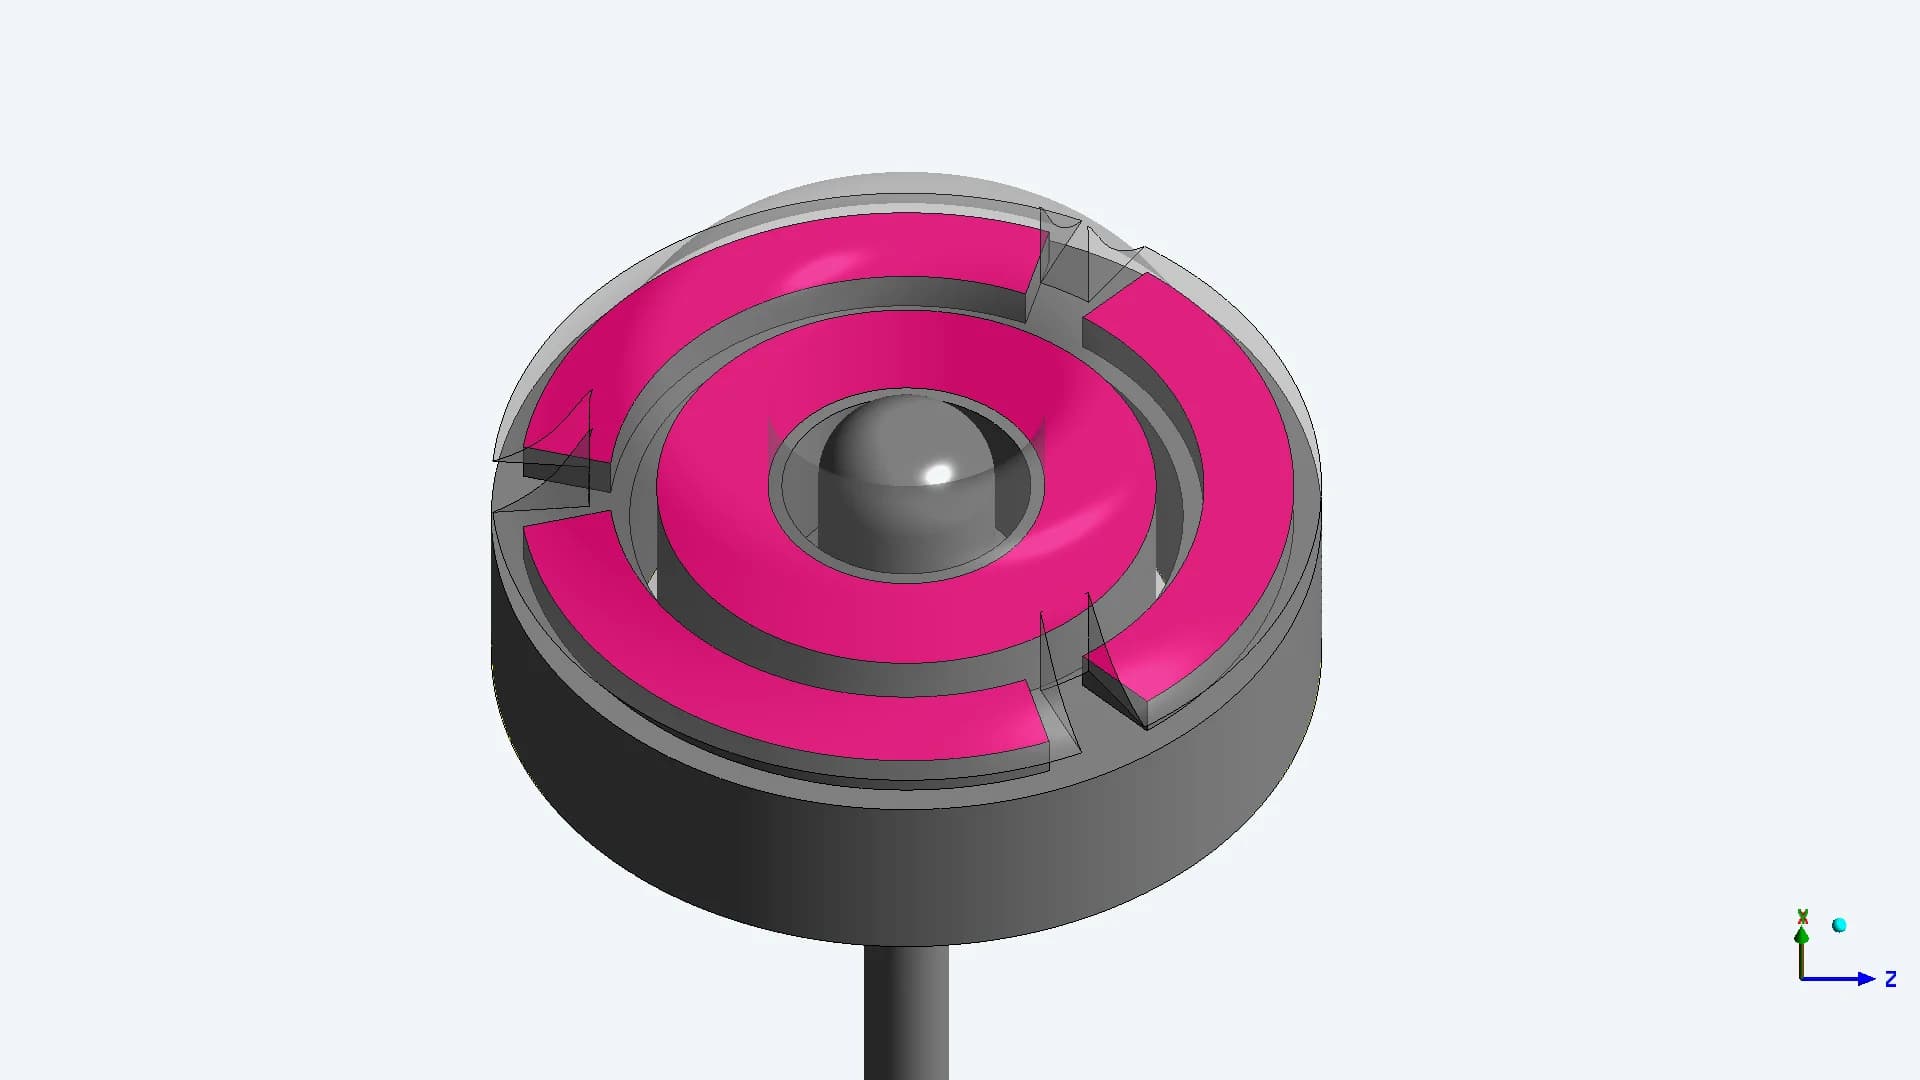
The inlet needed attention
The initial review identified restricted cowl entry, abrupt diameter changes, several bends and repeated filter traversal. Recommendations focused on more entry clearance and a simpler, more uniform passage
The filter assumption was tested
Diagnostic cases compared filter pressure loss, particle cutoff without that loss, and a changed flow boundary. This helped distinguish inlet/filter resistance from the restriction at the nozzle
06 / ITERATIVE DEVELOPMENT
Four models, progressively sharper questions
| ITERATION | STUDY FOCUS | WHAT THE WORK ESTABLISHED |
|---|---|---|
| Model 01 | Inlet, filter and 0.8 mm nozzle | Identified restrictive features; separated filter and flow assumptions |
| Model 02 | Revised cowl and 1.0 mm nozzle | Reported improved inlet behaviour; continued nozzle and 3/4 LPM studies |
| Model 03 | 1.0 mm nozzle; 15 µm cutoff | Compared particle focusing at 3 and 4 LPM across defined planes |
| Model 04 | 0.8 mm nozzle; 15 µm cutoff | Extended the final comparison to 2, 3 and 4 LPM with six size bands |
Each iteration answered a different question. Changes in geometry and case assumptions are kept visible, so a local improvement is not presented as a universal gain
07 / MEASUREMENT LOCATIONS
Compare the same planes in every case
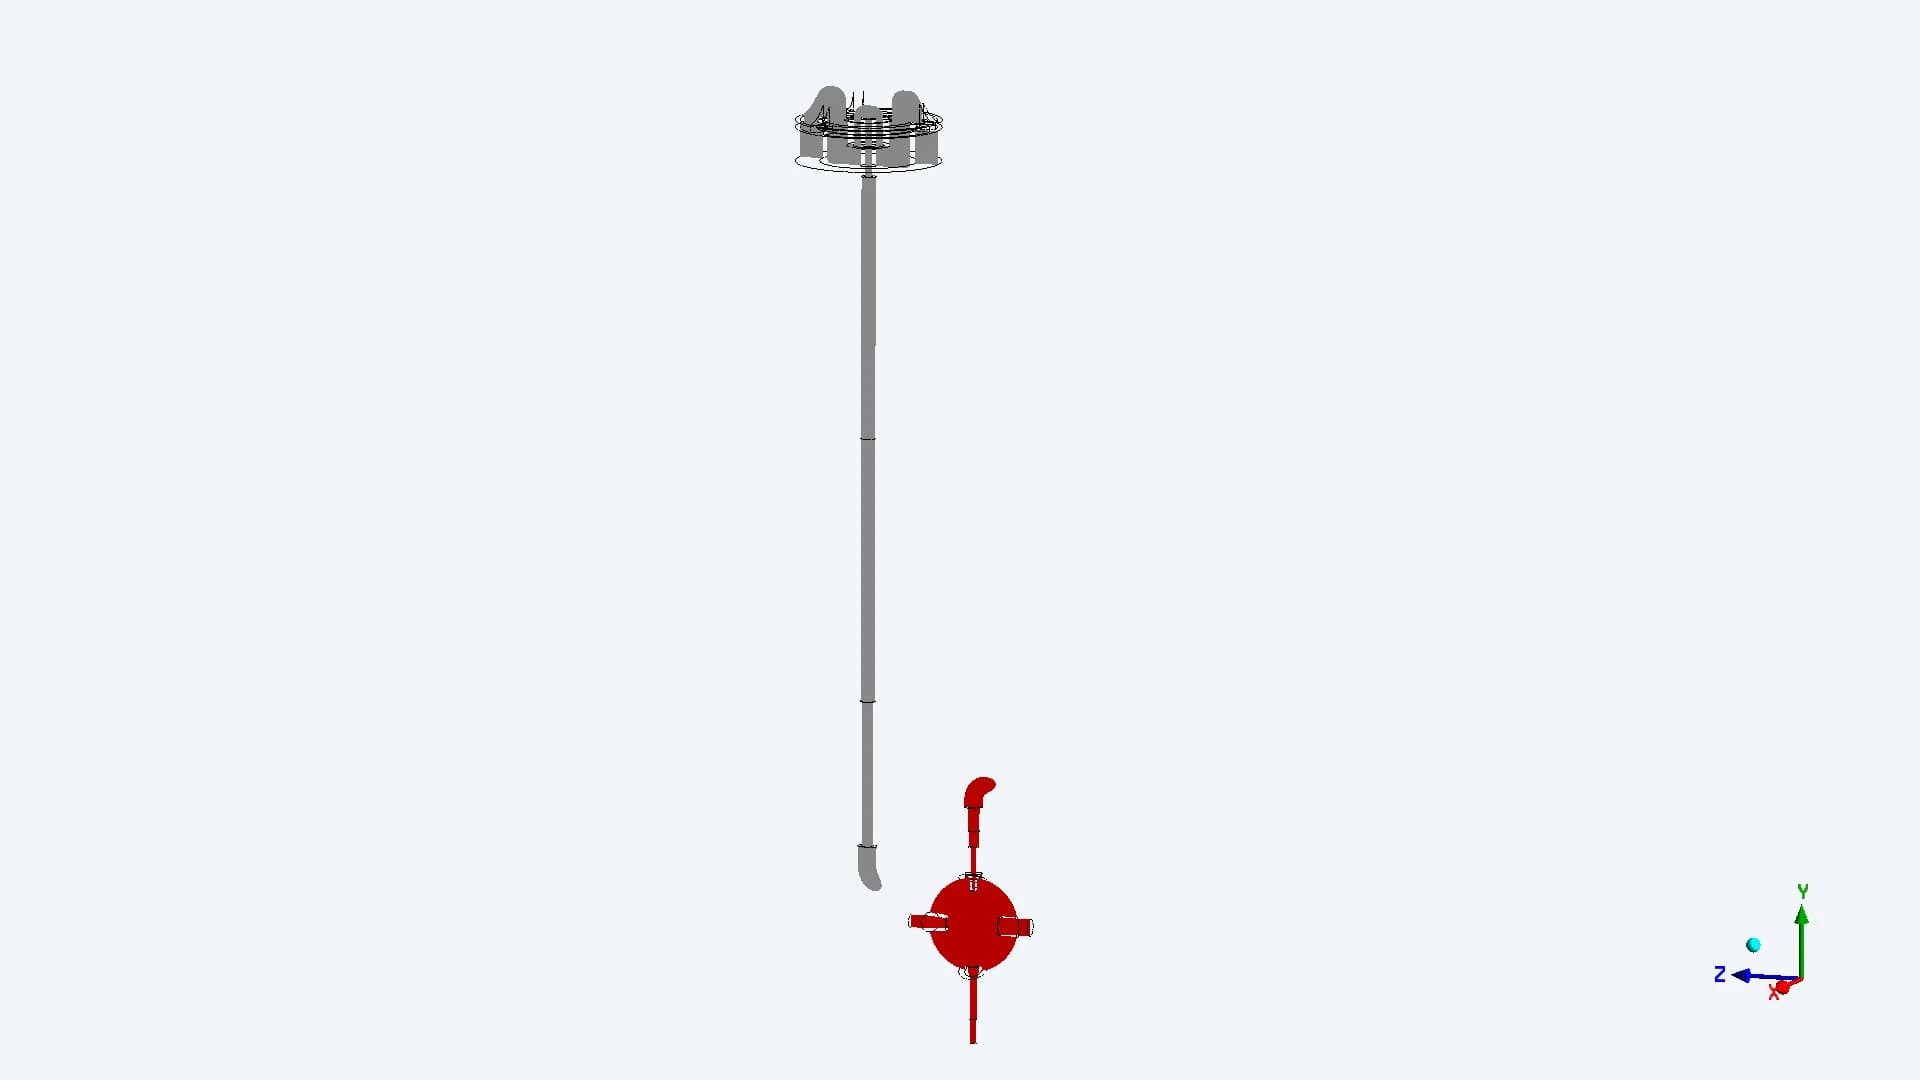
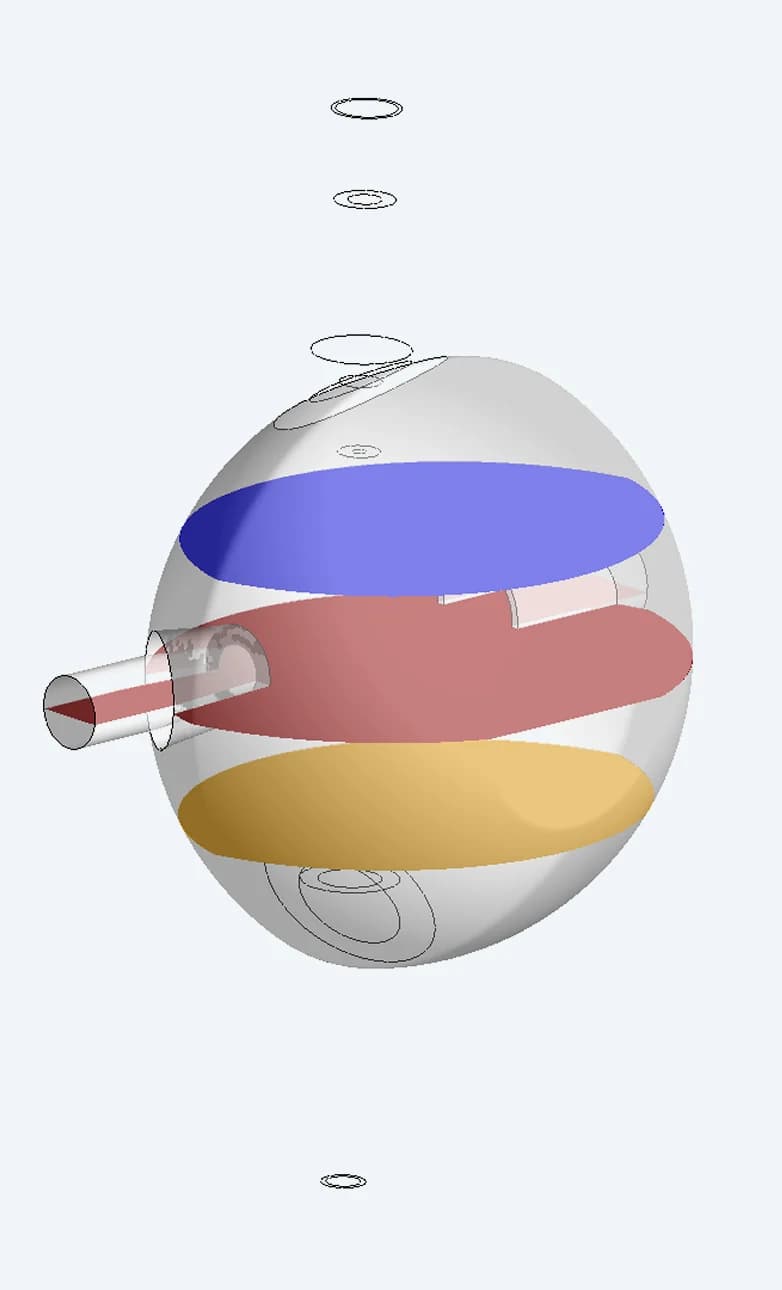
The report measures the focused region at the nozzle, three chamber planes and the exit. This reveals whether a narrow entry beam stays narrow, broadens or gives way to dispersed trajectories
Plane 01
Stem/cowl section
Plane 02
Chamber vertical section
Plane 03 / Plane 05
10 mm either side of centre
Plane 04
Chamber centre
08 / CROSS-SECTIONAL FLOW
See how the jet changes through the chamber
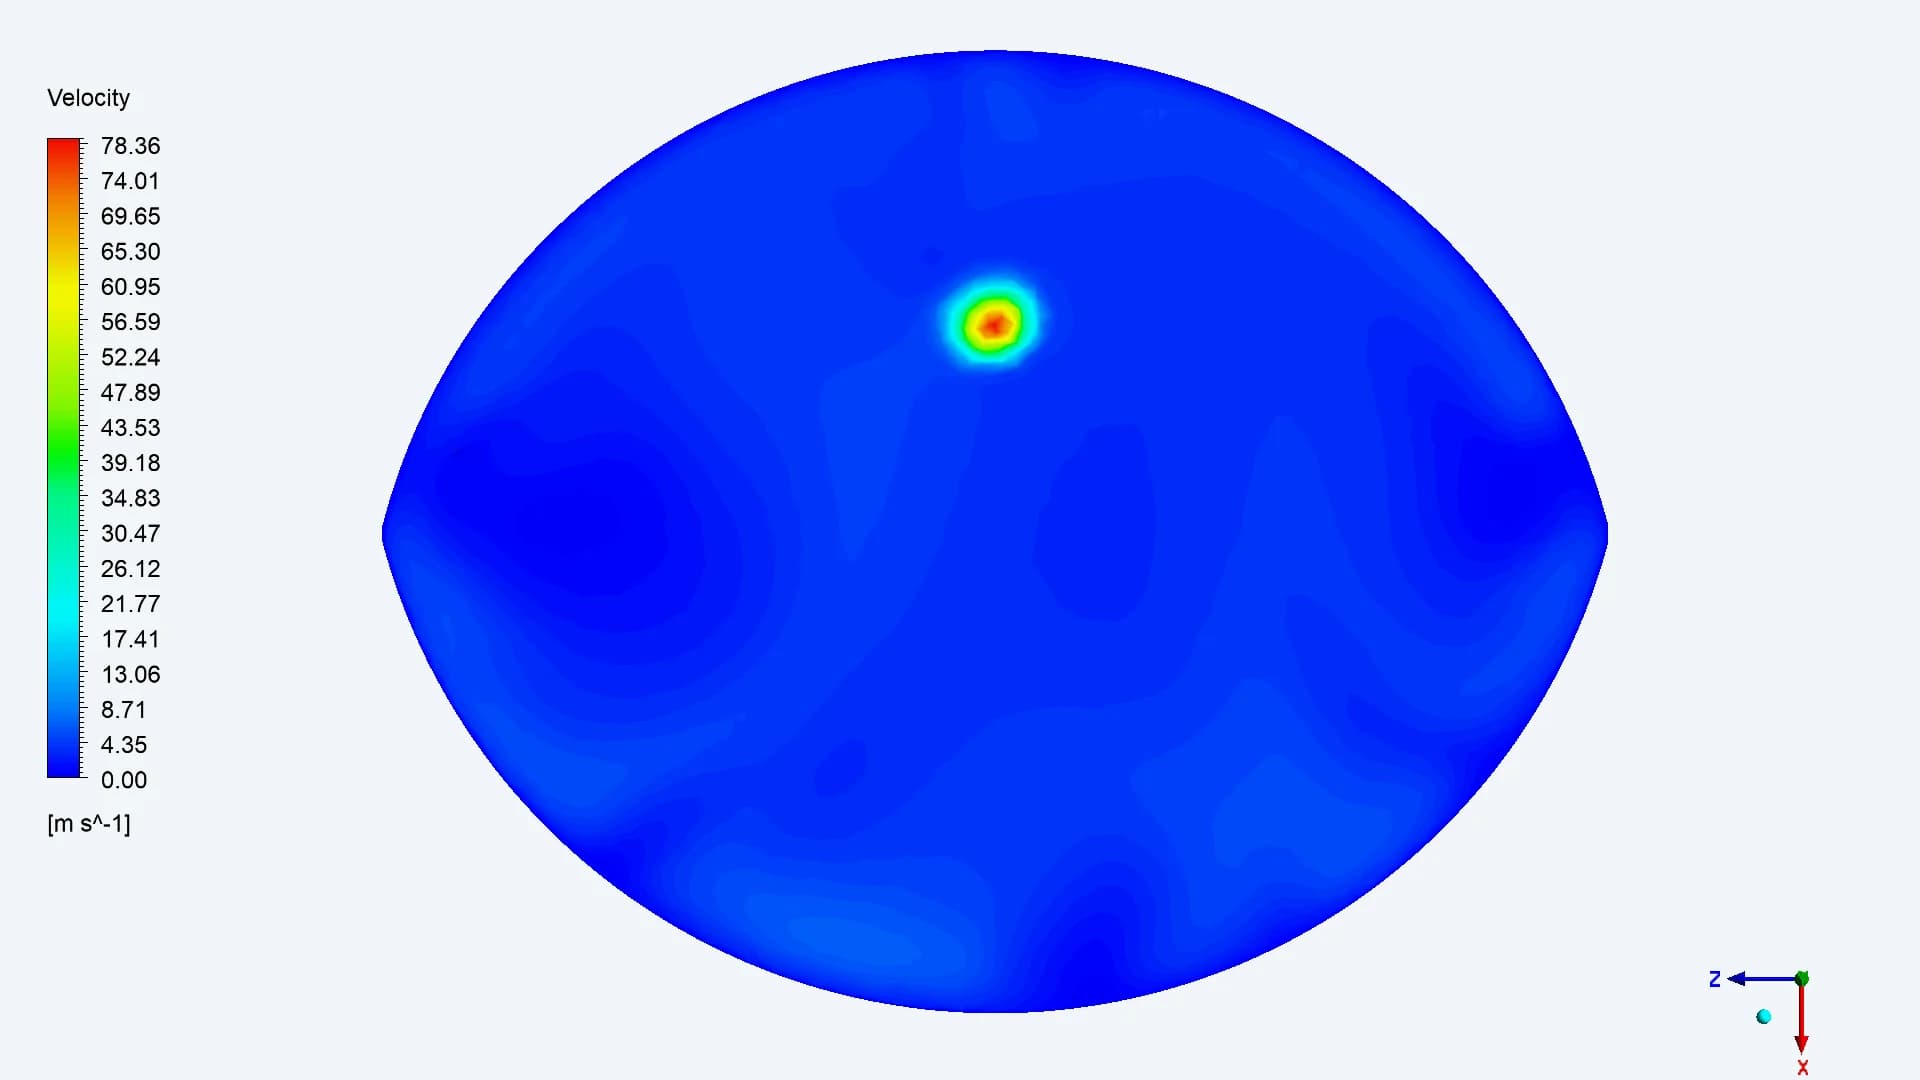
Plane 03 / Before centre
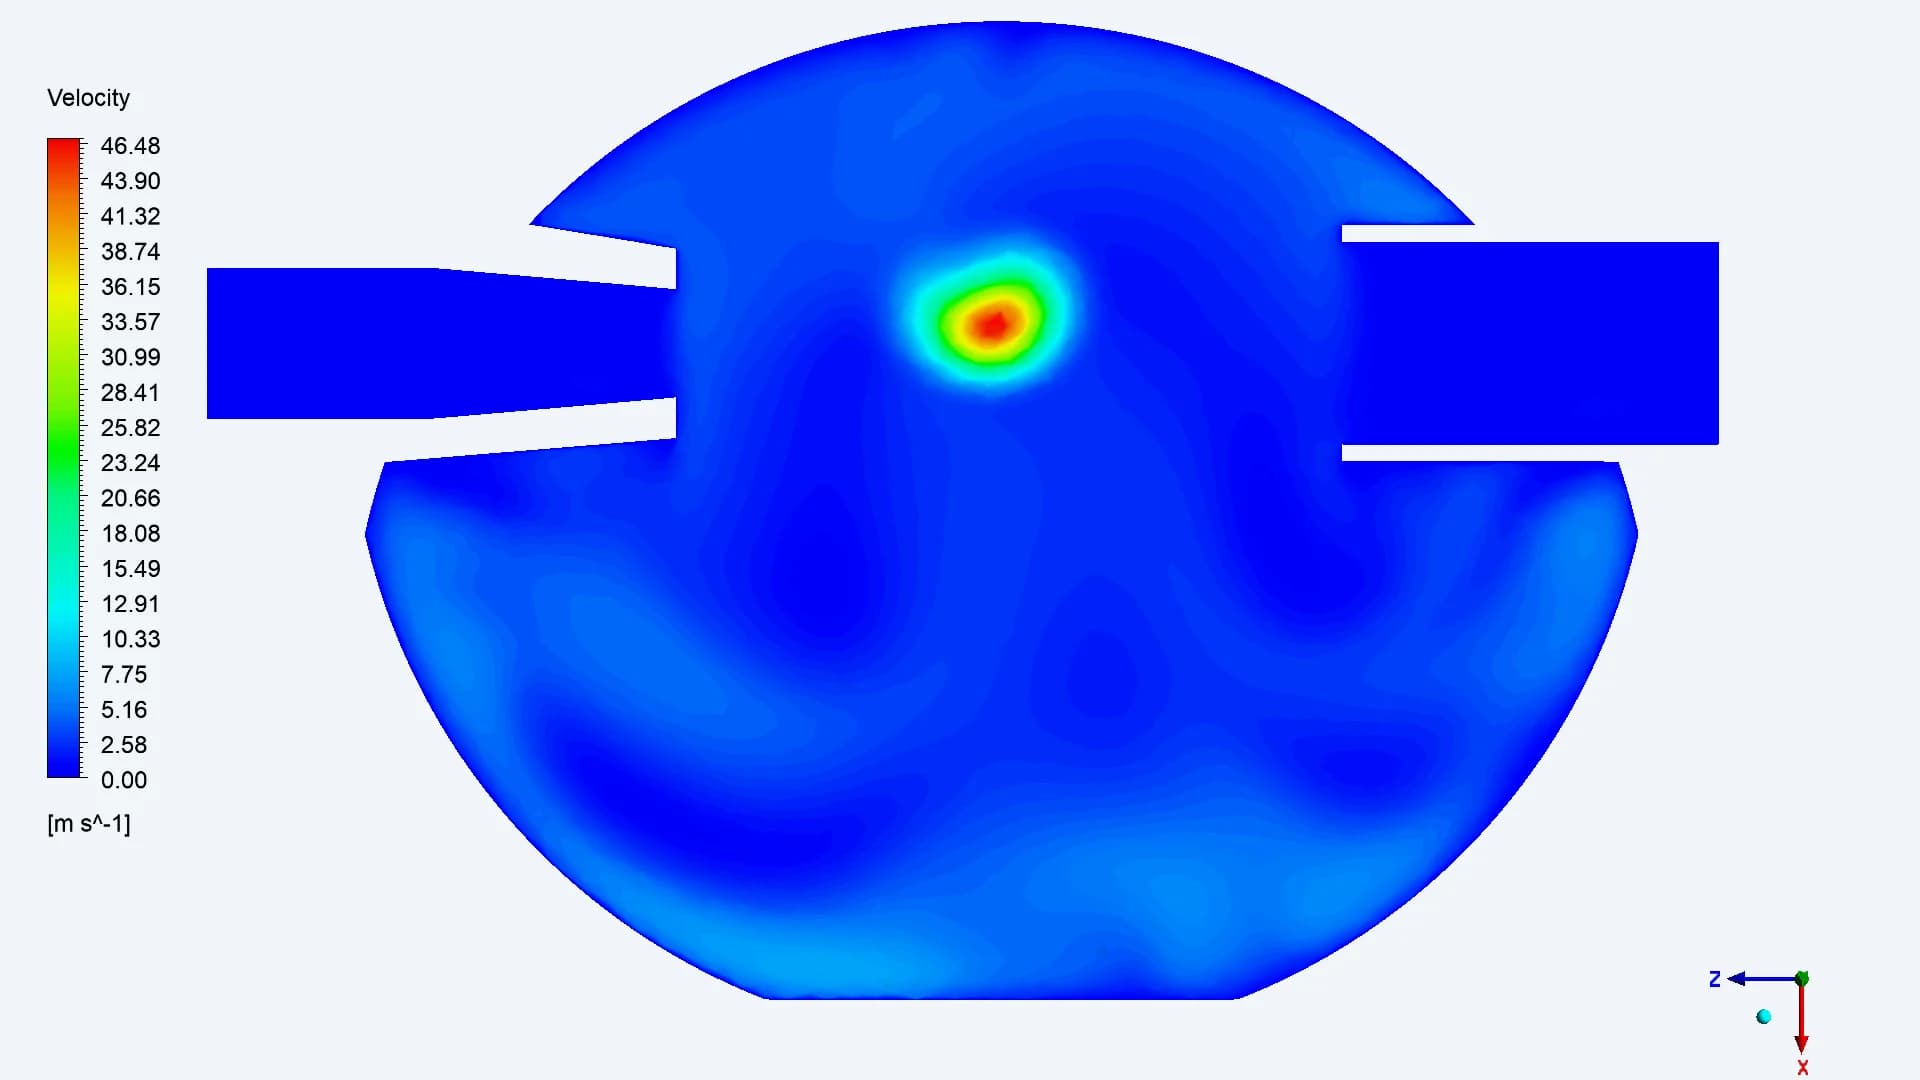
Plane 04 / Chamber centre
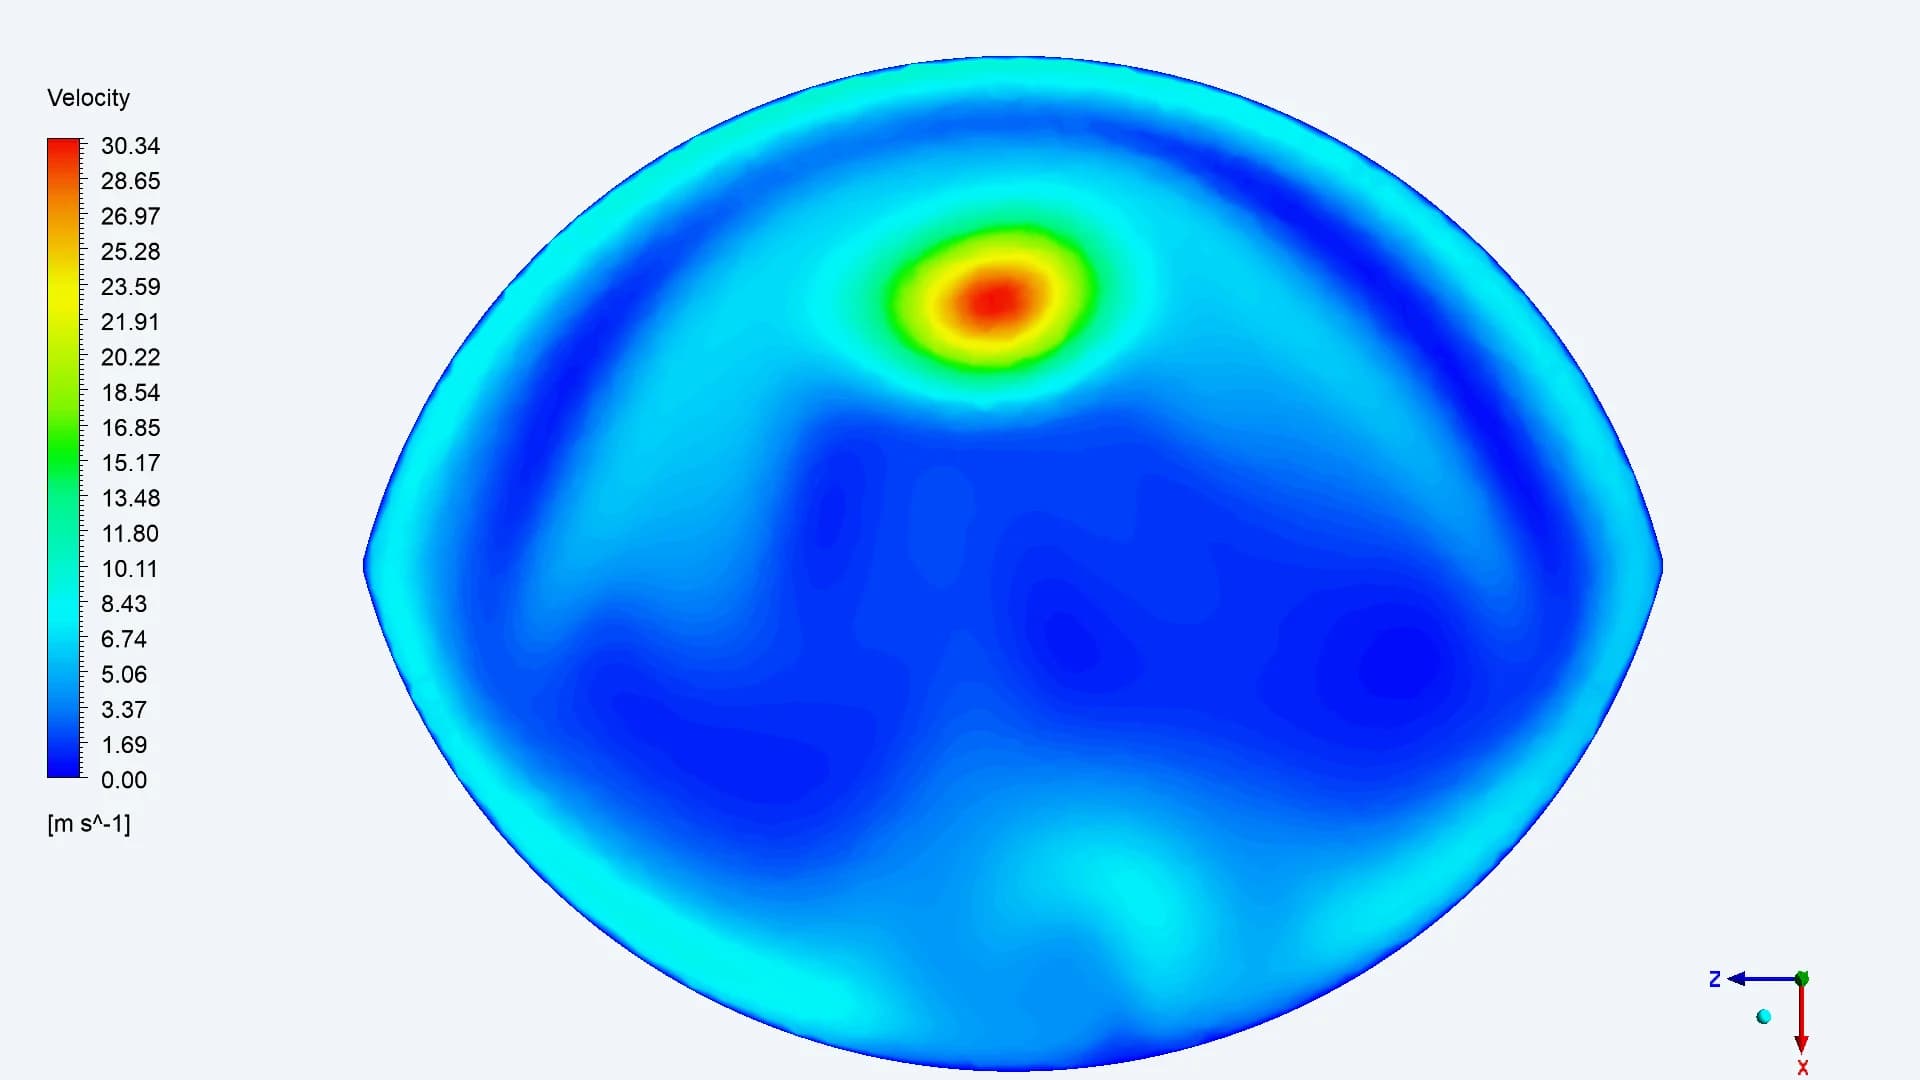
Plane 05 / After centre
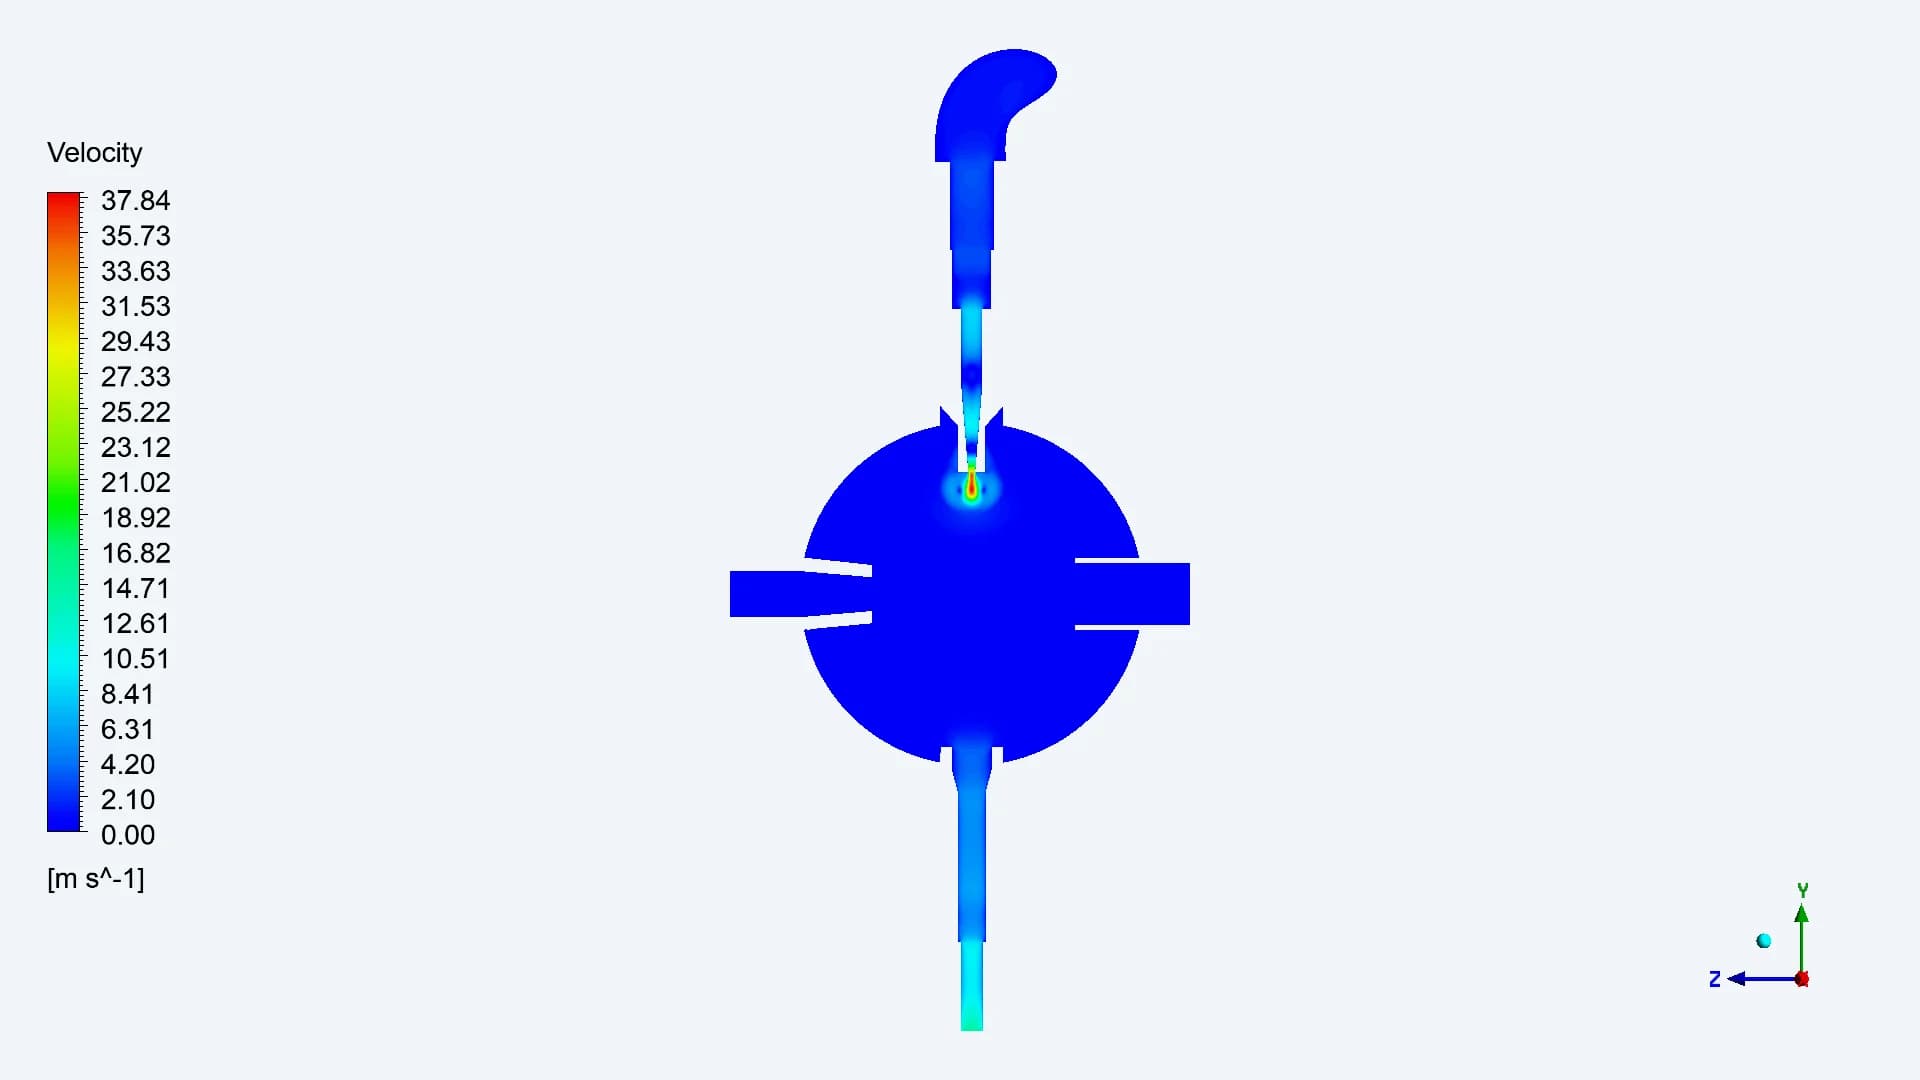
These cross-sections show air-velocity distributions at 4 LPM. A velocity footprint is a different quantity from the focused-particle beam width reported later
09 / CONTINUOUS-PHASE RESULTS
Read the airflow before interpreting the particles
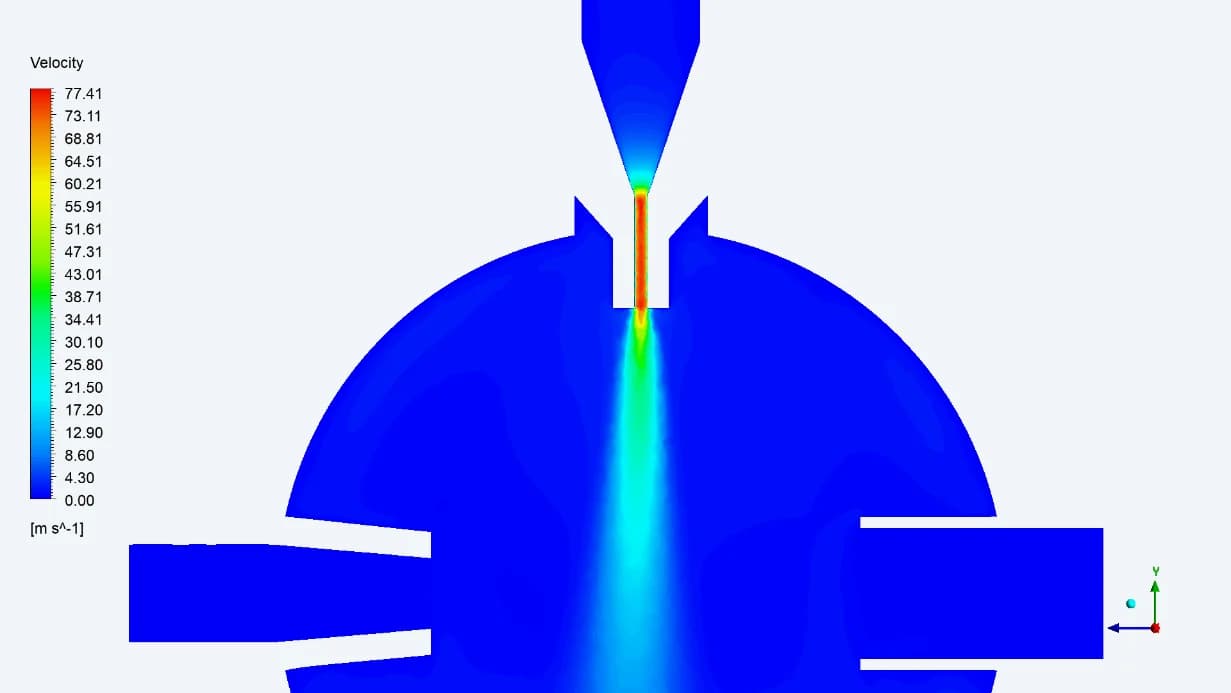
2 LPM
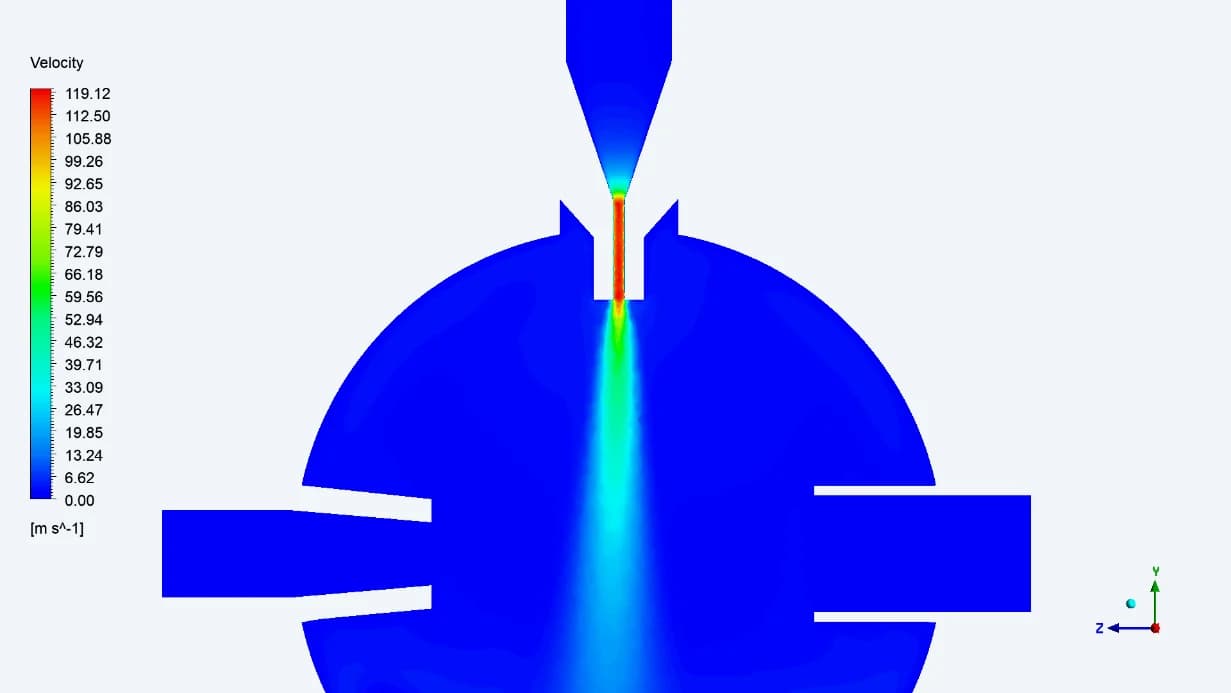
3 LPM
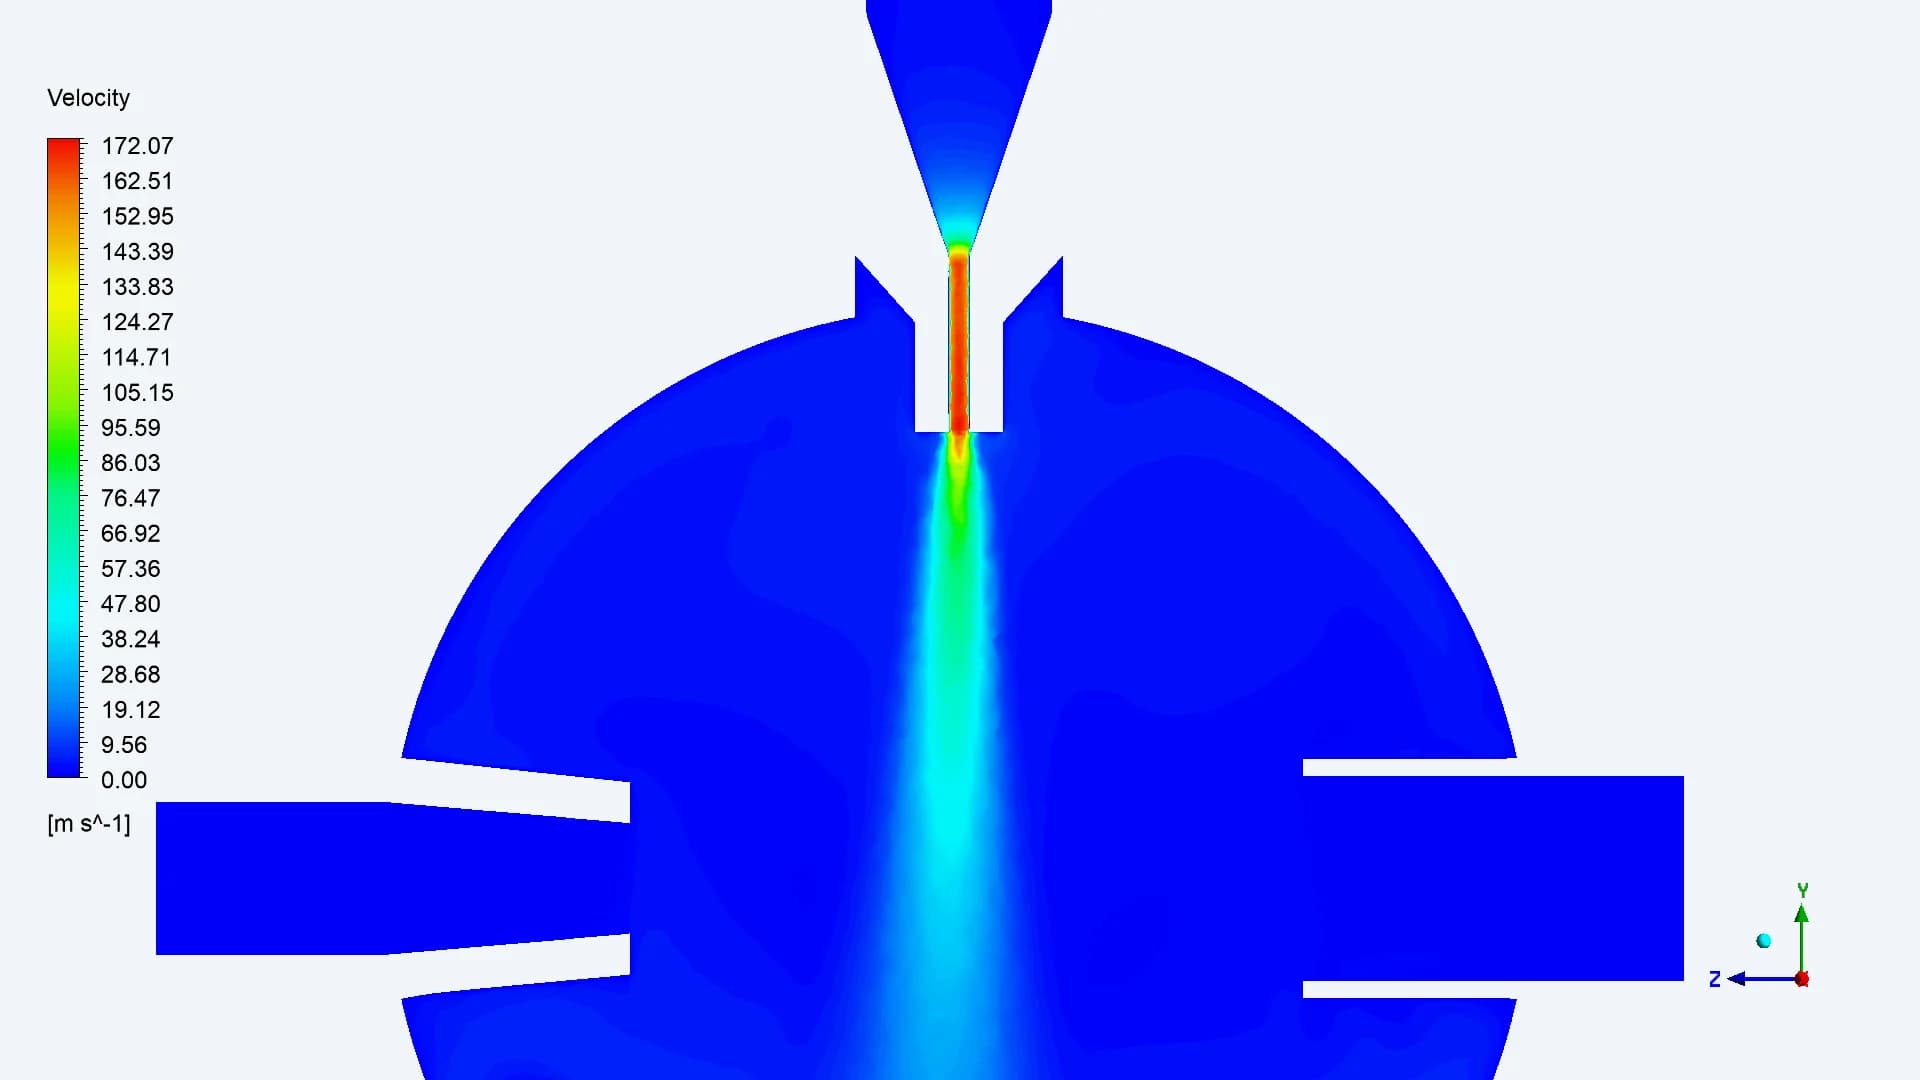
4 LPM
The velocity contours show the narrow jet entering the larger chamber and the lower-speed surrounding regions. Increasing flow changes the local velocity field that transports the particles. Read the numerical legends: colour scales differ between plots
10 / PRESSURE DISTRIBUTION
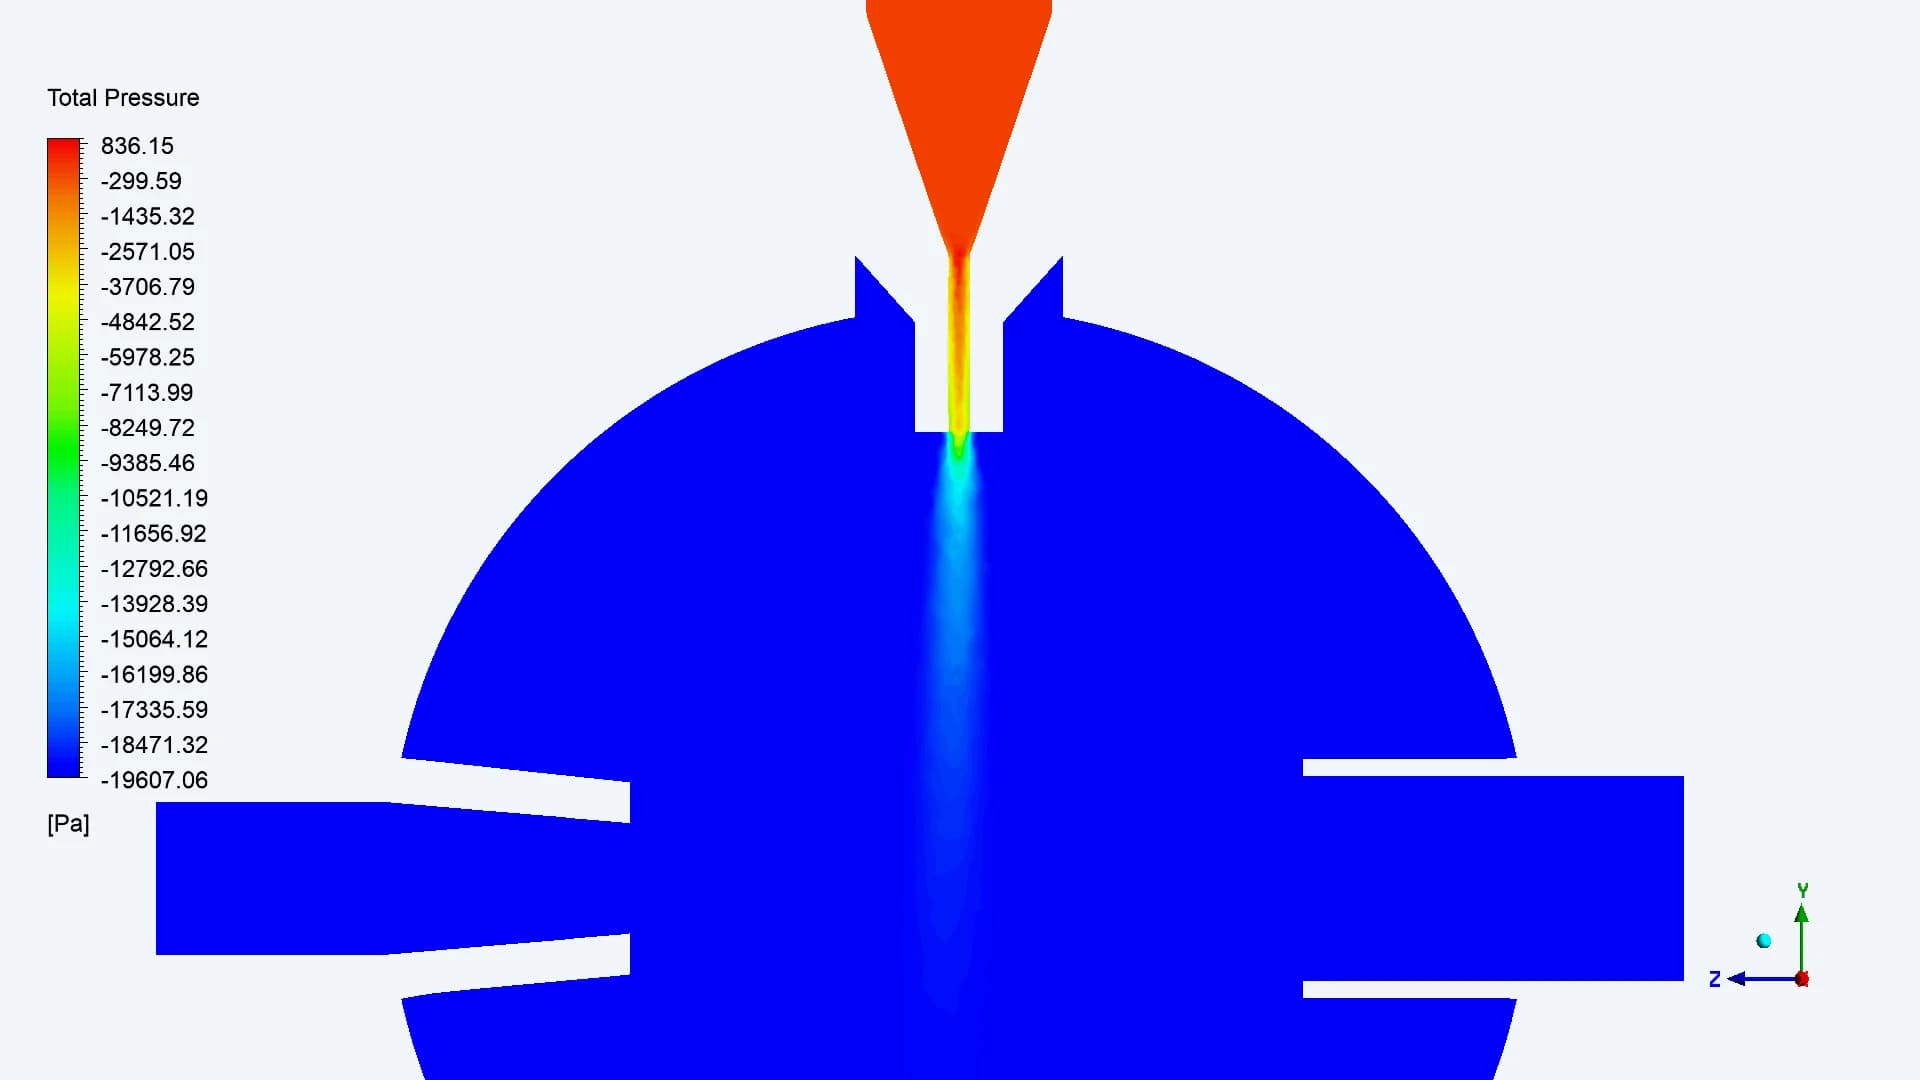
Connect upstream resistance to chamber conditions
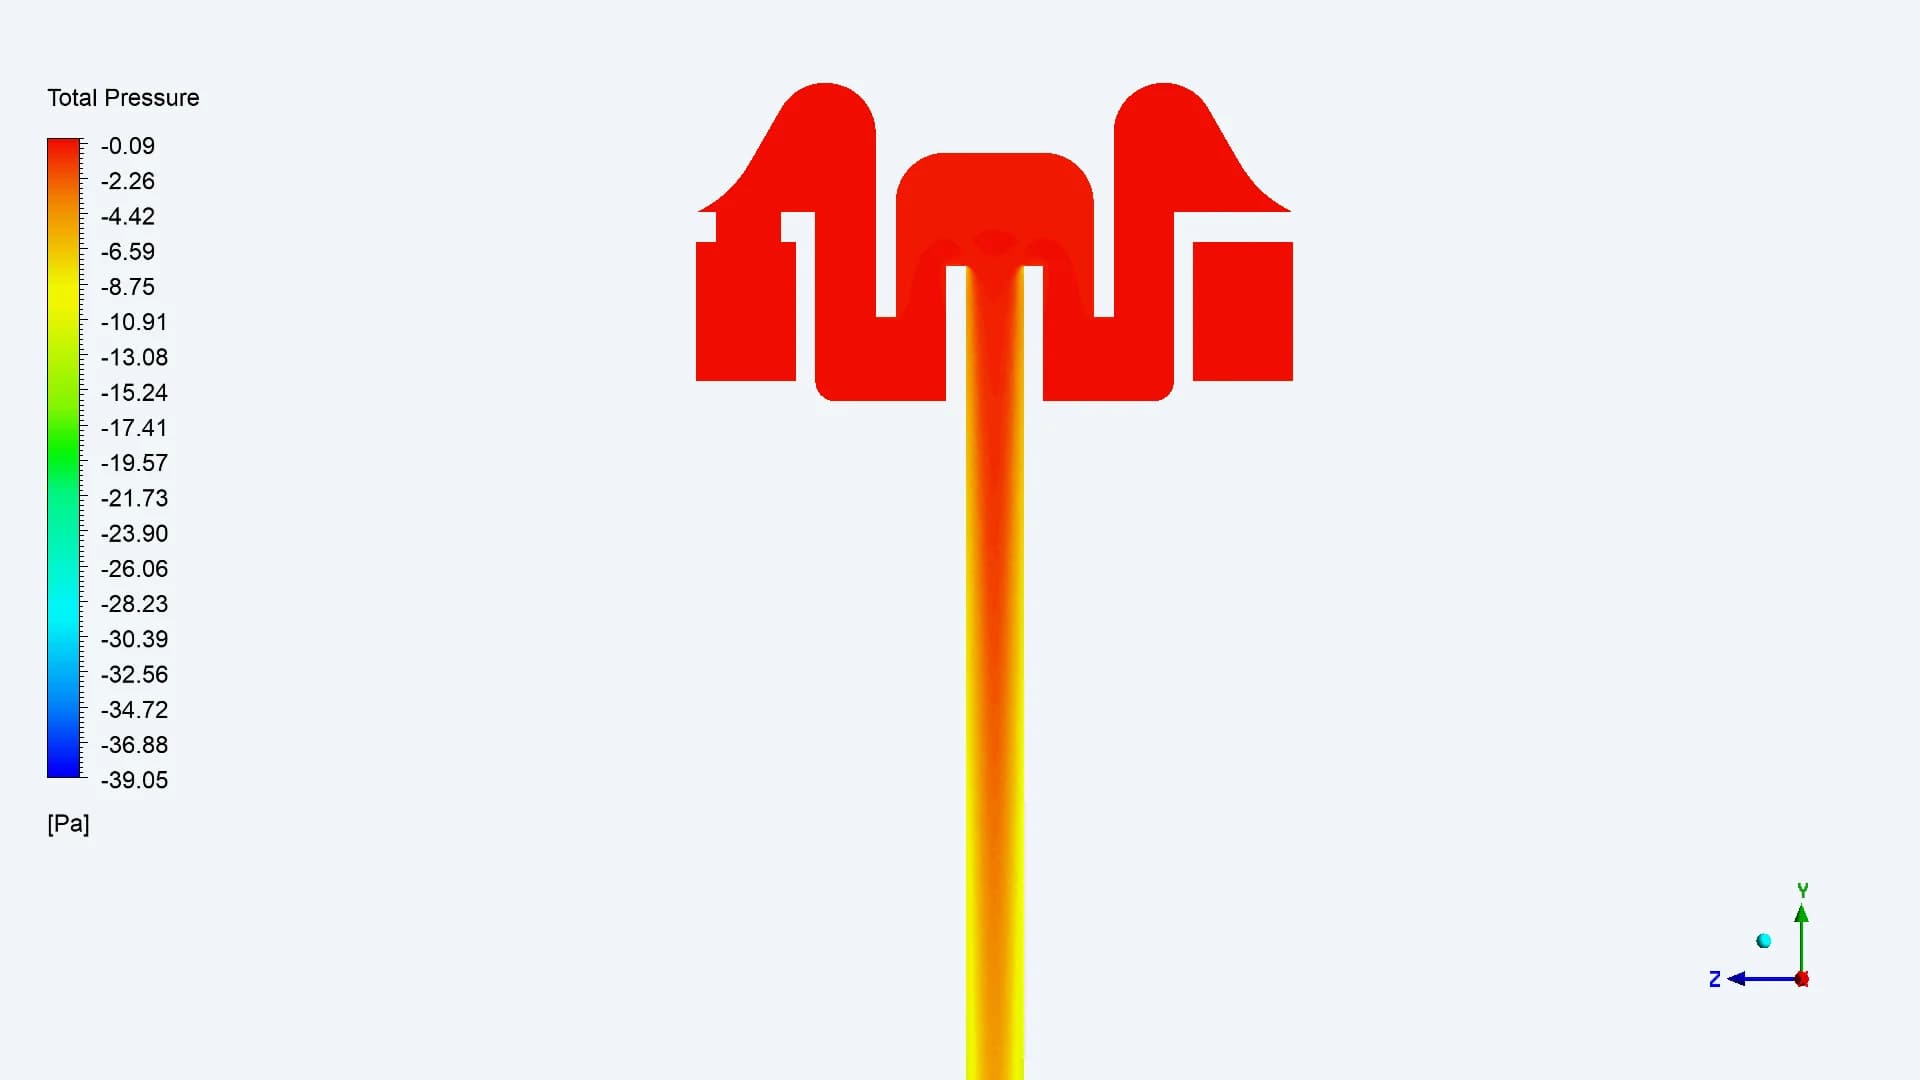
Inlet cowl and stem entry
Nozzle and chamber
The original pressure views locate changes around the inlet passage and nozzle. Together with velocity and particle tracks, they support review of the restrictive features. The final plots use the case assumption of zero filter pressure drop
11 / FOLLOWING THE PARTICLES
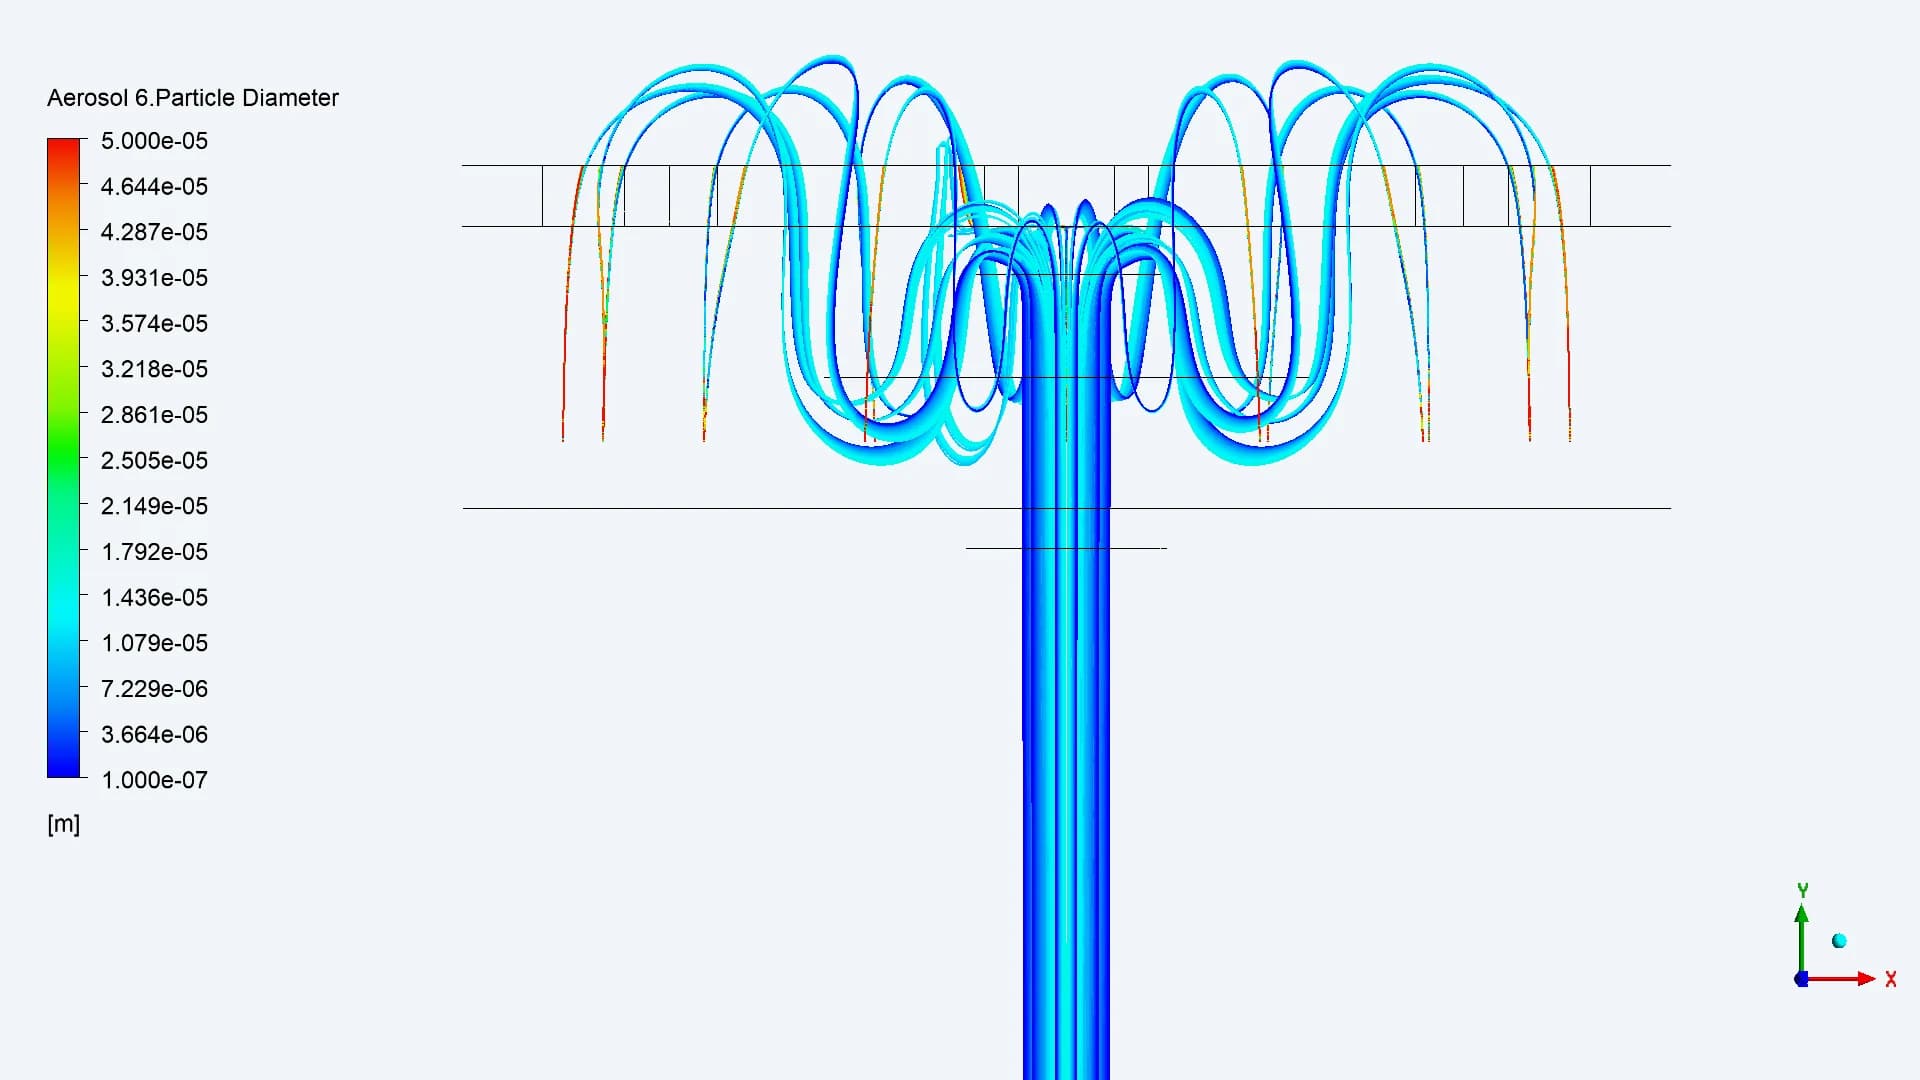
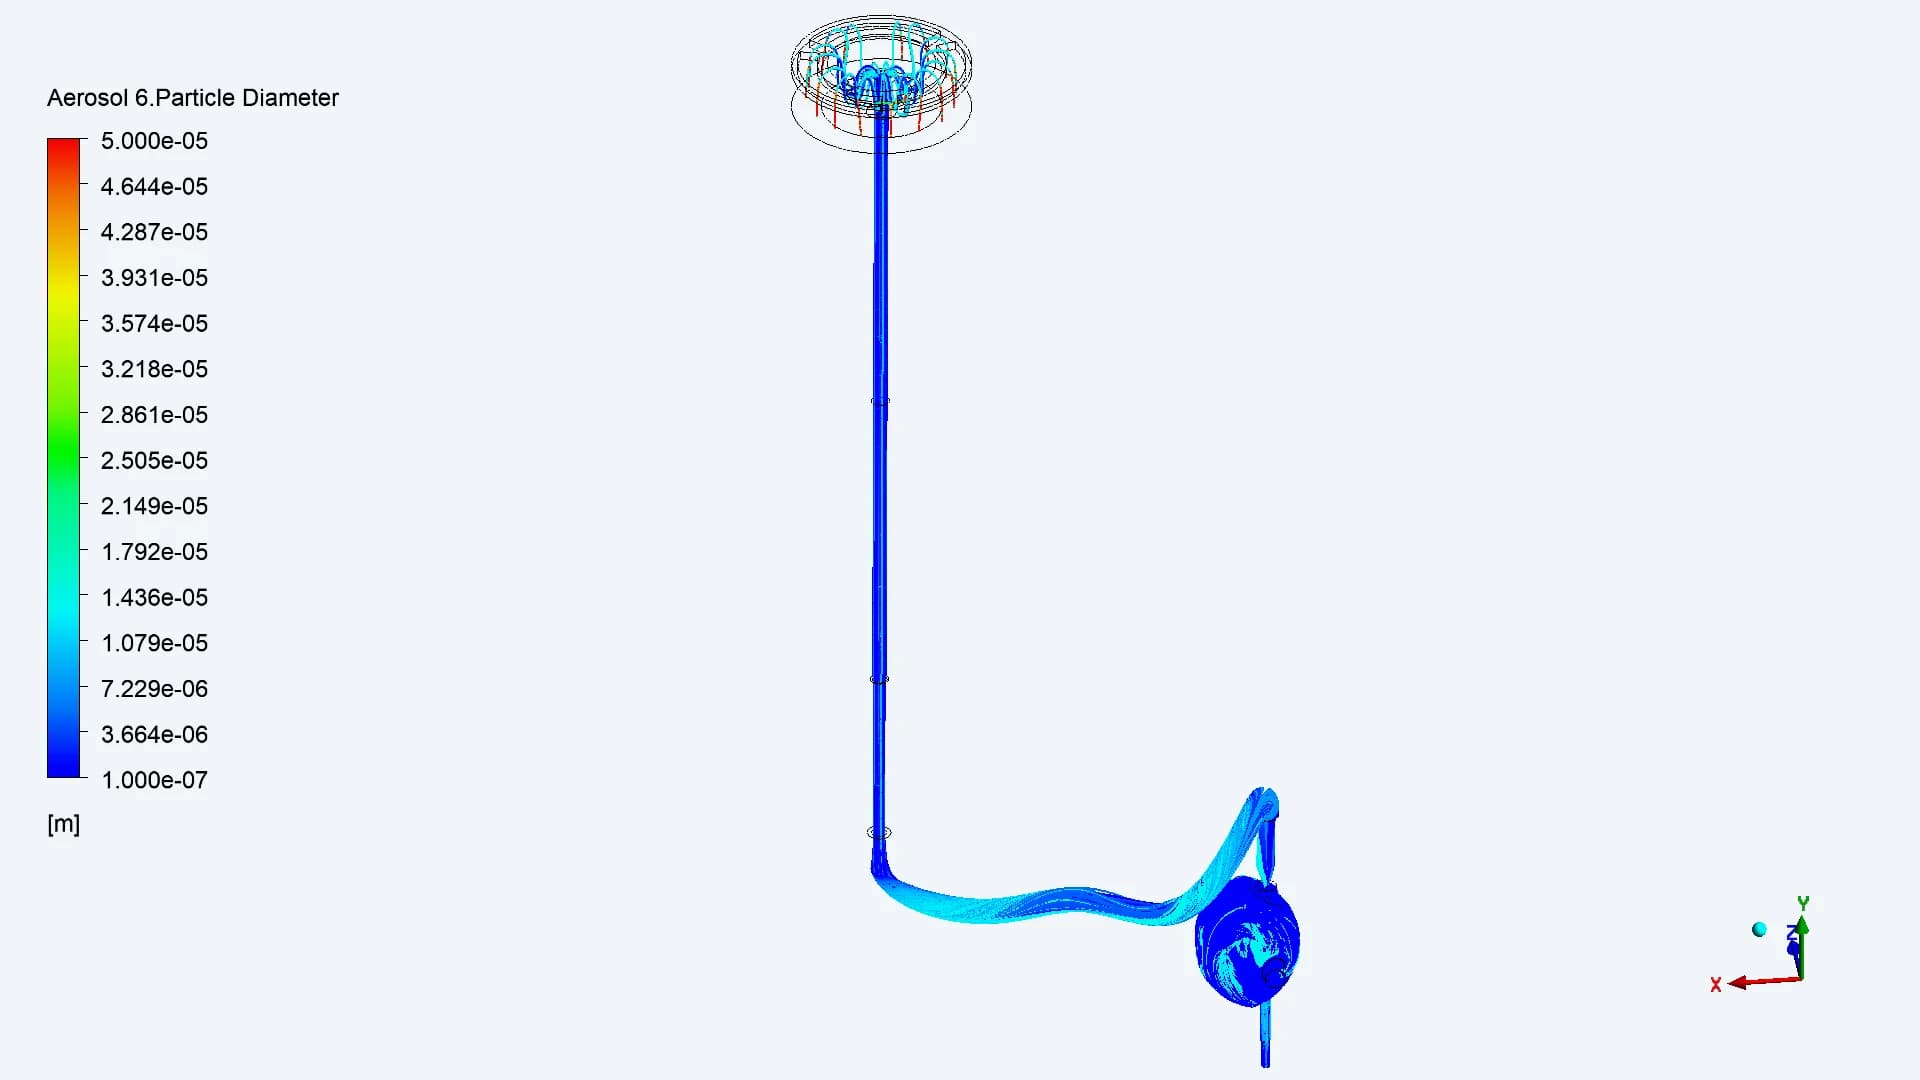
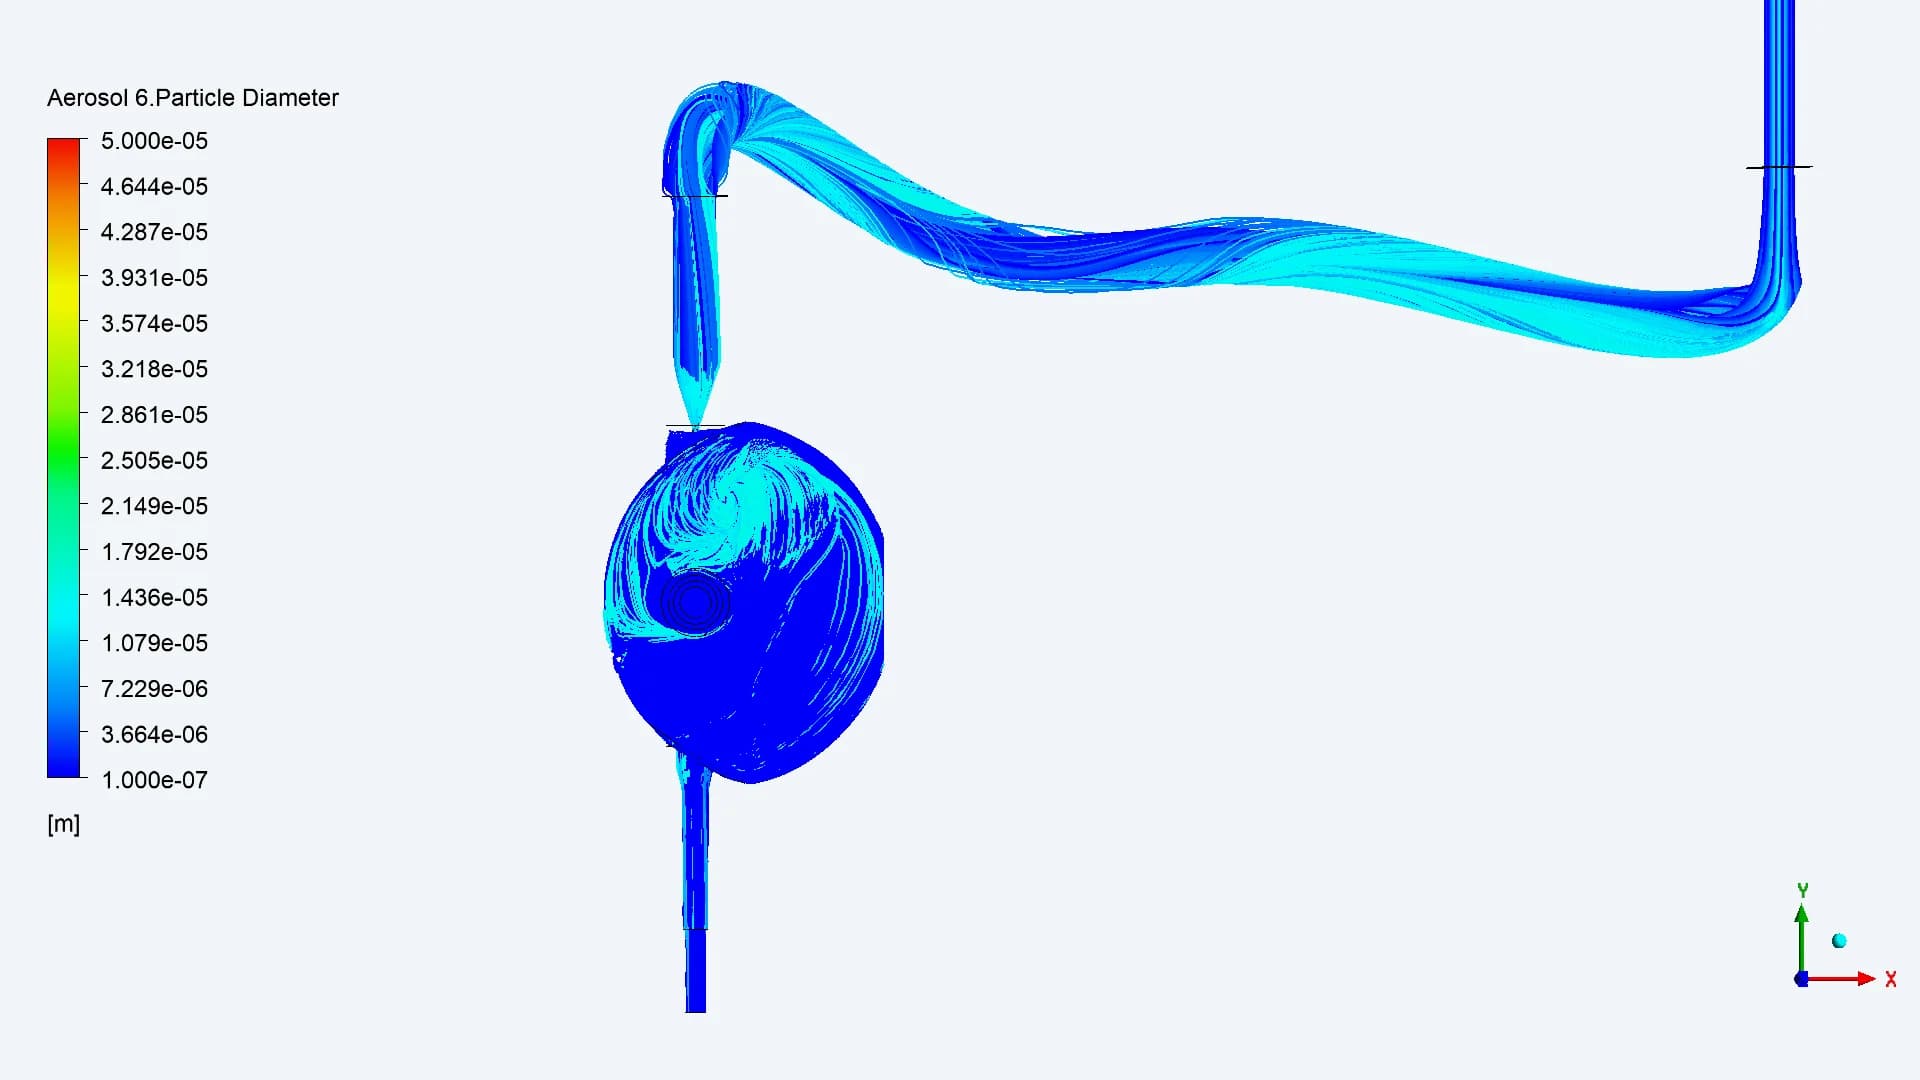
Trace the route from cowl to chamber
Entry and filter passage
Transport through the stem
Nozzle entry and chamber motion
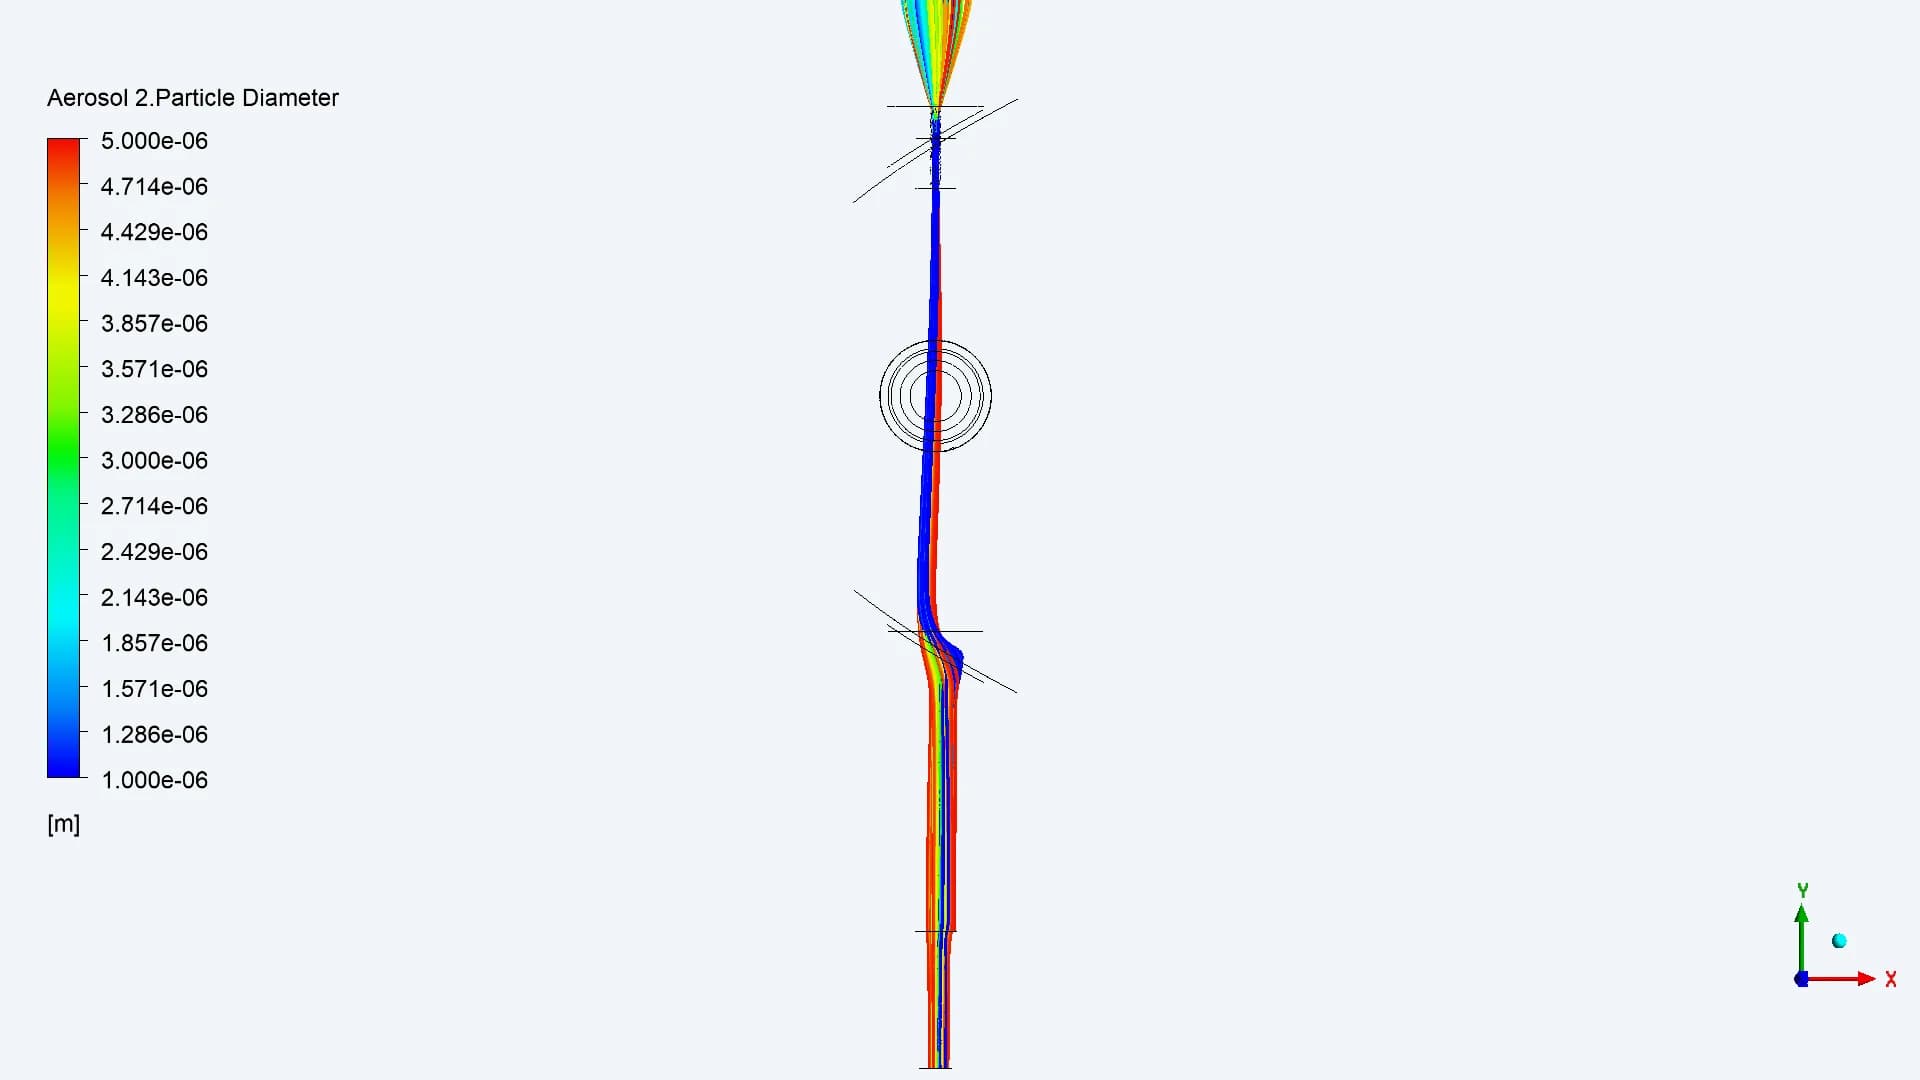
The complete trajectory view connects upstream entry to downstream behaviour. The next views separate particle sizes, making the focused paths and recirculating motion easier to distinguish
12 / SIZE-RESOLVED RESULTS AT 4 LPM
One airflow field. Different particle responses
50–15 µm / Filtered
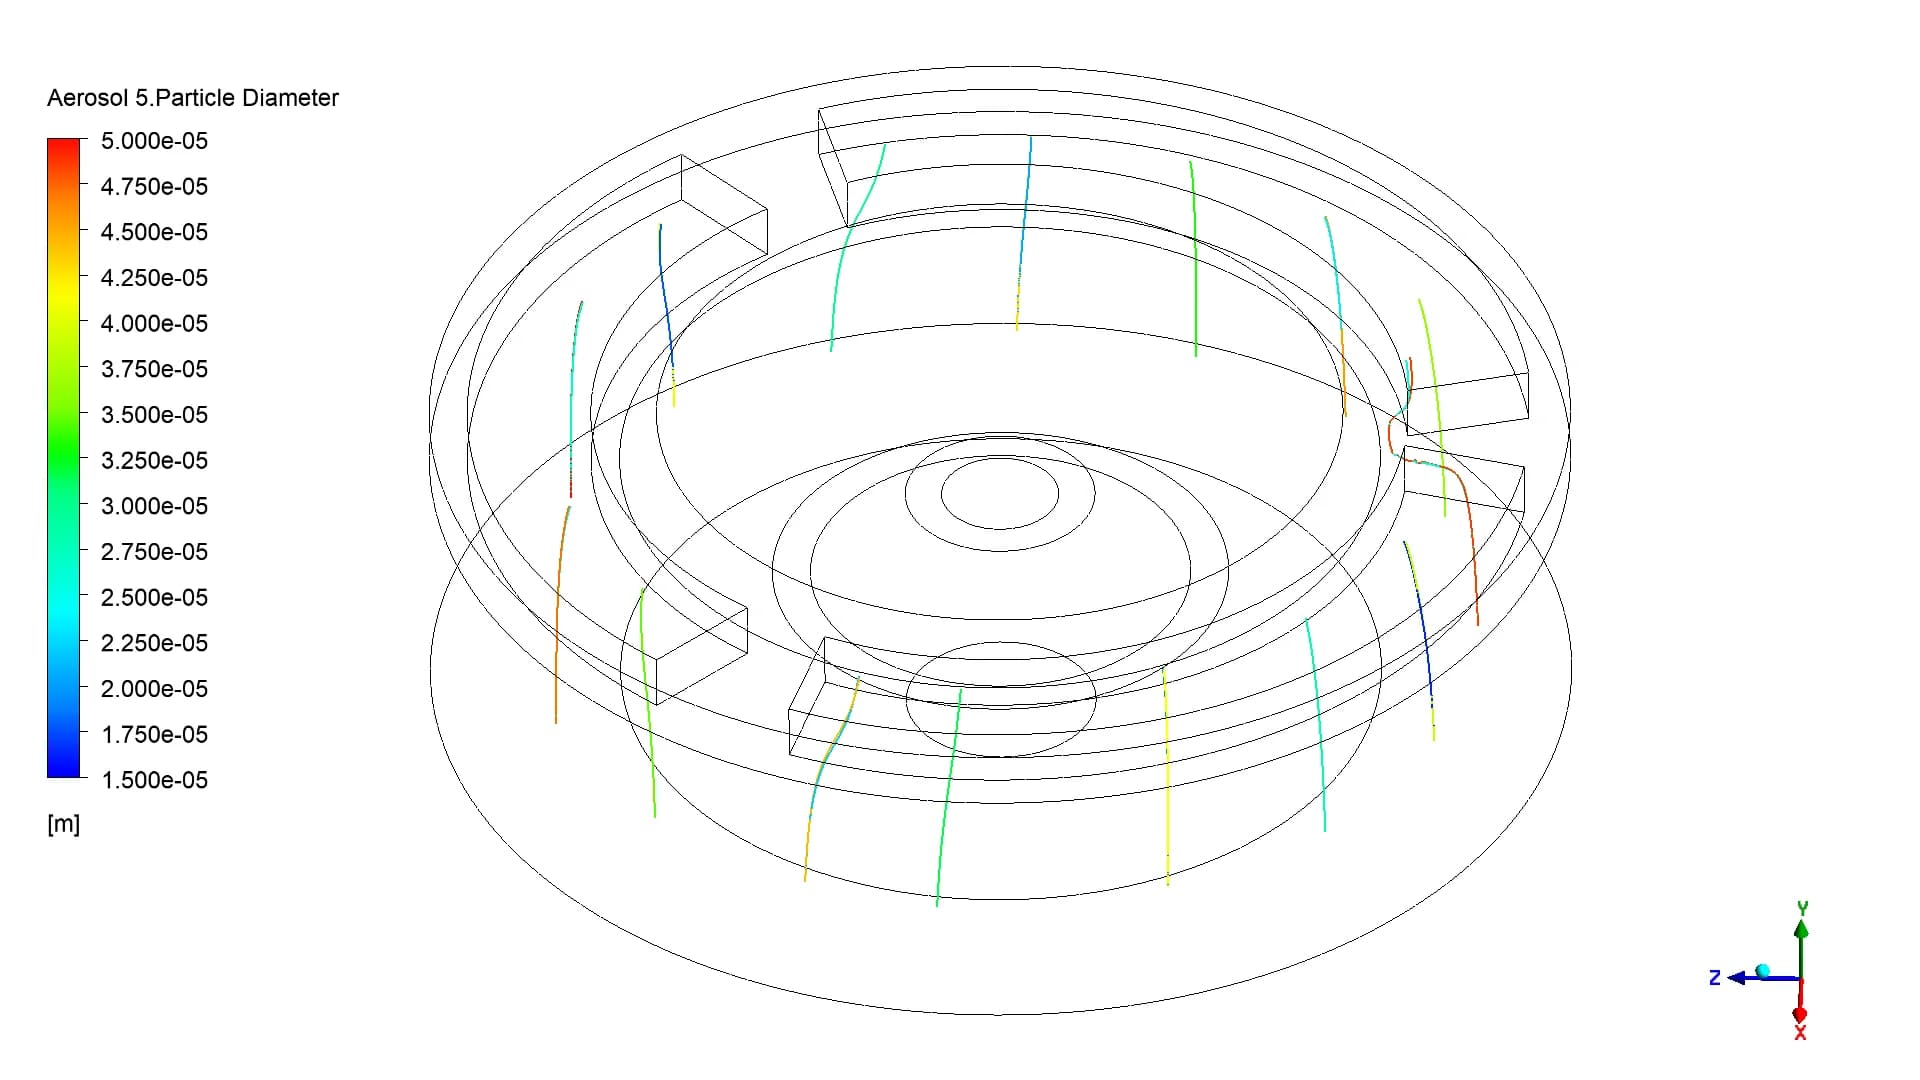
The coarse band is removed by the modelled cutoff
15–10 µm / Focus and recirculation
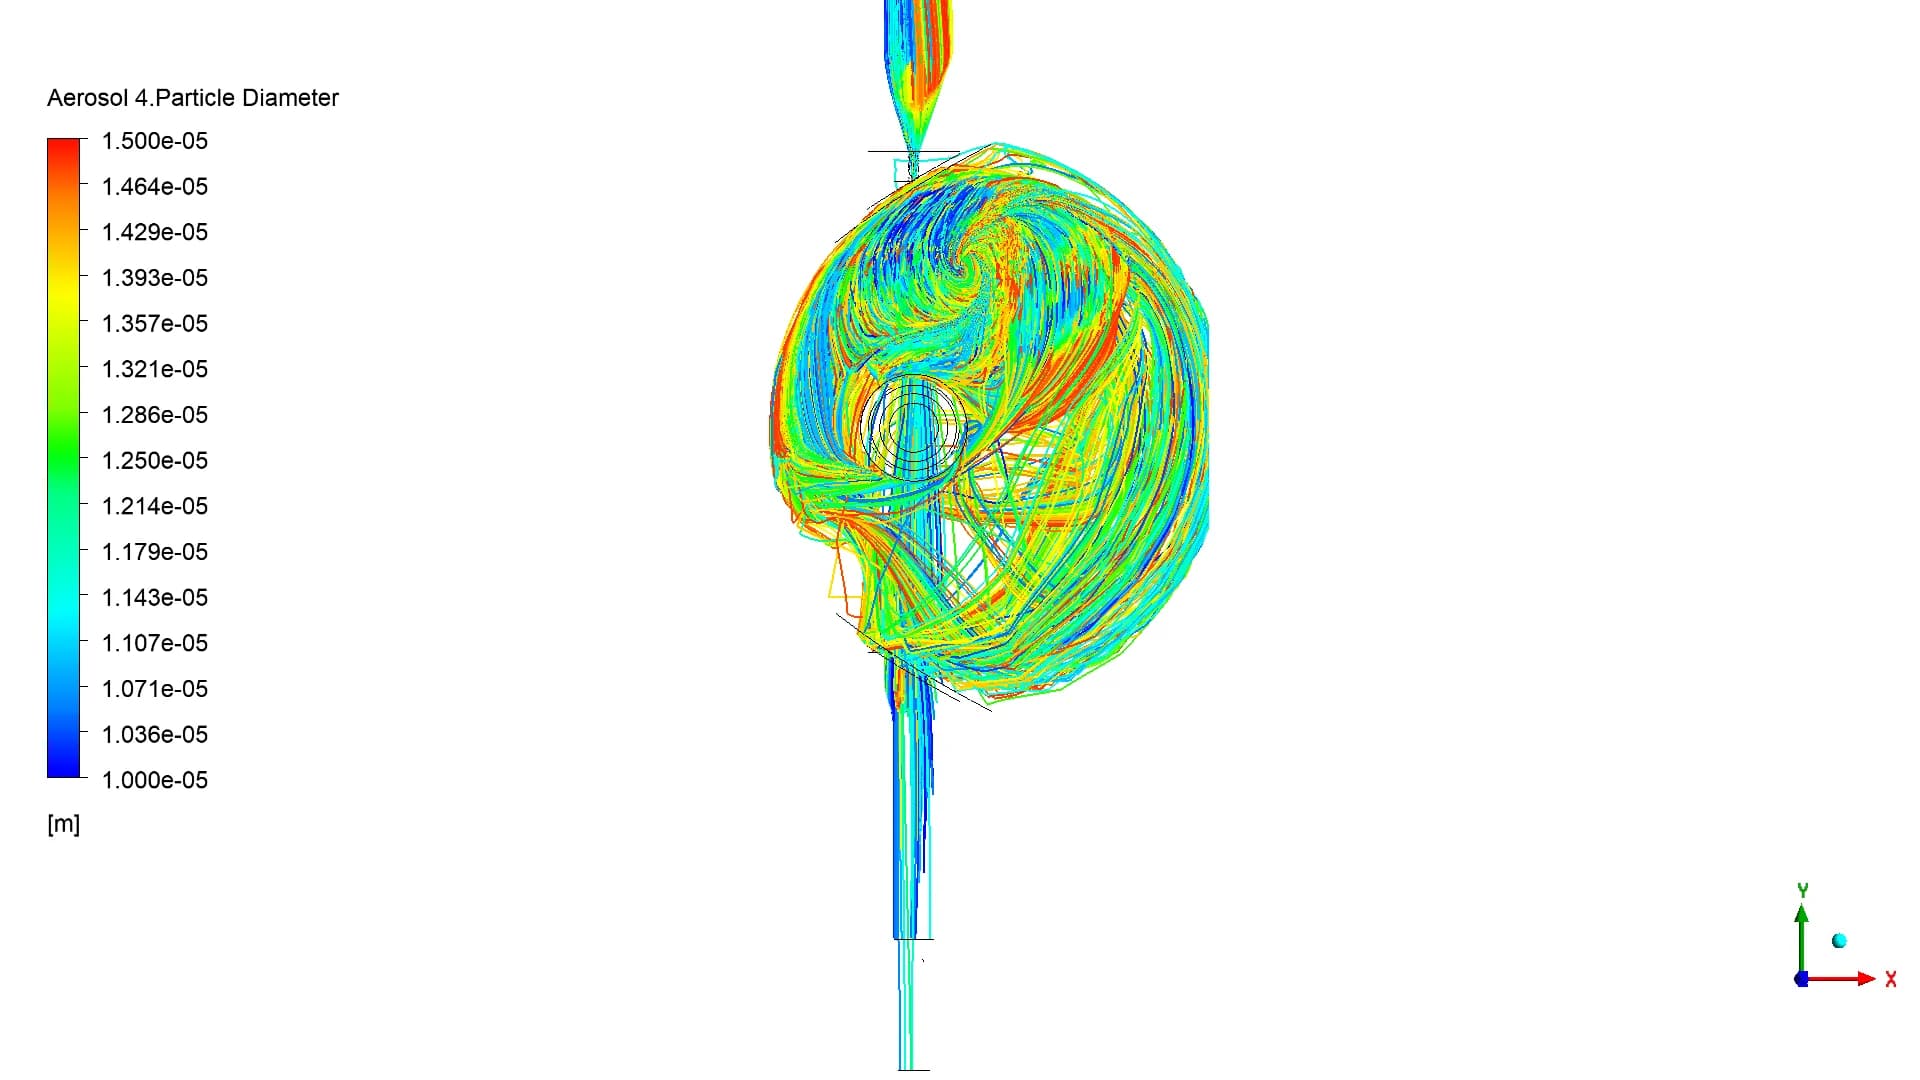
A reported focused region coexists with wider paths
10–5 µm / A defined central path
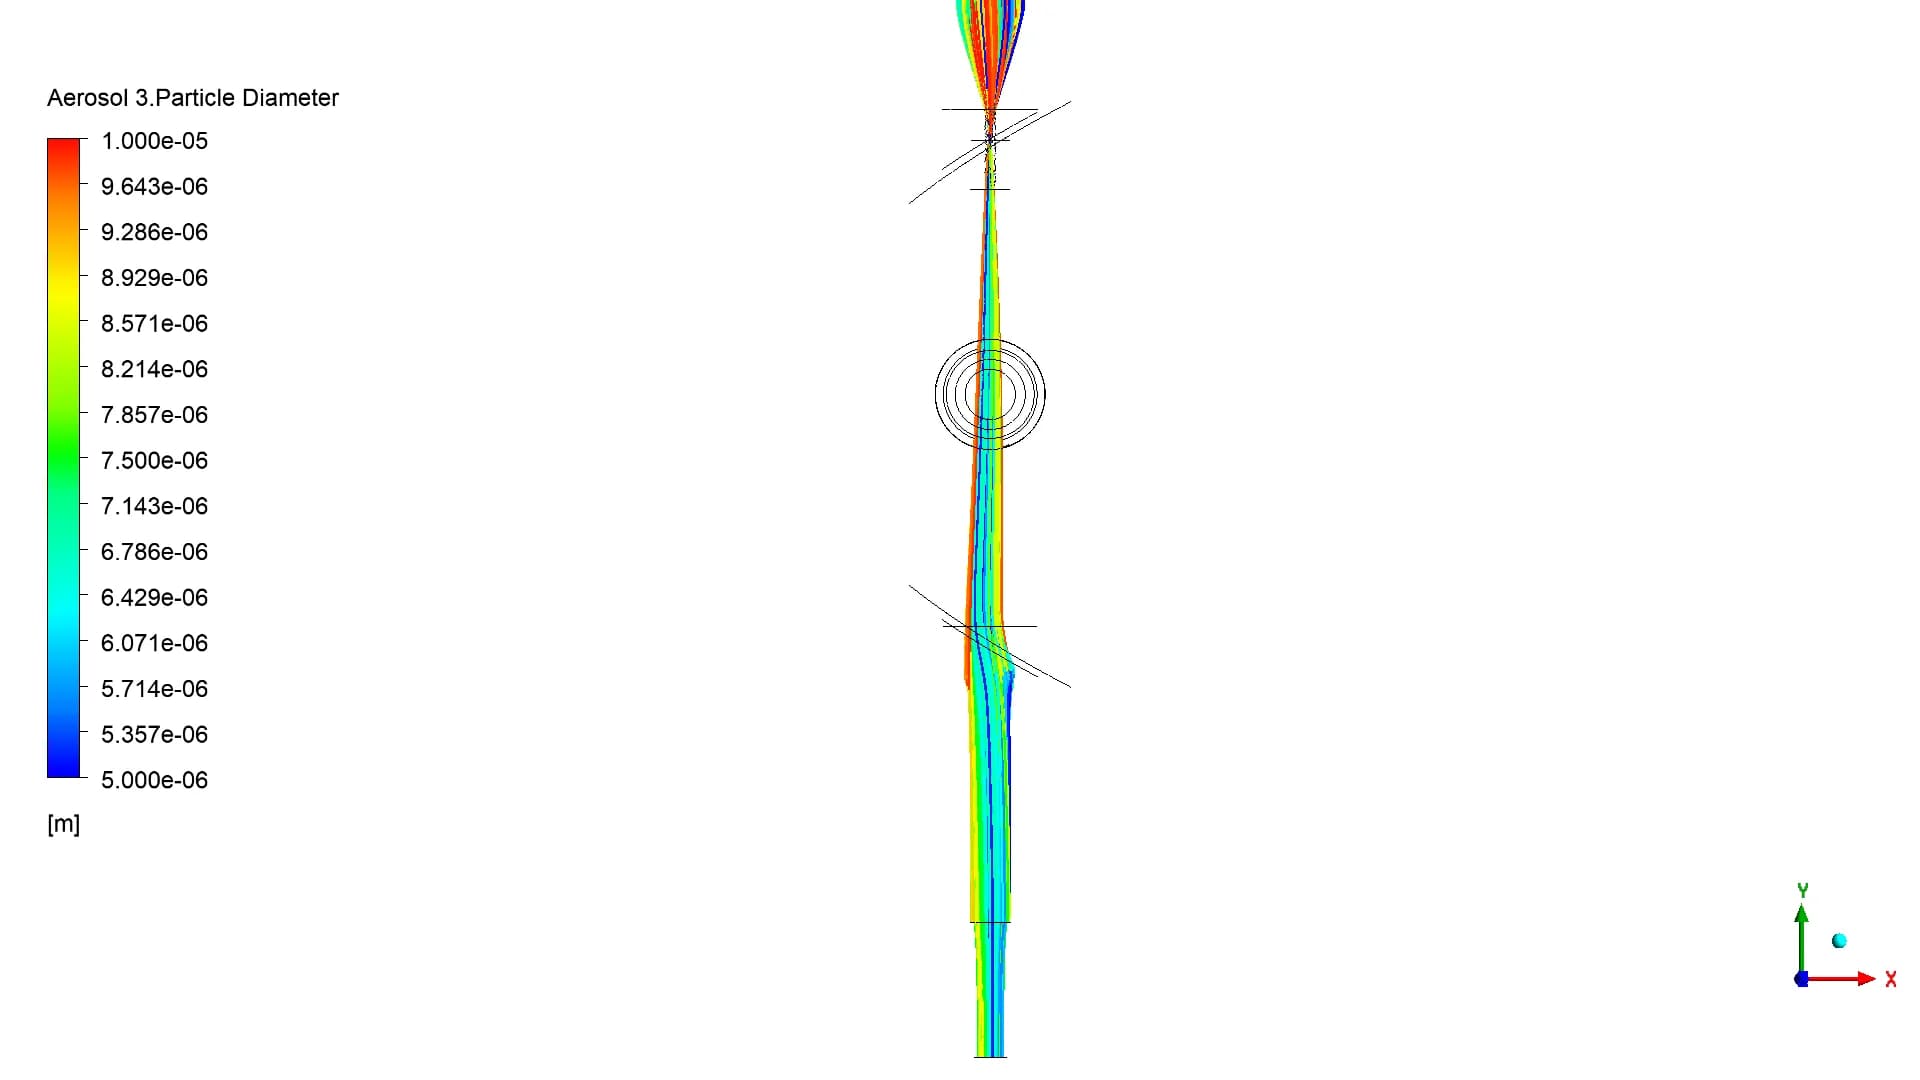
The report gives a 2.04 mm centre-plane width
5–1 µm / A narrow focused region
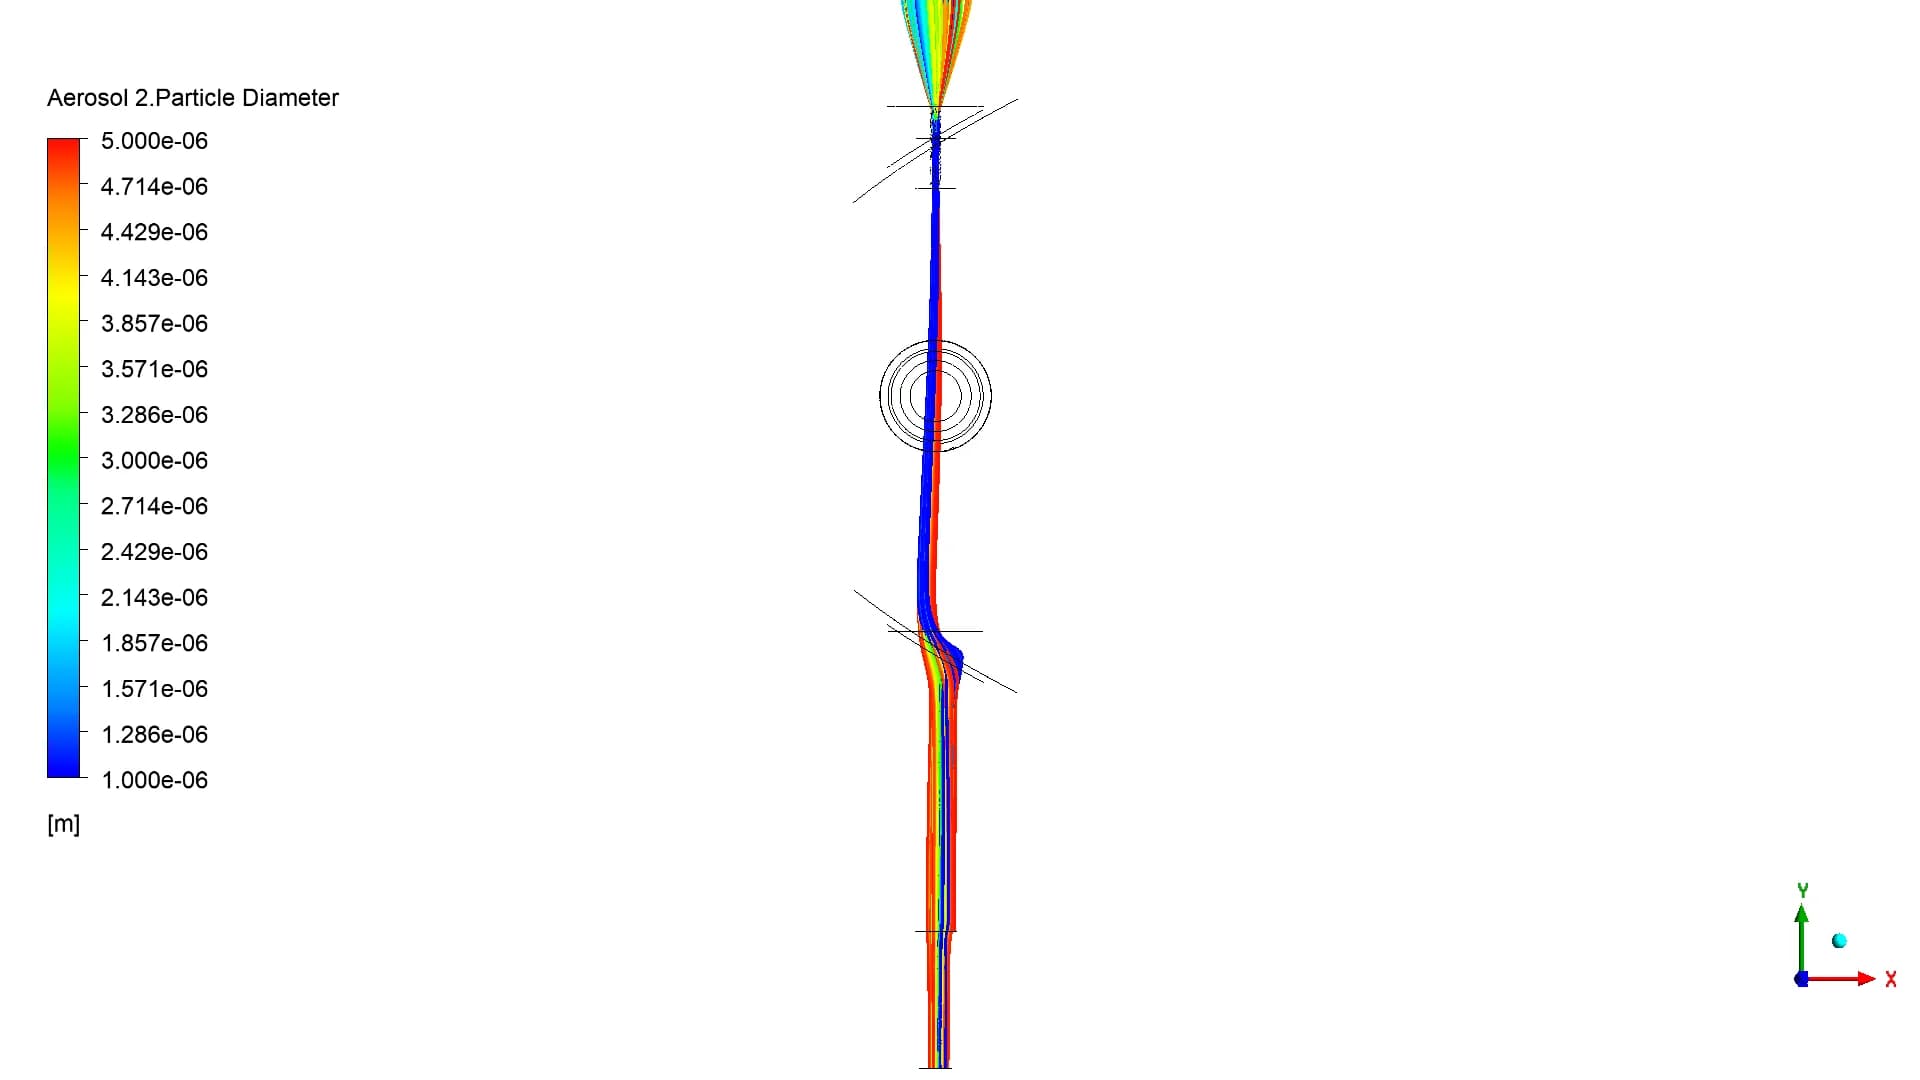
The reported centre-plane width is 1.05 mm
1–0.5 µm / Dispersed
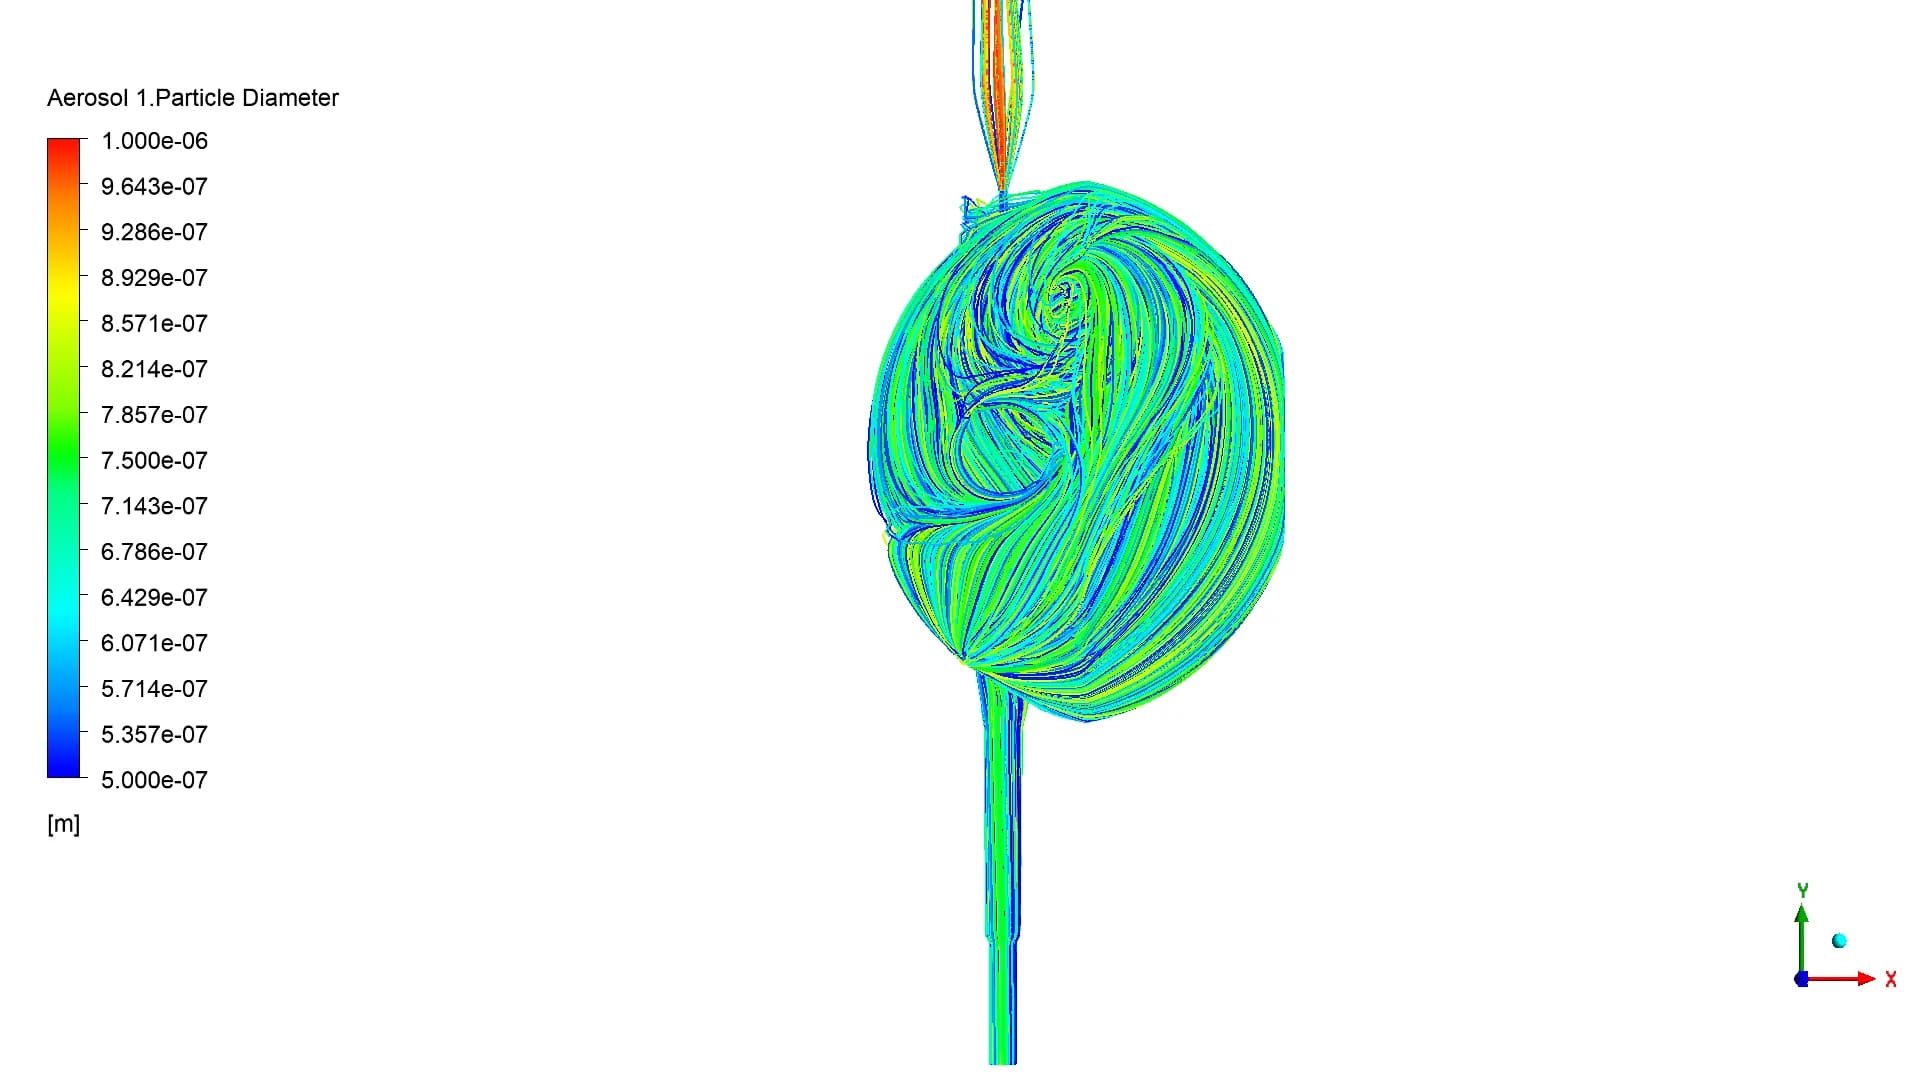
The finer band spreads through the chamber
0.5–0.1 µm / Dispersed
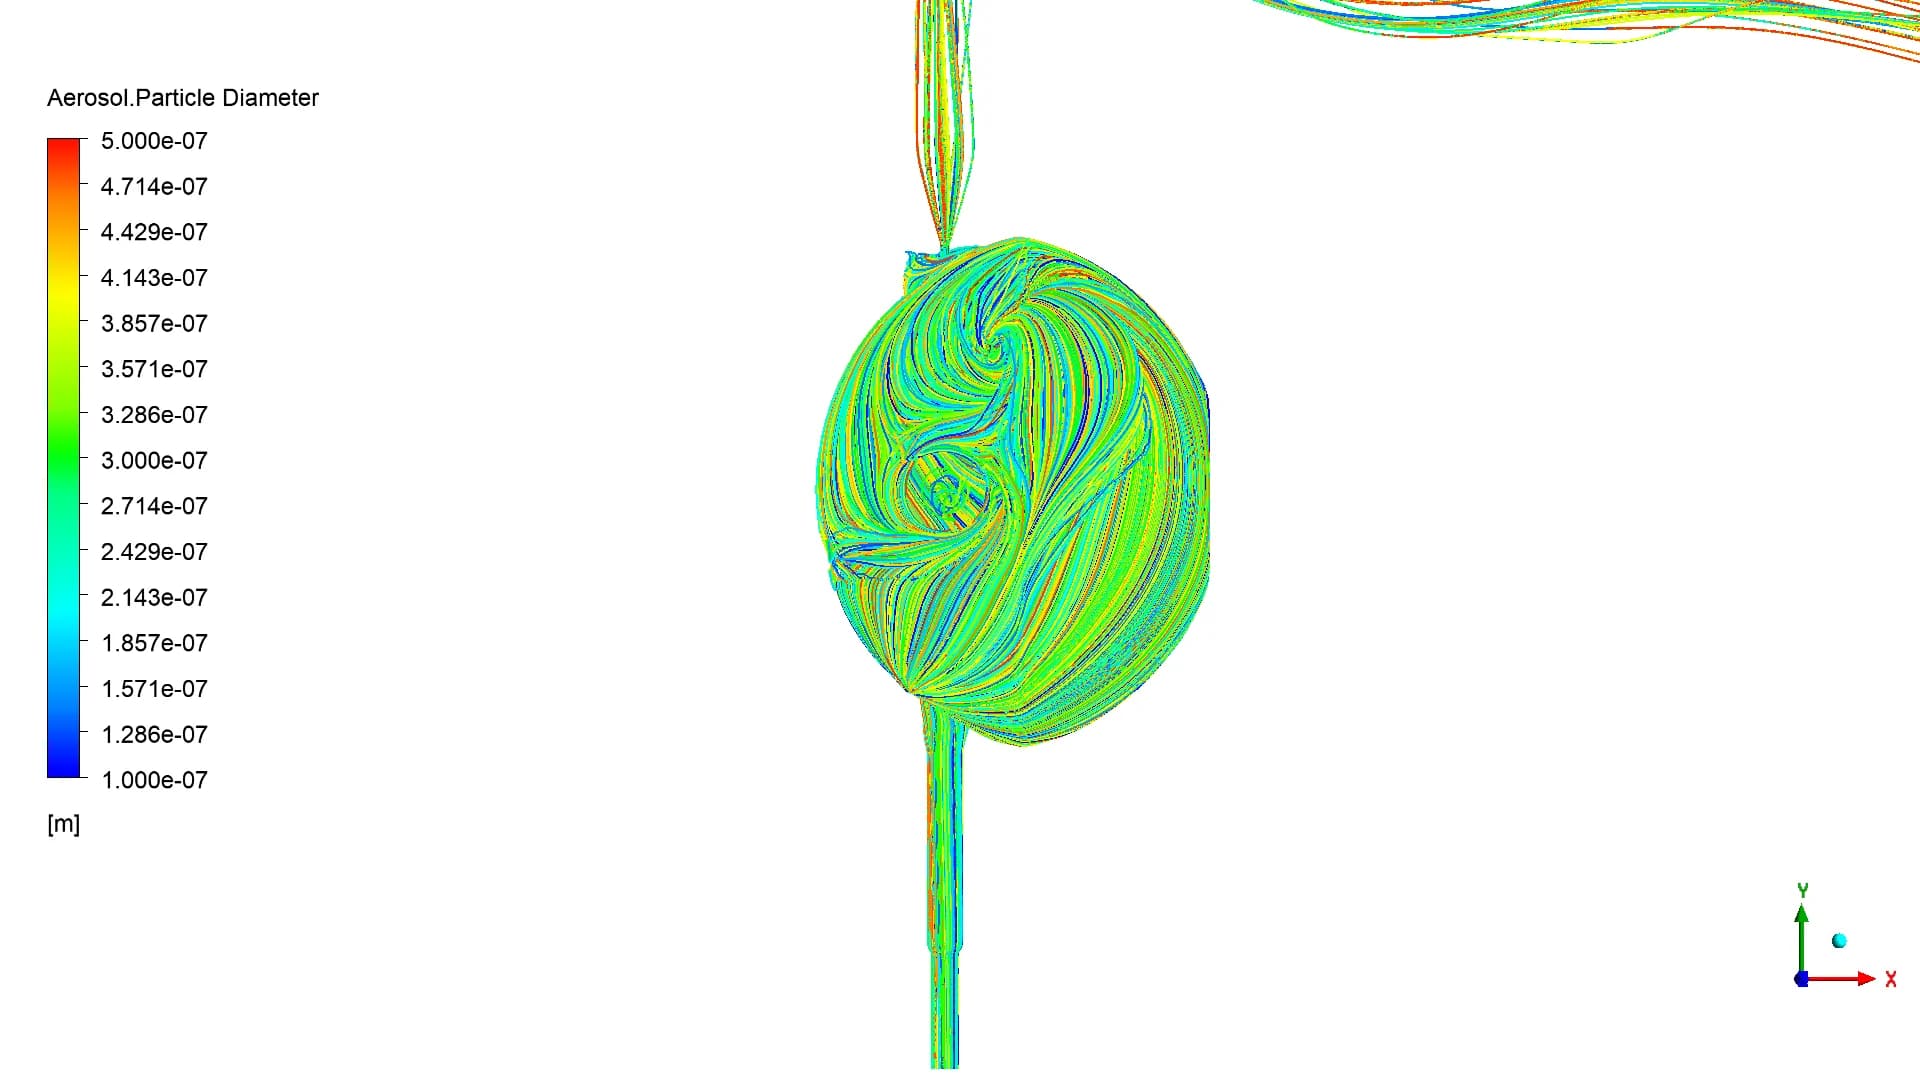
The smallest band also shows widespread motion
13/ FOLLOWING THE PARTICLES
Trace the route from cowl to chamber
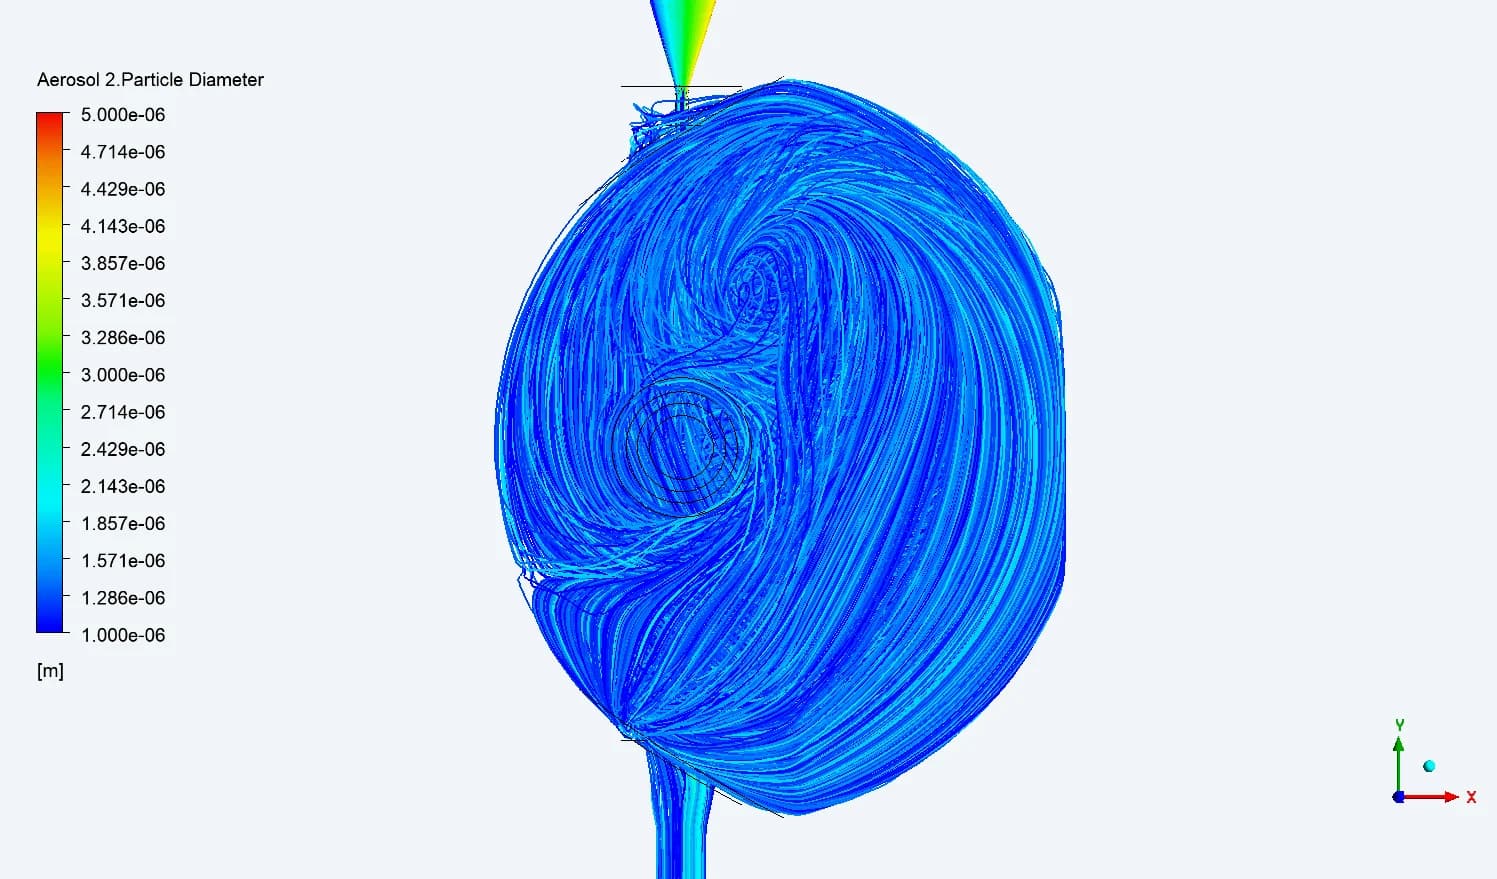
2 LPM
Reported as dispersed
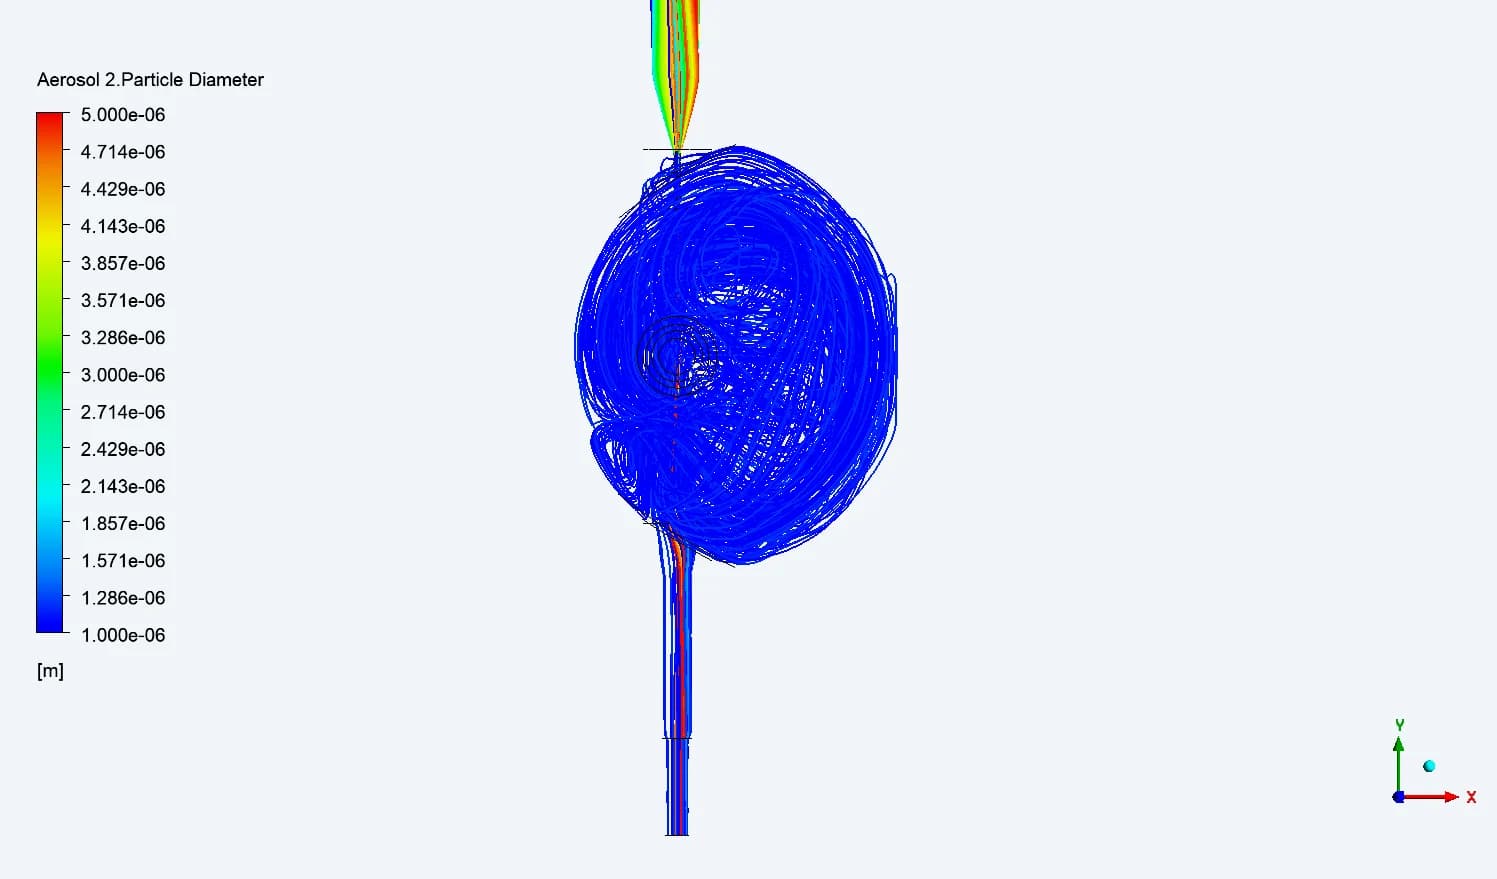
3 LPM
Centre-plane width: 1.10 mm
4 LPM
Centre-plane width: 1.05 mm
14 / QUANTIFYING THE FOCUSED REGION
Measure the beam at the chamber centre
| PARTICLE DIAMETER | 2 LPM | 3 LPM | 4 LPM |
|---|---|---|---|
| 15–10 µm | 2.59 mm | 1.97 mm | 1.57 mm |
| 10–5 µm | 2.29 mm | 2.10 mm | 2.04 mm |
| 5–1 µm | Dispersed | 1.10 mm | 1.05 mm |
| 1–0.5 µm | Dispersed | Dispersed | Dispersed |
| 0.5–0.1 µm | Dispersed | Dispersed | Dispersed |
For the three larger transmitted bands, the final report shows narrower centre-plane widths as flow rises. The submicron bands remain classified as dispersed at every studied flow rate
15 / THROUGH THE CHAMBER
A narrow centre does not mean a narrow exit
| 5–1 µm PARTICLE BAND | NOZZLE | PLANE 03 | CENTRE / 04 | PLANE 05 | EXIT |
|---|---|---|---|---|---|
| 3 LPM | 0.65 | 0.73 | 1.10 | 1.84 | 2.85 |
| 4 LPM | 0.54 | 0.66 | 1.05 | 1.77 | 2.90 |
Reported focused-beam widths in mm. Source: final Model 04 summary
The focused region widens downstream in both cases. At 4 LPM, the 5–1 µm band is slightly narrower at the centre than at 3 LPM, but slightly wider at the exit. The location of interest therefore matters to the design decision
16 / PARTICLE VELOCITY
Track acceleration and downstream deceleration
| PARTICLE DIAMETER / 4 LPM | AT NOZZLE | AT PLANE 03 | AT EXIT |
|---|---|---|---|
| 15–10 µm | 87.6 m/s | 73.0 m/s | 36.5 m/s |
| 10–5 µm | 116.7 m/s | 77.8 m/s | 29.1 m/s |
| 5–1 µm | 150.9 m/s | 62.8 m/s | 12.5 m/s |
| 1–0.5 µm | 169.2 m/s | 52.0 m/s | 13.0 m/s |
| 0.5–0.1 µm | 161.1 m/s | 53.6 m/s | 17.9 m/s |
The reported particle velocities fall between the nozzle and downstream locations. Size-resolved values add information that a single peak airflow velocity cannot provide
17 / GEOMETRY COMPARISON
A design change benefits some size bands more
| CENTRE-PLANE WIDTH AT 4 LPM | MODEL 03 / 1.0 mm NOZZLE | MODEL 04 / 0.8 mm NOZZLE |
|---|---|---|
| 15–10 µm | 2.26 mm | 1.57 mm |
| 10–5 µm | 1.64 mm | 2.04 mm |
| 5–1 µm | 1.43 mm | 1.05 mm |
Model 04 has a narrower reported centre-plane beam for the 15–10 and 5–1 µm bands, while the 10–5 µm band is wider. The comparison supports a size-specific design review, rather than an overall performance ranking
PROJECT OUTCOME
Make the particle behaviour useful to the designer
A traceable model
A documented route from geometry and mesh to boundary conditions, injection bands and comparison planes
An explained response
Original flow contours and particle tracks reveal focusing, broadening and dispersed motion across the chamber
A basis for refinement
Size- and flow-dependent measurements guide the review of inlet restrictions, nozzle geometry and the required observation region
From a complex flow path to a clear design discussion
The study established where particles focus, where they disperse and how that behaviour changes with size and flow. It provided an evidence-led basis for the next air-sampler design decisions